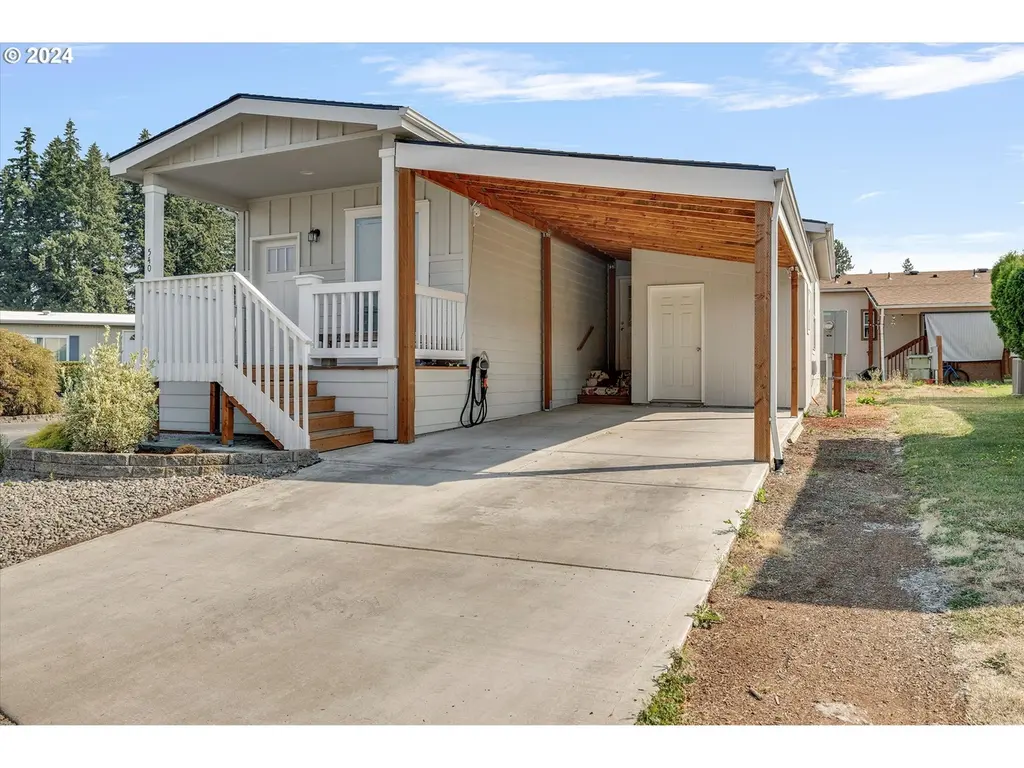
540 SW Liberty Bell Dr · Beaverton, OR
Flood risk 1/10 · Minimal
- FEMA flood zone
- X (unshaded)
- Chance of flooding over 30 yrs
- 0.0%
- Est. flood insurance / yr
- $507 – $1,088
Fire risk 1/10 · Minimal
- Est. fire insurance / yr
- $498 – $926
Heat risk 3/10 · Minor
- Hot days now (above 92°F)
- 7 days/yr
- Hot days in 30 yrs
- 14 days/yr
Wind risk 1/10 · Minimal
- Chance of severe wind over 30 yrs
- —
Air-quality risk 8/10 · Major
- Unhealthy air days now
- 11 days/yr
- Unhealthy air days in 30 yrs
- 11 days/yr
Risk factors via First Street. Map © Google.
Why this score? — see what drove the D grade
The composite is a weighted blend of 9 inputs, each scored 0–100. Each bar is that input's sub-score; the figure is the points it added to the 100-point composite (weight × sub-score).
- Cash flow +16.7/30.0
- Schools +6.3/10.0
- DSCR +5.2/10.0
- 1% rule +4.5/10.0
- Livability +4.4/5.0
- Condition / age +2.5/5.0
- Rent growth +2.1/5.0
- ARV discount +0.0/15.0
- Appreciation +0.0/10.0
$145,000
🖨 Deal sheet (PDF) 📄 Offer letter ✓ Due diligence
Listing remarks MLS
MOTIVATED SELLER!! Like new manufactured home located at Heritage Village Mobile home park. Built in 2019, this home offers 1,008sqft, 2 bedrooms, 2 bathrooms, open concept kitchen/living area, breakfast bar, laundry area, spacious guest bedroom, full bath, large primary with walk in closet and full bath, front deck, heat pump and more. Home is conveniently located close to schools, shopping, and food. Space rent is $1,255/month. Includes fitness room, kids park, pool and community room.
Key facts
- Open concept kitchen
- Front deck
- Laundry area
Tags
Neighborhood map
What this means for you Summary
Snapshot
- This is a 2-bed/2.0-bath manufactured listed at $145k.
Deal economics
- At list price, monthly cash flow is $89 ($1k/yr) — positive.
- The deal already cash-flows at list — no discount required.
- To meet the 1% rule (rent ≥ 1% of price), the offer needs to be $138k (4.7% below list).
- Recommended offer: $128k (12.0% below list) — sets the bar for market timing.
- Cap rate 7.0% vs local median 2.3% in Beaverton — top-decile yield for the area; either an underpriced asset or a hidden risk that comps aren't pricing in. Stress-test before assuming the spread holds.
Location & tenants
- Location reads 88/100 on livability (#10 in OR, #251 nationally) — a professional / high-income tenant draw. Strengths: amenities A+, commute A+, employment A+; Watch: crime D, cost of living F.
- Beaverton SD 48J (urban): math 68% / reading 76% proficiency, ranked #3 of 58 in OR (top 5%) — strong family-tenant draw, lease renewals of 3-5y typical.
- Zoned schools: Elmonica Elementary School (math 64% / reading 84%, grade A, #23 of 412 statewide, top 7%, 413 students, 41% FRL); Five Oaks Middle School (math 44% / reading 74%, grade B, #17 of 128 statewide, top 14%, 781 students, 49% FRL); Westview High School (math 75% / reading 75%, grade A-, #2 of 143 statewide, top 6%, 2,442 students, 29% FRL).
- Market conditions: Rents soft (-1.6%/yr); 244 active listings in the ZIP; 40 comparable units currently listed for rent nearby; rentals leasing fast (median 10d on market — plan ~1-2 weeks tenant-placement turnaround); solid renter incomes; 2,224 units permitted in Washington County in 2024 (242 in 5+ unit buildings).
- This rent is only 16% of the median local income ($105k/yr) — well below the 30% rent-burden line; pricing power to push rent on renewal without tenant pushback.
Forward outlook
- Local home prices are declining (-3.0%/yr); year-one equity from $1k of loan paydown is wiped out by about $4k of value loss. Plan a longer hold.
- Washington County population projected at +33% by 2050 — long-run rental-demand tailwind backs the buy-and-hold thesis.
Negotiation context
- It's been on market 129 days — a 12% lower offer ($128k) is reasonable based on typical stale-listing flexibility.
Questions for the listing agent
- It's been on market 129 days. Have you received any prior offers? Is the seller open to a 12% concession, seller financing, or rate buy-down credit?
- Why hasn't it sold? Are there any deal-killer items the seller is aware of (foundation, flood, title, zoning, code violations)?
- Is there a deadline driving the sale (1031 exchange, divorce, estate, relocation)? That informs how much negotiation room exists.
- Schools are A-rated — typically a magnet for longer-tenancy family renters. What's the average tenant stay here, and is there a school-zone premium baked into asking?
- Crime grade is D in this area — have there been break-ins, vandalism, or insurance claims at this property in the last 3 years? What carrier currently insures it and at what premium?
- The area grade is low — what's the realistic commute time and amenity access for the typical tenant pool here? Any planned neighborhood developments (good or bad) we should know about?
- What's the average days-on-market for RENTAL listings here right now (not sales)? A rising rental-DOM trend means longer vacancies and softer asking-rent achievability than the comps imply.
- What's the recent tenant-quality profile in this submarket — average credit score on applications, eviction rate, late-payment / NSF rate, and stable-employment percentage? A property-management company in the area should have these aggregated.
- How much new for-sale + rental construction is in the pipeline within 1–3 miles? Heavy new supply typically softens prices + rents 12–24 months out; constrained supply supports both.
Investment metrics
- 1% rule
- 0.95% ✗
- Cap rate
- 7.03%
- Cash-on-cash
- 2.64%
- DSCR
- 1.12
- GRM
- 8.7
CMA / ARV
- ARV (median comp)
- $119,410
- List price
- $145,000
- Delta
- 21.43%
- Verdict
- OVERPRICED
- Comps
- 4 within 1.0 mi
Show comp detail 2 sales within ~0.75 mi
| Address | Dist | Beds/Ba | Sqft | Sold | Price | $/sf | Match |
|---|---|---|---|---|---|---|---|
| 332 SW Plymouth Way | 0.08mi | 2/1.0 | 960 (+2%) | 13mo | $100,000 | $104 | 78 |
| 17717 SW Cumberland Way | 0.19mi | 2/1.0 | 896 (-4%) | 10mo | $80,000 | $89 | 71 |
Match score weights: distance 35% · size 25% · config 20% · recency 20%. Top-matched comps best support the ARV.
Projected returns pro-forma
-3.0% appreciation · 0.0% rent growth · sell at horizon
- IRR
- -15.6%
- Equity multiple
- 0.46×
- Total profit
- $-21,844
- Equity at exit
- $21,620
- IRR
- -13.3%
- Equity multiple
- 0.33×
- Total profit
- $-27,267
- Equity at exit
- $12,537
Cash invested: $40,600 (down + closing). Projections, not guarantees.
Landlord ↔ Tenant lean methodology
- Overall (STATE)
- 28 Tenant-Leaning
- State Oregon
- 28 Tenant-Leaning · D+6
- County
- — inherits STATE
- City
- — inherits STATE
ZIP-level market 97006
- Rents YoY
- -1.6%
- Active inventory
- 244
- Price-to-rent
- 8.7×
Monthly cashflow live
- Estimated rent
- $1,381 high interval (Pro) →
- Mortgage (P&I)
- −$760
- Tax est. 1.5%
- −$181 /mo · $2,175/yr
- Insurance
- −$60
- HOA
- −$0
- Lot rent leased land?
- −$0
- Vacancy / Maint / Mgmt
- −$290
- Net cashflow
- $89
Break-even live
Sensitivity live
| Price | -10% $189 | -5% $139 | +0% $89 | +5% $39 | +10% $-11 |
|---|---|---|---|---|---|
| Rent | -10% $-20 | -5% $35 | +0% $89 | +5% $144 | +10% $198 |
| Rate | -1.0pp $162 | -0.5pp $126 | base $89 | +0.5pp $52 | +1.0pp $13 |
UW: 25.0% down · 7.5% · 30yr · 1.5% tax · 5.0% vac · 8.0% maint · 8.0% mgmt
Financing live
Cash to close
- Down payment
- $36,250
- Closing costs
- $4,350
- Reserves months
- —
- Total cash needed
- —
Loan-product check · same deal, 3 products live
Conventional
25% down · 7.5% · 30yr
- Down + closing
- —
- Monthly P&I
- —
- Monthly cashflow
- —
- DSCR
- —
- Eligible?
- —
Personal DTI + credit; lowest rate.
DSCR
20% down · 8.5% · 30yr
- Down + closing
- —
- Monthly P&I
- —
- Monthly cashflow
- —
- DSCR
- —
- Eligible?
- —
No personal income docs; deal must DSCR.
Hard money
10% down · 12.0% · 12mo
- Down + closing
- —
- Monthly P&I
- —
- Monthly cashflow
- —
- DSCR
- —
- Eligible?
- —
Short-term bridge; refi at stabilization.
Rent comps 40 comps
| Address | Beds | Baths | Sqft | Rent | $/sqft | DOM | Units | Dist |
|---|---|---|---|---|---|---|---|---|
| 17170-17220 SW Heritage Pkwy Beaverton, OR | 2.0 | 1.0 | 850 | $1,424 | $1.68 | 0d | 3 | 0.18mi |
| 18380 NW Heritage Pkwy Beaverton, OR | 1.0–2.0 | 1.0 | 798 | $2,124 | $2.66 | 0d | 6 | 0.25mi |
| 875 SW 185th Ave Unit 07 Beaverton, OR | 3.0 | 1.0 | 872 | $1,858 | $2.13 | 17d | 1 | 0.33mi |
| 10667 NE Heritage Pkwy Hillsboro, OR | 1.0–3.0 | 1.0–2.0 | 914 | $1,925 | $2.11 | 0d | 15 | 0.33mi |
| 903 SW 185th Ave Hillsboro, OR | 2.0 | 2.0 | 985 | $1,622 | $1.65 | 10d | 6 | 0.35mi |
| 10834 NE Holly St Hillsboro, OR | 2.0 | 2.0 | 966 | $1,995 | $2.07 | 15d | 1 | 0.45mi |
| 10664 NE Holly St Hillsboro, OR | 2.0 | 2.0 | 960 | $2,000 | $2.08 | 26d | 1 | 0.45mi |
| 10795 NE Gateway Pl Beaverton, OR | 2.0 | 2.5 | 1104 | $2,099 | $1.90 | 26d | 1 | 0.46mi |
| 730 NW 185th Ave Unit 730 Beaverton, OR | 2.0 | 1.0 | 864 | $1,550 | $1.79 | 26d | 1 | 0.49mi |
| 760 NW 185th Ave #207 Beaverton, OR | 2.0 | 2.0 | 1007 | $1,850 | $1.84 | 26d | 1 | 0.56mi |
| 760 NW 185th Ave #207 Beaverton, OR | 2.0 | 2.0 | 1007 | $1,850 | $1.84 | 46d | 1 | 0.56mi |
| 18300 NW Walker Rd Beaverton, OR | 2.0 | 2.0 | 958 | $2,109 | $2.20 | 0d | 3 | 0.56mi |
| 770 NW 185th Ave #305 Beaverton, OR | 2.0 | 1.0 | 864 | $1,650 | $1.91 | 46d | 1 | 0.58mi |
| 1145 SW 170th Ave Beaverton, OR | 3.0 | 1.0–2.0 | 835 | $2,815 | $3.37 | 0d | 223 | 0.64mi |
| 17030 SW Baseline Rd Beaverton, OR | 2.0 | 1.0 | 680 | $1,671 | $2.46 | 15d | 1 | 0.65mi |
| 1345 SW 172nd Ter Beaverton, OR | 1.0–3.0 | 1.0–2.0 | 970 | $2,066 | $2.13 | 0d | 22 | 0.66mi |
| 1563 SW 172nd Ter Beaverton, OR | 3.0 | 1.0–1.5 | 730 | $1,970 | $2.70 | 4d | 26 | 0.75mi |
| 1120 SW 170th Ave #101 Beaverton, OR | 1.0 | 1.0 | 722 | $1,495 | $2.07 | 0d | 1 | 0.75mi |
| 1235 NW 183rd Ave Unit 11 Beaverton, OR | 1.0 | 1.0 | 626 | $1,345 | $2.15 | 15d | 1 | 0.80mi |
| 1285 NW 183rd Ave Beaverton, OR | 2.0 | 2.0 | 888 | $1,670 | $1.88 | 4d | 1 | 0.83mi |
| 1285 NW 183rd Ave Unit 39 Beaverton, OR | 2.0 | 2.0 | 893 | $1,695 | $1.90 | 20d | 1 | 0.83mi |
| 1255 NW 183rd Ave Unit 23 Beaverton, OR | 2.0 | 2.0 | 883 | $1,645 | $1.86 | 22d | 1 | 0.83mi |
| 1255 NW 183rd Ave Unit 22 Beaverton, OR | 1.0 | 1.0 | 626 | $1,395 | $2.23 | 26d | 1 | 0.83mi |
| 17205 SW Merlo Rd Unit 3 Beaverton, OR | 2.0 | 1.5 | 800 | $1,595 | $1.99 | 46d | 1 | 0.89mi |
| 17324 SW Merlo Rd Unit 3 Beaverton, OR | 2.0 | 1.0 | 805 | $1,795 | $2.23 | 20d | 1 | 0.91mi |
| 17300 SW Merlo Rd Apt 3 Beaverton, OR | 2.0 | 1.0 | 1000 | $1,450 | $1.45 | 5d | 1 | 0.91mi |
| 16250 SW Jenkins Rd Beaverton, OR | 1.0–3.0 | 1.0–2.0 | 1007 | $1,545 | $1.53 | 46d | 1 | 0.92mi |
| 1305 NE 105th Way Hillsboro, OR | 1.0–3.0 | 1.0–2.0 | 997 | $2,002 | $2.01 | 0d | 14 | 0.95mi |
| 545 SW 201st Ave Beaverton, OR | 1.0–3.0 | 1.0–2.0 | 898 | $1,948 | $2.17 | 4d | 19 | 0.95mi |
| 915 SW 163rd Ave Beaverton, OR | 1.0–2.0 | 1.0–2.0 | 786 | $1,810 | $2.30 | 46d | 12 | 0.96mi |
| 650 201st Ave Aloha, OR | 2.0 | 2.0 | 985 | $1,688 | $1.71 | 1d | 4 | 0.96mi |
| 16201 NW Schendel Ave Beaverton, OR | 1.0–2.0 | 1.0–2.0 | 837 | $1,850 | $2.21 | 0d | 15 | 1.00mi |
| 915 SW 163rd Ave Unit 823 Beaverton, OR | 2.0 | 1.0 | 824 | $1,645 | $2.00 | 6d | 1 | 1.01mi |
| 915 SW 163rd Ave Unit 527 Beaverton, OR | 2.0 | 2.0 | 913 | $1,625 | $1.78 | 10d | 1 | 1.01mi |
| 915 SW 163rd Ave Unit 718 Beaverton, OR | 2.0 | 2.0 | 913 | $1,675 | $1.83 | 10d | 1 | 1.01mi |
| 915 SW 163rd Ave Unit 516 Beaverton, OR | 1.0 | 1.0 | 660 | $1,325 | $2.01 | 10d | 1 | 1.01mi |
| 915 SW 163rd Ave Unit 716 Beaverton, OR | 1.0 | 1.0 | 660 | $1,375 | $2.08 | 10d | 1 | 1.01mi |
| 915 SW 163rd Ave Unit 132 Beaverton, OR | 2.0 | 2.0 | 913 | $1,635 | $1.79 | 26d | 1 | 1.01mi |
| 915 SW 163rd Ave Unit 2314 Beaverton, OR | 2.0 | 2.0 | 913 | $1,725 | $1.89 | 4d | 1 | 1.01mi |
| 18640 SW Bryant St Beaverton, OR | 2.0–3.0 | 1.0–2.5 | 1250 | $1,995 | $1.60 | 26d | 1 | 1.10mi |
Listing history 16 events
-
2026-06-22days on market $145,000 Active 129 DOM
-
2026-06-21days on market $145,000 Active 128 DOM
-
2026-06-18days on market $145,000 Active 125 DOM
-
2026-06-17days on market $145,000 Active 124 DOM
-
2026-06-16days on market $145,000 Active 123 DOM
-
2026-06-15days on market $145,000 Active 122 DOM
-
2026-06-13days on market $145,000 Active 120 DOM
-
2026-06-09days on market $145,000 Active 116 DOM
-
2026-06-08days on market $145,000 Active 115 DOM
-
2026-06-07days on market $145,000 Active 114 DOM
-
2026-06-05days on market $145,000 Active 111 DOM
-
2026-06-03days on market $145,000 Active 110 DOM
-
2026-06-02days on market $145,000 Active 109 DOM
-
2026-06-01days on market $145,000 Active 108 DOM
-
2026-05-31days on market $145,000 Active 107 DOM
-
2024-08-08$145,000 Active 493-char remark
Show marketing remark (493 chars)
MOTIVATED SELLER!! Like new manufactured home located at Heritage Village Mobile home park. Built in 2019, this home offers 1,008sqft, 2 bedrooms, 2 bathrooms, open concept kitchen/living area, breakfast bar, laundry area, spacious guest bedroom, full bath, large primary with walk in closet and full bath, front deck, heat pump and more. Home is conveniently located close to schools, shopping, and food. Space rent is $1,255/month. Includes fitness room, kids park, pool and community room.
ⓘ Source: listings_history table (triggers on properties + properties_extension) + one-shot
backfill from property_details.listing_events for pre-trigger history.
Climate risk First Street
- Flood 1/10 Low FEMA zone X (unshaded) · 0% chance over 30 yrs
- Wildfire 1/10 Low
- Heat 3/10 Moderate 7 d/yr ≥92°F today · 14 d/yr by 30 yrs out
- Wind 1/10 Low
- Air quality 8/10 Severe 11 unhealthy d/yr today · 11 by 30 yrs out
Nearby sold comps map
Loading sold comps map…
Walkable amenities ~0.75 mi
Loading nearby amenities…
Taxation est. · year 1
- Rental income
- $16,576
- − Mortgage interest
- −$8,122
- − Property taxes
- −$2,175
- − Insurance
- −$725
- − Repairs & maintenance
- −$1,326
- − Management
- −$1,326
- − Depreciation
- −$4,218
- Taxable loss
- −$1,317
- Est. tax savings @ 24.0%
- +$316
- After-tax cash flow
- $1,386/yr
For passive investors: Depreciation is non-cash, so a rental often shows a tax loss while cash-flowing — sheltering income. Rental losses are passive: they offset passive income freely, and up to $25,000/yr can offset ordinary (W-2) income if you actively participate and your MAGI is under $100k (phasing out to $0 by $150k); unused losses carry forward. On sale, claimed depreciation is recaptured at up to 25%, and gains may owe capital-gains tax (a 1031 exchange can defer both). Figures are a year-1 estimate at your 24.0% rate — not tax advice; consult a CPA.
Schools (NCES district)
- District
- Beaverton SD 48J
- NCES district ID
- 4101920
- Math proficiency
- 68% ▲ 14.00%
- Reading proficiency
- 76% ▲ 11.00%
- Median HH income
- $67,966
- Composite
- 62.72/100
- National rank
- #672
- State rank
- #3 of 58 in OR
Livability — Beaverton
- Score
- 88/100
- State rank
- #10
- US rank
- #251
Category grades
Schools grade is shown separately in the Schools card above.
Census & demographics
- County
- Washington County · 583,254 people
- City population
- 204,753
- Metro
- Portland-Vancouver-Hillsboro, OR-WA
- Population (ZIP)
- 46,463
- Household income
- $104,790
- Rent vs Own
- Severe rent burden
- 2200.0
Population outlook (Washington County) Hauer SSP2
- Today (2025)
- 674,042 people
- By 2030
- 721,804 · +7.1%
- By 2040
- 812,732 · +20.6%
- By 2050
- 895,143 · +32.8%
- By 2075
- 1,058,806 · +57.1%
- By 2100
- 1,131,692 · +67.9%
Race, ethnicity, and origin ACS 2023
- Neighborhood character
- Diverse neighborhood (Simpson 0.66)
- Race & ethnicity
- White 52% Asian 21% Hispanic / Latino 16% Two or more races 12% Black 3%
- Hispanic origin (detail)
- Mexican 12%
- Common ancestry
- Italian 4% Portuguese 3% Lithuanian 3%
- Foreign-born
- 22% · Canada, China, Vietnam
- Languages at home
- 71% English-only · Spanish 8% Other Asian/Pacific 6% Other Indo-European 5%
Political lean MEDSL · Washington
- 2024 margin
- Solid D (+34.0) · D 65.3% · R 31.3% · Other 3.4%
- 2008→2024 swing
- +11.8pp toward D · 2008: 22.1pp · 2024: 34.0pp
- All cycles
- 2024: D+34.0 2020: D+34.6 2016: D+26.7 2012: D+17.5 2008: D+22.1
Not yet ingested
- Civics
- —
Market trends
- HPI YoY
- ▼ -344.27%
- Current HPI
- 304.041
- Rent YoY
- ▼ -1.58%
- Metro
- Portland-Vancouver-Hillsboro, OR-WA
- State GDP YoY
- ▲ 2.05%
- F500 in state
- 2
Industry mix (Fortune 500 HQ in OR)
| Industry | F500 HQs | Revenue |
|---|---|---|
| Consumer Goods | 1 | $51B |
|
||
Price history
1 event — show timeline
- 2024-08-08 Listed $145,000 RMLS
Property tax history
+6.2%/yrLatest (2019): $248 · +3.3% YoY. Source: county tax records.
Cash-flow waterfall
monthlySold comps — $/sqft
last 12 mo · ≤1 miLoading sold comps…