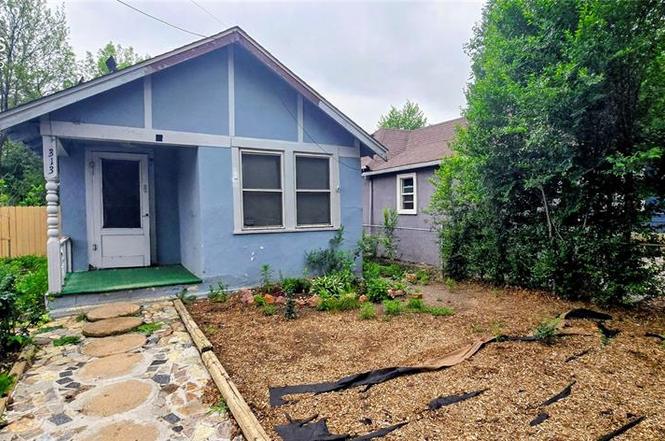
313 W Monument St · Colorado Springs, CO
Flood risk 3/10 · Minor
- FEMA flood zone
- X (unshaded)
- Chance of flooding over 30 yrs
- 0.2%
- Est. flood insurance / yr
- $507 – $1,088
Fire risk 6/10 · Moderate
- Est. fire insurance / yr
- $939 – $1,743
Heat risk 2/10 · Minimal
- Hot days now (above 90°F)
- 5 days/yr
- Hot days in 30 yrs
- 13 days/yr
Wind risk 2/10 · Minimal
- Chance of severe wind over 30 yrs
- —
Air-quality risk 1/10 · Minimal
- Unhealthy air days now
- 0 days/yr
- Unhealthy air days in 30 yrs
- 0 days/yr
Risk factors via First Street. Map © Google.
Why this score? — see what drove the B- grade
The composite is a weighted blend of 9 inputs, each scored 0–100. Each bar is that input's sub-score; the figure is the points it added to the 100-point composite (weight × sub-score).
- Cash flow +29.5/30.0
- DSCR +10.0/10.0
- 1% rule +7.8/10.0
- ARV discount +7.5/15.0
- Livability +3.9/5.0
- Rent growth +3.1/5.0
- Schools +2.5/10.0
- Condition / age +2.5/5.0
- Appreciation +0.0/10.0
$99,000
🖨 Deal sheet 📄 Offer letter ✓ Due diligence
Listing remarks
This one-bedroom, one-bathroom home on the west side of I-25 in Colorado Springs is being sold on behalf of a trustee. This house is well-suited for an investor or a flipper. THE HOUSE NEEDS SIGNIFICANT REPAIR TO BE INHABITABLE. We will provide a copy of a home inspection report for informational purposes. The buyer is expected to perform their own due diligence prior to bidding. This single-floor ranch home is 654 ft. ², sitting on a fenced 4780 square-foot lot. There are two small outbuildings in the backyard, both in need of maintenance and repair. The home is located near downtown, shopping, entertainment, and services. District 11 (D-11) schools are nearby -- Bristol Elementary K-
Key facts
- One bedroom home
- One bathroom home
- Historic westside
Tags
Property features AI
Finance
- Financial info: Cash purchase terms
- HOA & community: No HOA
Exterior
- Parking: Detached 1-car garage
- Utilities: Municipal water; Electricity available
- Home design: Single family residence; Existing home
- Construction: Crawl space foundation; Existing home construction
- Exterior features: Wood frame structure; Stucco and wood siding; Composite shingle roof; Fully fenced yard; Storage shed; Located on a cul-de-sac; Gravel alley access; Near hiking trails, park, public transit, and schools
Interior
- Bedrooms: Main floor bedroom
- Bathrooms: 1 full bathroom
- Heating & cooling: Forced air heating; No cooling
- Interior features: Forced air heating; No cooling
Neighborhood map
What this means for you Summary
Snapshot
- This is a 1-bed/1.0-bath single-family listed at $99k.
Deal economics
- At list price, monthly cash flow is $354 ($4k/yr) — positive.
- The deal already cash-flows at list — no discount required.
- Meets the 1% rule at list price ($1k rent vs $99k).
- Cap rate 10.6% vs local median 3.3% in Colorado Springs — top-decile yield for the area; either an underpriced asset or a hidden risk that comps aren't pricing in. Stress-test before assuming the spread holds.
Location & tenants
- Location reads 78/100 on livability (#23 in CO, #2,639 nationally) — a middle-class / working-renter tenant base. Strengths: amenities A+, housing A+, health & safety A+; Watch: cost of living C-, crime F.
- Colorado Springs School District No. 11 In The County Of E (urban): math 20% / reading 37% proficiency, ranked #56 of 86 in CO (top 65%) — low school quality limits family demand, transient renter base, plan for 1-2y turnover.
- Market conditions: Rents rising (+2.3%/yr); 148 active listings in the ZIP; 40 comparable units currently listed for rent nearby; rentals at typical pace (median 24d on market — plan ~3-4 weeks tenant-placement turnaround); 3,906 units permitted in El Paso County in 2024 (872 in 5+ unit buildings).
Forward outlook
- Local home prices are declining (-3.0%/yr); year-one equity from $684 of loan paydown is wiped out by about $3k of value loss. Plan a longer hold.
- El Paso County population projected at +28% by 2050 — long-run rental-demand tailwind backs the buy-and-hold thesis.
- At projected returns (-3.0% appreciation + 2.3% rent growth), your $28k cash investment doubles in ~9 years — after that, you're playing with house money.
Negotiation context
- Only 3 days on market — expect competitive offers; lowballing is unlikely to land.
Risks & watch-outs
- Watch-outs: built in 1895 — expect roof / HVAC / electrical / plumbing capex.
- Climate carrying-cost: major wildfire risk — expect insurance premiums to compound above CPI over the hold.
Questions for the listing agent
- Built in 1895 — when were the roof, HVAC, electrical panel, plumbing, and water heater last replaced?
- Is there a deadline driving the sale (1031 exchange, divorce, estate, relocation)? That informs how much negotiation room exists.
- Schools are B-rated — typically a magnet for longer-tenancy family renters. What's the average tenant stay here, and is there a school-zone premium baked into asking?
- Crime grade is F in this area — have there been break-ins, vandalism, or insurance claims at this property in the last 3 years? What carrier currently insures it and at what premium?
- What's the average days-on-market for RENTAL listings here right now (not sales)? A rising rental-DOM trend means longer vacancies and softer asking-rent achievability than the comps imply.
- What's the recent tenant-quality profile in this submarket — average credit score on applications, eviction rate, late-payment / NSF rate, and stable-employment percentage? A property-management company in the area should have these aggregated.
- How much new for-sale + rental construction is in the pipeline within 1–3 miles? Heavy new supply typically softens prices + rents 12–24 months out; constrained supply supports both.
Investment metrics
- 1% rule
- 1.28% ✓
- Cap rate
- 10.59%
- Cash-on-cash
- 15.33%
- DSCR
- 1.68
- GRM
- 6.5
CMA / ARV
- ARV (on-the-fly)
- $261,600
- Comps found
- 3
Show comp detail 3 sales within ~0.75 mi
| Address | Dist | Beds/Ba | Sqft | Sold | Price | $/sf | Match |
|---|---|---|---|---|---|---|---|
| 509 W Boulder St | 0.35mi | 2/1.0 (+1) | 619 (-5%) | 8mo | $161,500 | $261 | 63 |
| 509 N Spruce St | 0.15mi | 2/1.0 (+1) | 748 (+14%) | 10mo | $299,000 | $400 | 55 |
| 115 N Chestnut St | 0.54mi | 2/1.0 (+1) | 730 (+12%) | 2mo | $350,000 | $479 | 49 |
Match score weights: distance 35% · size 25% · config 20% · recency 20%. Top-matched comps best support the ARV.
Projected returns pro-forma
-3.0% appreciation · 2.3% rent growth · sell at horizon
- IRR
- 5.3%
- Equity multiple
- 1.20×
- Total profit
- $5,630
- Equity at exit
- $14,761
- IRR
- 14.1%
- Equity multiple
- 2.10×
- Total profit
- $30,354
- Equity at exit
- $8,560
Cash invested: $27,720 (down + closing). Projections, not guarantees.
Landlord ↔ Tenant lean methodology
- Overall (STATE)
- 38 Tenant-Leaning
- State Colorado
- 38 Tenant-Leaning · D+4
- County
- — inherits STATE
- City
- — inherits STATE
ZIP-level market 80905
- Home prices YoY
- -31.1%
- Rents YoY
- 2.3%
- Active inventory
- 148
- Price-to-rent
- 6.5×
Monthly cashflow live
- Estimated rent
- $1,264 high interval (Pro) →
- Mortgage (P&I)
- −$519
- Tax from tax record
- −$84 /mo · $1,010/yr
- Insurance
- −$41
- HOA
- −$0
- Vacancy / Maint / Mgmt
- −$266
- Net cashflow
- $354
Break-even live
UW: 25.0% down · 7.5% · 30yr · 1.5% tax · 5.0% vac · 8.0% maint · 8.0% mgmt
Financing live
Cash to close
- Down payment
- $24,750
- Closing costs
- $2,970
- Reserves months
- —
- Total cash needed
- —
Loan-product check · same deal, 3 products live
Conventional
25% down · 7.5% · 30yr
- Down + closing
- —
- Monthly P&I
- —
- Monthly cashflow
- —
- DSCR
- —
- Eligible?
- —
Personal DTI + credit; lowest rate.
DSCR
20% down · 8.5% · 30yr
- Down + closing
- —
- Monthly P&I
- —
- Monthly cashflow
- —
- DSCR
- —
- Eligible?
- —
No personal income docs; deal must DSCR.
Hard money
10% down · 12.0% · 12mo
- Down + closing
- —
- Monthly P&I
- —
- Monthly cashflow
- —
- DSCR
- —
- Eligible?
- —
Short-term bridge; refi at stabilization.
Rent comps 40 comps
| Address | Beds | Baths | Sqft | Rent | $/sqft | DOM | Units | Dist |
|---|---|---|---|---|---|---|---|---|
| 411 1/2 N Spruce St Colorado Springs, CO | 1.0 | 1.0 | 741 | $1,050 | $1.42 | 21d | 1 | 0.20mi |
| 323 N Spruce St Colorado Springs, CO | 1.0 | 1.0 | 600 | $1,500 | $2.50 | 23d | 1 | 0.26mi |
| 624 N Cascade Ave Colorado Springs, CO | 2.0 | 1.0 | 709 | $1,635 | $2.31 | 3d | 11 | 0.30mi |
| 611 N Cascade Ave Unit 611-8 Colorado Springs, CO | 1.0 | 1.0 | 360 | $925 | $2.57 | 3d | 1 | 0.36mi |
| 30 Boulder Crescent St Colorado Springs, CO | 1.0 | 1.0 | 570 | $1,390 | $2.44 | 23d | 1 | 0.38mi |
| 515 N Tejon St Unit 2 1UNIT 2 Colorado Springs, CO | 1.0 | 1.0 | 670 | $1,145 | $1.71 | 14d | 1 | 0.46mi |
| 515 N Tejon St Colorado Springs, CO | 1.0 | 1.0 | 650 | $1,350 | $2.08 | 23d | 1 | 0.46mi |
| 724 N Nevada Ave Colorado Springs, CO | 1.0 | 1.0 | 650 | $1,245 | $1.92 | 23d | 1 | 0.52mi |
| 724 N Nevada Ave Colorado Springs, CO | — | 1.0 | 375 | $995 | $2.65 | 3d | 1 | 0.52mi |
| 715 N Nevada Ave Unit 9 Colorado Springs, CO | 1.0 | 1.0 | 370 | $875 | $2.36 | 3d | 1 | 0.57mi |
| 380 N Limit St Colorado Springs, CO | 1.0–2.0 | 1.0–2.0 | 710 | $990 | $1.39 | 2d | 1 | 0.57mi |
| 815 N Nevada Ave Unit 103 Colorado Springs, CO | 1.0 | 2.5 | 350 | $750 | $2.14 | 23d | 1 | 0.59mi |
| 815 N Nevada Ave Unit 101 Colorado Springs, CO | — | 1.0 | 350 | $750 | $2.14 | 23d | 1 | 0.59mi |
| 618 N Weber St Colorado Springs, CO | 1.0 | 1.0 | 398 | $745 | $1.87 | 23d | 1 | 0.60mi |
| 1238 Wood Ave Unit 4 Colorado Springs, CO | 1.0 | 1.0 | 750 | $1,495 | $1.99 | 21d | 1 | 0.69mi |
| 532 W Colorado Ave Colorado Springs, CO | 1.0 | 1.0 | 556 | $1,521 | $2.73 | 3d | 2 | 0.72mi |
| 322 Platte Ct Apt 2 Colorado Springs, CO | — | 1.0 | 412 | $895 | $2.17 | 23d | 1 | 0.73mi |
| 1001 N Weber St Colorado Springs, CO | 1.0 | 1.0 | 588 | $995 | $1.69 | 23d | 1 | 0.75mi |
| 816 W Colorado Ave Colorado Springs, CO | 1.0 | 1.0 | 690 | $975 | $1.41 | 23d | 1 | 0.76mi |
| 423 N Wahsatch Ave Colorado Springs, CO | — | 1.0 | 750 | $979 | $1.31 | 3d | 1 | 0.76mi |
| 1111 W Pikes Peak Ave Unit 1 Colorado Springs, CO | 1.0 | 1.0 | 528 | $1,595 | $3.02 | 23d | 1 | 0.77mi |
| 1111 W Pikes Peak Ave Unit 3 Colorado Springs, CO | 1.0 | 1.0 | 708 | $1,795 | $2.54 | 23d | 1 | 0.77mi |
| 324 E Bijou St Colorado Springs, CO | 2.0 | 1.0 | 700 | $1,225 | $1.75 | 23d | 1 | 0.80mi |
| 1510 Gatehouse Cir S Colorado Springs, CO | 1.0–2.0 | 1.0–2.0 | 901 | $1,347 | $1.50 | 3d | 27 | 0.80mi |
| 410 E Yampa St Unit 414YAM-06 Colorado Springs, CO | 1.0 | 1.0 | 500 | $800 | $1.60 | 3d | 1 | 0.84mi |
| 1303 N Nevada Ave Colorado Springs, CO | 1.0–2.0 | 1.0 | 685 | $1,020 | $1.49 | 14d | 4 | 0.86mi |
| 1324 N Nevada Ave Colorado Springs, CO | 1.0 | 1.0 | 400 | $800 | $2.00 | 23d | 1 | 0.86mi |
| 1431 W Kiowa St Unit 2 Colorado Springs, CO | 1.0 | 1.0 | 550 | $925 | $1.68 | 14d | 1 | 0.87mi |
| 404 E Kiowa St Colorado Springs, CO | 2.0 | 1.0 | 704 | $1,600 | $2.27 | 23d | 1 | 0.90mi |
| 1516 N Cascade Ave Colorado Springs, CO | 1.0 | 1.0 | 570 | $1,250 | $2.19 | 23d | 1 | 0.93mi |
| 629 Maple St Colorado Springs, CO | 2.0 | 1.0 | 550 | $2,000 | $3.64 | 14d | 1 | 0.94mi |
| 400 E Pikes Peak Ave Colorado Springs, CO | 2.0 | 1.0–2.0 | 889 | $2,501 | $2.81 | 3d | 32 | 0.98mi |
| 1632 W Kiowa St Unit 5 Colorado Springs, CO | — | 1.0 | 600 | $1,125 | $1.88 | 23d | 1 | 0.98mi |
| 333 E Colorado Ave Colorado Springs, CO | 2.0 | 1.0–2.0 | 867 | $2,172 | $2.50 | 3d | 24 | 1.02mi |
| 15 N Corona St Unit 1462273P Colorado Springs, CO | 1.0 | 1.0 | 645 | $1,950 | $3.02 | 23d | 1 | 1.04mi |
| 1713 W Kiowa St Colorado Springs, CO | 1.0 | 1.0 | 750 | $1,250 | $1.67 | 23d | 1 | 1.04mi |
| 217 S Weber St Colorado Springs, CO | 1.0–2.0 | 1.0–2.0 | 969 | $2,205 | $2.28 | 21d | 10 | 1.07mi |
| 217 S Weber St Colorado Springs, CO | 2.0 | 1.0–2.0 | 902 | $2,591 | $2.87 | 3d | 71 | 1.07mi |
| 322 E Vermijo Ave Colorado Springs, CO | 2.0 | 1.0–2.0 | 728 | $1,954 | $2.68 | 3d | 39 | 1.09mi |
| 214 S Wahsatch Ave Unit 5 Colorado Springs, CO | — | 1.0 | 352 | $875 | $2.49 | 23d | 1 | 1.10mi |
Listing history 4 events
-
2026-06-18days on market $99,000 Active 3 DOM
-
2026-06-17days on market $99,000 Active 2 DOM
-
2026-06-15remarks 694-char remark
-
2026-06-15$99,000 Active 1 DOM
ⓘ Source: listings_history table (triggers on properties + properties_extension) + one-shot
backfill from property_details.listing_events for pre-trigger history.
Tax reassessment forecast CO · Resets to sale price
- Current annual tax
- $1,010 · $84/mo
- Projected year-2 tax
- $1,011 · $84/mo
- Expected delta
- $0/yr ($0/mo · 0.0%)
ⓘ Screening estimate from a state-policy table — verify with the county assessor before closing.
Climate risk First Street
- Flood 3/10 Moderate FEMA zone X (unshaded) · 20% chance over 30 yrs
- Wildfire 6/10 Major
- Heat 2/10 Low 5 d/yr ≥90°F today · 13 d/yr by 30 yrs out
- Wind 2/10 Low
- Air quality 1/10 Low 0 unhealthy d/yr today · 0 by 30 yrs out
Nearby sold comps map
Loading sold comps map…
Walkable amenities ~0.75 mi
Loading nearby amenities…
Taxation est. · year 1
- Rental income
- $15,173
- − Mortgage interest
- −$5,546
- − Property taxes
- −$1,010
- − Insurance
- −$495
- − Repairs & maintenance
- −$1,214
- − Management
- −$1,214
- − Depreciation
- −$2,880
- Taxable income
- $2,814
- Est. tax owed @ 24.0%
- −$675
- After-tax cash flow
- $3,575/yr
For passive investors: Depreciation is non-cash, so a rental often shows a tax loss while cash-flowing — sheltering income. Rental losses are passive: they offset passive income freely, and up to $25,000/yr can offset ordinary (W-2) income if you actively participate and your MAGI is under $100k (phasing out to $0 by $150k); unused losses carry forward. On sale, claimed depreciation is recaptured at up to 25%, and gains may owe capital-gains tax (a 1031 exchange can defer both). Figures are a year-1 estimate at your 24.0% rate — not tax advice; consult a CPA.
Schools (NCES district)
- District
- Colorado Springs School District No. 11 In The County Of E
- NCES district ID
- 0803060
- Math proficiency
- 20% ▼ -8.00%
- Reading proficiency
- 37% ▼ -4.00%
- Median HH income
- $47,884
- Composite
- 24.69/100
- National rank
- #7613
- State rank
- #56 of 86 in CO
Livability — Colorado Springs
- Score
- 78/100
- State rank
- #23
- US rank
- #2639
Category grades
Schools grade is shown separately in the Schools card above.
Census & demographics
- Census place
- Colorado Springs, CO
- County
- El Paso County · 689,348 people
- City population
- 555,783
- Metro
- Colorado Springs, CO
- Population (ZIP)
- 16,672
- Household income
- $63,281
- Rent vs Own
- Severe rent burden
- 1210.0
Population outlook (El Paso County) Hauer SSP2
- Today (2025)
- 768,926 people
- By 2030
- 815,739 · +6.1%
- By 2040
- 903,489 · +17.5%
- By 2050
- 981,204 · +27.6%
- By 2075
- 1,155,542 · +50.3%
- By 2100
- 1,202,070 · +56.3%
Race, ethnicity, and origin ACS 2023
- Neighborhood character
- Majority White (65%)
- Race & ethnicity
- White 65% Hispanic / Latino 24% Two or more races 13% Black 5% Asian 1%
- Hispanic origin (detail)
- Mexican 11%
- Common ancestry
- Romanian 5% Lithuanian 4% Slovak 3%
- Foreign-born
- 7% · Canada, South Korea
- Languages at home
- 85% English-only · Spanish 11% German/W. Germanic 1% Russian/Polish/Slavic 1%
Political lean MEDSL · El Paso
- 2024 margin
- Lean R (+9.8) · D 43.8% · R 53.5% · Other 2.7%
- 2008→2024 swing
- +9.0pp toward D · 2008: -18.8pp · 2024: -9.8pp
- All cycles
- 2024: R+9.8 2020: R+10.8 2016: R+22.6 2012: R+21.4 2008: R+18.8
Not yet ingested
- Civics
- —
Market trends
- HPI YoY
- ▼ -132.83%
- Current HPI
- 294.7521
- Rent YoY
- ▲ 2.30%
- Metro
- Colorado Springs, CO
- State GDP YoY
- ▲ 1.95%
- F500 in state
- 14
Industry mix (Fortune 500 HQ in CO)
| Industry | F500 HQs | Revenue |
|---|---|---|
| Technology Distribution | 1 | $31B |
|
||
| Food / Agriculture | 1 | $18B |
|
||
| Packaging | 1 | $14B |
|
||
| Healthcare | 1 | $13B |
|
||
| Energy | 1 | $10B |
|
||
| Technology | 1 | $4B |
|
||
Price history
1 event — show timeline
- 2026-06-15 Listed $99,000 elevateMLS
Property tax history
+6.0%/yrLatest (2025): $1,010 · +13.5% YoY. Source: county tax records.
Cash-flow waterfall
monthlySold comps — $/sqft
last 12 mo · ≤1 miLoading sold comps…