101 N Brook St · Gans, OK
Flood risk 1/10 · Minimal
- FEMA flood zone
- X (unshaded)
- Chance of flooding over 30 yrs
- 0.0%
- Est. flood insurance / yr
- $507 – $1,088
Fire risk 7/10 · Major
- Est. fire insurance / yr
- $2,463 – $4,575
Heat risk 6/10 · Moderate
- Hot days now (above 110°F)
- 7 days/yr
- Hot days in 30 yrs
- 20 days/yr
Wind risk 3/10 · Minor
- Chance of severe wind over 30 yrs
- 5.0%
Air-quality risk 2/10 · Minimal
- Unhealthy air days now
- 0 days/yr
- Unhealthy air days in 30 yrs
- 1 days/yr
Risk factors via First Street. Map © Google.
Why this score? — see what drove the D+ grade
The composite is a weighted blend of 9 inputs, each scored 0–100. Each bar is that input's sub-score; the figure is the points it added to the 100-point composite (weight × sub-score).
- ARV discount +13.1/15.0
- Cash flow +10.0/30.0
- Appreciation +10.0/10.0
- Livability +3.3/5.0
- DSCR +2.9/10.0
- Rent growth +2.5/5.0
- Condition / age +2.5/5.0
- Schools +2.2/10.0
- 1% rule +1.8/10.0
$164,900
🖨 Deal sheet (PDF) 📄 Offer letter ✓ Due diligence
Listing remarks
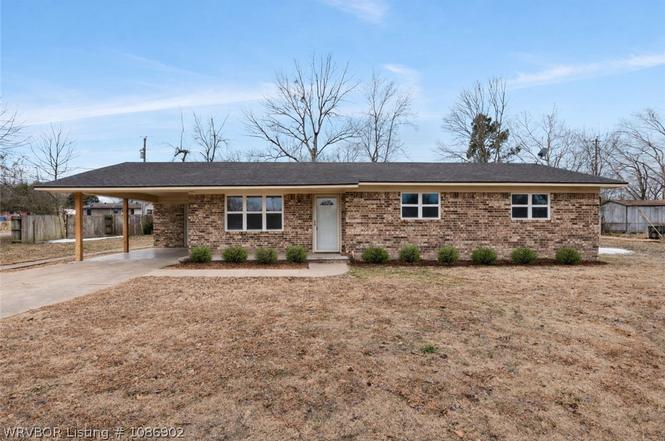
Welcome home to this beautifully remodeled 3-bedroom, 2-bath brick home offering 1,256 sq ft of comfortable living. Fresh updates throughout include new paint, flooring, cabinets, and new windows, giving the home a bright, modern feel. Situated on a spacious corner lot, this property also features a nice storm shelter for added peace of mind. Move-in ready and full of charm—don’t miss this one!
Key facts
- Spacious corner lot
- Storm shelter
- Remodeled brick home
Tags
Property features AI
Exterior
- Parking: Attached carport; Carport (1 covered space); Gravel parking
- Utilities: Public water; Sewer available; Electricity available; Natural gas available; Water available
- Home design: Single family residence; One story; House
- Construction: Brick construction; Shingle roof; Slab foundation; Built as a single-story house
- Exterior features: Covered patio/porch; No fencing; Cleared lot; Corner lot; Level lot; Public maintained road access
Interior
- Kitchen: Dishwasher; Range
- Flooring: Ceramic tile; Vinyl
- Bathrooms: 2 full bathrooms
- Heating & cooling: Central heating; Central air conditioning; Ceiling fans
- Interior features: Ceiling fans; Other interior features
- Laundry & utility: Washer hookup; Electric dryer hookup; Electric water heater
Neighborhood map
What this means for you Summary
Snapshot
- This is a 3-bed/2.0-bath single-family listed at $165k.
Deal economics
- At list price, monthly cash flow is $-98 ($-1k/yr) — negative.
- To cash-flow at today's rent, offer at most $148k (10.5% below list).
- To meet the 1% rule (rent ≥ 1% of price), the offer needs to be $111k (32.4% below list).
- Recommended offer: $111k (32.4% below list) — sets the bar for 1% rule.
Location & tenants
- Location reads 66/100 on livability (#105 in OK) — a middle-class / working-renter tenant base. Strengths: crime A+, cost of living A+, housing A+; Watch: amenities F, commute F, employment F.
- Gans (rural): math 20% / reading 25% proficiency, ranked #379 of 513 in OK (top 74%) — low school quality limits family demand, transient renter base, plan for 1-2y turnover; 69% free/reduced lunch — lower-income household profile, screen leases tightly.
- Zoned schools: Gans Es (math 17% / reading 22%, grade F, #479 of 845 statewide, top 63%, 239 students, 0% FRL); Gans Hs (math 10% / reading 10%, grade F, #361 of 447 statewide, top 94%, 107 students, 0% FRL) — zoned schools average 0% FRL vs 69% district-wide (69 pts lower); this property's tenant base skews higher-income than the district average.
- Market conditions: 11 active listings in the ZIP; 125 units permitted in Sequoyah County in 2024 (0 in 5+ unit buildings).
Forward outlook
- In year one you build about $18k of equity ($1k loan paydown + $16k appreciation (10.0% local appreciation)).
- Sequoyah County population projected at -16% by 2050 — secular population decline; favor cash flow + early exit over multi-decade hold.
- By year 3, paydown + projected appreciation supports a ~$45k cash-out refi (75% LTV) — recoverable capital for the next deal without selling this one.
Negotiation context
- It's been on market 135 days — a 12% lower offer ($145k) is reasonable based on typical stale-listing flexibility.
- Current owner paid $68k; list at $165k implies a 141% gain — meaningful room to come down on a strong offer.
Risks & watch-outs
- Climate carrying-cost: major wildfire risk; extreme-heat days projected 7→20/yr by 2055 (HVAC capex compounding) — expect insurance premiums to compound above CPI over the hold.
Questions for the listing agent
- What do current leases actually rent for vs. the listed asking? Can we see a recent rent roll and the last 12 months of T-12 income?
- It's been on market 135 days. Have you received any prior offers? Is the seller open to a 32% concession, seller financing, or rate buy-down credit?
- Built in 1968 — when were the roof, HVAC, electrical panel, plumbing, and water heater last replaced?
- Why hasn't it sold? Are there any deal-killer items the seller is aware of (foundation, flood, title, zoning, code violations)?
- Is there a deadline driving the sale (1031 exchange, divorce, estate, relocation)? That informs how much negotiation room exists.
- Schools are F-rated, which usually means shorter tenancies and higher turnover. Who's the typical renter profile here, and what's been the actual vacancy rate?
- The area grade is low — what's the realistic commute time and amenity access for the typical tenant pool here? Any planned neighborhood developments (good or bad) we should know about?
- What's the average days-on-market for RENTAL listings here right now (not sales)? A rising rental-DOM trend means longer vacancies and softer asking-rent achievability than the comps imply.
- What's the recent tenant-quality profile in this submarket — average credit score on applications, eviction rate, late-payment / NSF rate, and stable-employment percentage? A property-management company in the area should have these aggregated.
- How much new for-sale + rental construction is in the pipeline within 1–3 miles? Heavy new supply typically softens prices + rents 12–24 months out; constrained supply supports both.
Investment metrics
- 1% rule
- 0.68% ✗
- Cap rate
- 5.58%
- Cash-on-cash
- -2.55%
- DSCR
- 0.89
- GRM
- 12.3
CMA / ARV
- ARV (on-the-fly)
- $188,400
- Comps found
- 1
Show comp detail 1 sale within ~0.75 mi
| Address | Dist | Beds/Ba | Sqft | Sold | Price | $/sf | Match |
|---|---|---|---|---|---|---|---|
| 307 Cherokee St | 0.26mi | 3/1.0 | 1,136 (-10%) | 14mo | $170,000 | $150 | 56 |
Match score weights: distance 35% · size 25% · config 20% · recency 20%. Top-matched comps best support the ARV.
Projected returns pro-forma
10.0% appreciation · 3.0% rent growth · sell at horizon
- IRR
- 22.4%
- Equity multiple
- 2.81×
- Total profit
- $83,470
- Equity at exit
- $148,555
- IRR
- 20.1%
- Equity multiple
- 6.43×
- Total profit
- $250,562
- Equity at exit
- $320,364
Cash invested: $46,172 (down + closing). Projections, not guarantees.
Landlord ↔ Tenant lean methodology
- Overall (STATE)
- 83 Strongly Landlord-Friendly
- State Oklahoma
- 83 Strongly Landlord-Friendly · R+20
- County
- — inherits STATE
- City
- — inherits STATE
ZIP-level market 74936
- Home prices YoY
- 3.7%
- Active inventory
- 11
- Price-to-rent
- 12.3×
Monthly cashflow live
- Estimated rent
- $1,115 medium interval (Pro) →
- Mortgage (P&I)
- −$865
- Tax from tax record
- −$46 /mo · $546/yr
- Insurance
- −$69
- HOA
- −$0
- Vacancy / Maint / Mgmt
- −$234
- Net cashflow
- $-98
Break-even live
Sensitivity live
| Price | -10% $-5 | -5% $-52 | +0% $-98 | +5% $-145 | +10% $-192 |
|---|---|---|---|---|---|
| Rent | -10% $-186 | -5% $-142 | +0% $-98 | +5% $-54 | +10% $-10 |
| Rate | -1.0pp $-15 | -0.5pp $-56 | base $-98 | +0.5pp $-141 | +1.0pp $-184 |
UW: 25.0% down · 7.5% · 30yr · 1.5% tax · 5.0% vac · 8.0% maint · 8.0% mgmt
Financing live
Cash to close
- Down payment
- $41,225
- Closing costs
- $4,947
- Reserves months
- —
- Total cash needed
- —
Loan-product check · same deal, 3 products live
Conventional
25% down · 7.5% · 30yr
- Down + closing
- —
- Monthly P&I
- —
- Monthly cashflow
- —
- DSCR
- —
- Eligible?
- —
Personal DTI + credit; lowest rate.
DSCR
20% down · 8.5% · 30yr
- Down + closing
- —
- Monthly P&I
- —
- Monthly cashflow
- —
- DSCR
- —
- Eligible?
- —
No personal income docs; deal must DSCR.
Hard money
10% down · 12.0% · 12mo
- Down + closing
- —
- Monthly P&I
- —
- Monthly cashflow
- —
- DSCR
- —
- Eligible?
- —
Short-term bridge; refi at stabilization.
Listing history 21 events
-
2026-06-21days on market $164,900 Active 135 DOM
-
2026-06-21days on market $164,900 Active 134 DOM
-
2026-06-18days on market $164,900 Active 132 DOM
-
2026-06-17days on market $164,900 Active 131 DOM
-
2026-06-16days on market $164,900 Active 130 DOM
-
2026-06-15days on market $164,900 Active 129 DOM
-
2026-06-13days on market $164,900 Active 127 DOM
-
2026-06-12days on market $164,900 Active 126 DOM
-
2026-06-09days on market $164,900 Active 123 DOM
-
2026-06-08days on market $164,900 Active 122 DOM
-
2026-06-08days on market $164,900 Active 121 DOM
-
2026-06-05days on market $164,900 Active 119 DOM
-
2026-06-04days on market $164,900 Active 117 DOM
-
2026-06-02days on market $164,900 Active 116 DOM
-
2026-06-01days on market $164,900 Active 115 DOM
-
2026-05-31days on market $164,900 Active 114 DOM
-
2026-05-05price $164,900
-
2026-04-02price $169,000
-
2026-02-07$175,000 Active
-
2010-06-04soldstatus $68,500
-
2004-02-13soldstatus $70,000
ⓘ Source: listings_history table (triggers on properties + properties_extension) + one-shot
backfill from property_details.listing_events for pre-trigger history.
Tax reassessment forecast OK · Resets to sale price
- Current annual tax
- $546 · $46/mo
- Projected year-2 tax
- $1,484 · $124/mo
- Expected delta
- +$938/yr (+$78/mo · 171.8%)
ⓘ Screening estimate from a state-policy table — verify with the county assessor before closing.
Climate risk First Street
- Flood 1/10 Low FEMA zone X (unshaded) · 0% chance over 30 yrs
- Wildfire 7/10 Severe
- Heat 6/10 Major 7 d/yr ≥110°F today · 20 d/yr by 30 yrs out
- Wind 3/10 Moderate 5% chance of damaging wind over 30 yrs
- Air quality 2/10 Low 0 unhealthy d/yr today · 1 by 30 yrs out
Nearby sold comps map
Loading sold comps map…
Walkable amenities ~0.75 mi
Loading nearby amenities…
Taxation est. · year 1
- Rental income
- $13,378
- − Mortgage interest
- −$9,237
- − Property taxes
- −$546
- − Insurance
- −$824
- − Repairs & maintenance
- −$1,070
- − Management
- −$1,070
- − Depreciation
- −$4,797
- Taxable loss
- −$4,167
- Est. tax savings @ 24.0%
- +$1,000
- After-tax cash flow
- $-179/yr
For passive investors: Depreciation is non-cash, so a rental often shows a tax loss while cash-flowing — sheltering income. Rental losses are passive: they offset passive income freely, and up to $25,000/yr can offset ordinary (W-2) income if you actively participate and your MAGI is under $100k (phasing out to $0 by $150k); unused losses carry forward. On sale, claimed depreciation is recaptured at up to 25%, and gains may owe capital-gains tax (a 1031 exchange can defer both). Figures are a year-1 estimate at your 24.0% rate — not tax advice; consult a CPA.
Schools (NCES district)
- District
- Gans
- NCES district ID
- 4012390
- Math proficiency
- 20% ▲ 5.00%
- Reading proficiency
- 25% ▬ 0.00%
- Median HH income
- $39,614
- Composite
- 22.13/100
- National rank
- #13526
- State rank
- #379 of 513 in OK
Livability — Gans
- Score
- 66/100
- State rank
- #105
- US rank
- #11429
Category grades
Schools grade is shown separately in the Schools card above.
Census & demographics
- Census place
- Gans, OK
- Population (ZIP)
- 1,338
Population outlook (Sequoyah County) Hauer SSP2
- Today (2025)
- 39,398 people
- By 2030
- 38,215 · -3.0%
- By 2040
- 35,625 · -9.6%
- By 2050
- 32,943 · -16.4%
- By 2075
- 27,805 · -29.4%
- By 2100
- 23,311 · -40.8%
Race, ethnicity, and origin ACS 2023
- Neighborhood character
- Diverse neighborhood (Simpson 0.66)
- Race & ethnicity
- White 58% Native American 24% Two or more races 13% Hispanic / Latino 4% Black 2%
- Common ancestry
- Serbian 1% Iranian 1% Lithuanian 1%
- Foreign-born
- 1% · Canada
- Languages at home
- 96% English-only · Spanish 4% Other Asian/Pacific 1%
Political lean MEDSL · Sequoyah
- 2024 margin
- Solid R (+61.5) · D 18.6% · R 80.2% · Other 1.2%
- 2008→2024 swing
- -25.5pp toward R · 2008: -36.0pp · 2024: -61.5pp
- All cycles
- 2024: R+61.5 2020: R+59.0 2016: R+54.2 2012: R+39.1 2008: R+36.0
Not yet ingested
- Civics
- —
Market trends
- HPI YoY
- ▲ 11.24%
- Current HPI
- 315.2615
- Rent YoY
- —
- Metro
- —
- State GDP YoY
- ▲ 1.55%
- F500 in state
- 6
Industry mix (Fortune 500 HQ in OK)
| Industry | F500 HQs | Revenue |
|---|---|---|
| Energy | 3 | $48B |
|
||
Price history
+135.6% since first listed5 events — show timeline
- 2026-05-05 Price Changed $164,900 WRVBOR
- 2026-04-02 Price Changed $169,000 WRVBOR
- 2026-02-07 Listed $175,000 WRVBOR
- 2010-06-04 Sold (Public Records) $68,500 Public Records
- 2004-02-13 Sold (Public Records) $70,000 Public Records
Property tax history
-1.2%/yrLatest (2025): $546 · -3.0% YoY. Source: county tax records.
Cash-flow waterfall
monthlySold comps — $/sqft
last 12 mo · ≤1 miLoading sold comps…