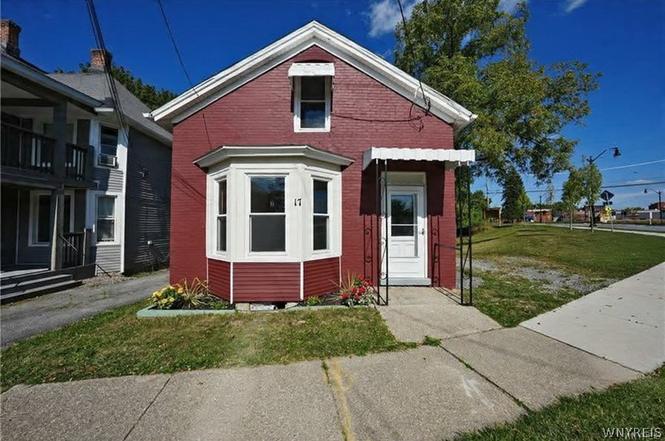
 Duplex
17 Saint Marys St · Lancaster, NY
Flood risk 7/10 · Major
- FEMA flood zone
- X (unshaded)
- Chance of flooding over 30 yrs
- 0.75%
- Est. flood insurance / yr
- $473 – $860
Fire risk 3/10 · Minor
- Est. fire insurance / yr
- $691 – $1,283
Heat risk 3/10 · Minor
- Hot days now (above 92°F)
- 7 days/yr
- Hot days in 30 yrs
- 15 days/yr
Wind risk 1/10 · Minimal
- Chance of severe wind over 30 yrs
- —
Air-quality risk 3/10 · Minor
- Unhealthy air days now
- 2 days/yr
- Unhealthy air days in 30 yrs
- 3 days/yr
Risk factors via First Street. Map © Google.
Why this score? — see what drove the B grade
The composite is a weighted blend of 9 inputs, each scored 0–100. Each bar is that input's sub-score; the figure is the points it added to the 100-point composite (weight × sub-score).
- Cash flow +30.0/30.0
- DSCR +10.0/10.0
- 1% rule +8.8/10.0
- ARV discount +7.5/15.0
- Schools +5.2/10.0
- Livability +3.9/5.0
- Rent growth +2.5/5.0
- Condition / age +2.5/5.0
- Appreciation +0.0/10.0
$224,899
🖨 Deal sheet 📄 Offer letter ✓ Due diligence
Multi-family units
County records classify this as Multi-Family (2-4 Unit). Listing-text estimate: 2 units. confirmed
Listing remarks
Welcome to 17 Saint Mary's; a completely renovated brick two unit, steps from West Main St, you will be walking distance from all the village has to offer. Renovations include new kitchens and bathrooms in both units, luxury laminate floors, as well as central air, all new mechanicals, new tear off roof, and a freshly poured back concrete patio. Ideal for an owner occupant or savvy investor, move in worry free, and enjoy this home ideally situated next to all the village of Lancaster has to offer.
Key facts
- New kitchens
- Completely renovated
- New bathrooms
Tags
Neighborhood map
What this means for you Summary
Snapshot
- This is a 2 × 3-bed/2.0-bath units multifamily listed at $225k.
Deal economics
- At list price, monthly cash flow is $851 ($10k/yr) — positive. Per door: $426/mo.
- The deal already cash-flows at list — no discount required.
- Meets the 1% rule at list price ($3k rent vs $225k).
- Recommended offer: $218k (3.0% below list) — sets the bar for market timing.
- Cap rate 11.1% vs local median 2.9% in Lancaster — top-decile yield for the area; either an underpriced asset or a hidden risk that comps aren't pricing in. Stress-test before assuming the spread holds.
Location & tenants
- Location reads 78/100 on livability (#164 in NY, #2,566 nationally) — a middle-class / working-renter tenant base. Strengths: crime A+, housing A+, health & safety A+; Watch: amenities F, commute F.
- Lancaster Central School District (suburban): math 57% / reading 61% proficiency, ranked #234 of 590 in NY (top 40%) — acceptable for families but not a draw, mixed tenant base, ~2y average lease; only 14% free/reduced lunch — higher-income household profile.
- Market conditions: 152 active listings in the ZIP; 6 comparable units currently listed for rent nearby; rentals lingering (median 44d on market — plan ~5-8 weeks vacancy on turnover, expect pricing pressure); 50% of comp listings sitting > 30 days — soft ceiling on asking rent; solid renter incomes; 1,244 units permitted in Erie County in 2024 (563 in 5+ unit buildings).
- This rent runs 38% of the median local income ($99k/yr) — at the standard rent-burdened threshold; future hikes will face affordability resistance.
Forward outlook
- Local home prices are declining (-3.0%/yr); year-one equity from $2k of loan paydown is wiped out by about $7k of value loss. Plan a longer hold.
- At projected returns (-3.0% appreciation + 3.0% rent growth), your $63k cash investment doubles in ~8 years — after that, you're playing with house money.
Negotiation context
- It's been on market 35 days — a 3% lower offer ($218k) is reasonable based on typical stale-listing flexibility.
- 4 sale attempts with the ask held roughly flat each time — persistent listings suggest the price (not the market) is what's stuck; bring a comps-based counter.
- Current owner paid $110k; list at $225k implies a 104% gain — meaningful room to come down on a strong offer.
Risks & watch-outs
- Watch-outs: flood insurance adds $56/mo; built in 1860 — expect roof / HVAC / electrical / plumbing capex.
- Climate carrying-cost: major flood risk — expect insurance premiums to compound above CPI over the hold.
Questions for the listing agent
- It's been on market 35 days. Have you received any prior offers? Is the seller open to a 3% concession, seller financing, or rate buy-down credit?
- Can we see the unit-by-unit rent roll, current vacancy, and any below-market leases? What's the average tenancy length?
- What capital expenditures (roof, boiler, parking lot, exteriors) have been made in the last 5 years, and what's planned in the next 2?
- Built in 1860 — when were the roof, HVAC, electrical panel, plumbing, and water heater last replaced?
- What's the actual annual flood-insurance premium (NFIP or private), and is the property in a SFHA with mandatory coverage?
- Is there a deadline driving the sale (1031 exchange, divorce, estate, relocation)? That informs how much negotiation room exists.
- Schools are A-rated — typically a magnet for longer-tenancy family renters. What's the average tenant stay here, and is there a school-zone premium baked into asking?
- What's the average days-on-market for RENTAL listings here right now (not sales)? A rising rental-DOM trend means longer vacancies and softer asking-rent achievability than the comps imply.
- What's the recent tenant-quality profile in this submarket — average credit score on applications, eviction rate, late-payment / NSF rate, and stable-employment percentage? A property-management company in the area should have these aggregated.
- How much new apartment / multifamily construction is in the pipeline within 1–3 miles? Heavy new supply (>2% of stock underway) typically softens rents 12–24 months out; light construction supports rent growth.
Investment metrics
- 1% rule
- 1.38% ✓
- Cap rate
- 11.13%
- Cash-on-cash
- 17.28%
- DSCR
- 1.77
- GRM
- 6.0
CMA / ARV
No comps found within radius.
Projected returns pro-forma
-3.0% appreciation · 3.0% rent growth · sell at horizon
- IRR
- 7.3%
- Equity multiple
- 1.28×
- Total profit
- $17,859
- Equity at exit
- $33,533
- IRR
- 16.6%
- Equity multiple
- 2.36×
- Total profit
- $85,693
- Equity at exit
- $19,445
Cash invested: $62,972 (down + closing). Projections, not guarantees.
Landlord ↔ Tenant lean methodology
- Overall (STATE)
- 15 Strongly Tenant-Friendly
- State New York
- 15 Strongly Tenant-Friendly · D+10
- County
- — inherits STATE
- City
- — inherits STATE
ZIP-level market 14086
- Home prices YoY
- -30.5%
- Active inventory
- 152
- Price-to-rent
- 12.1×
Monthly cashflow live
- Estimated rent
- $3,111 medium interval (Pro) →
- Mortgage (P&I)
- −$1,179
- Tax from tax record
- −$278 /mo · $3,332/yr
- Insurance
- −$94
- Flood insurance flood zone
- −$56 /mo · $666/yr
- HOA
- −$0
- Vacancy / Maint / Mgmt
- −$653
- Net cashflow
- $851
Break-even live
2-unit breakdown (identical units grouped — click to expand)
| Units | Beds | Baths | Est. rent |
|---|---|---|---|
| 2× units | 3 | 2 | $3,110 |
| #1 | 3 | 2 | $1,555 |
| #2 | 3 | 2 | $1,555 |
| Total (2 units) | $3,111 | ||
UW: 25.0% down · 7.5% · 30yr · 1.5% tax · 5.0% vac · 8.0% maint · 8.0% mgmt
Financing live
Cash to close
- Down payment
- $56,225
- Closing costs
- $6,747
- Reserves months
- —
- Total cash needed
- —
Loan-product check · same deal, 3 products live
Conventional
25% down · 7.5% · 30yr
- Down + closing
- —
- Monthly P&I
- —
- Monthly cashflow
- —
- DSCR
- —
- Eligible?
- —
Personal DTI + credit; lowest rate.
DSCR
20% down · 8.5% · 30yr
- Down + closing
- —
- Monthly P&I
- —
- Monthly cashflow
- —
- DSCR
- —
- Eligible?
- —
No personal income docs; deal must DSCR.
Hard money
10% down · 12.0% · 12mo
- Down + closing
- —
- Monthly P&I
- —
- Monthly cashflow
- —
- DSCR
- —
- Eligible?
- —
Short-term bridge; refi at stabilization.
Rent comps 6 comps
| Address | Beds | Baths | Sqft | Rent | $/sqft | DOM | Units | Dist |
|---|---|---|---|---|---|---|---|---|
| 136 Sawyer Ave Unit 2 Depew, NY | 2.0 | 1.0 | 1000 | $1,350 | $1.35 | 43d | 1 | 0.60mi |
| 136 Sawyer Ave Unit 1 Depew, NY | 1.0 | 1.0 | 800 | $1,200 | $1.50 | 43d | 1 | 0.60mi |
| 104 Hinchey Ave Apt 3 Lancaster, NY | 2.0 | 1.0 | 688 | $1,165 | $1.69 | 3d | 1 | 0.83mi |
| 591 Terrace Blvd Depew, NY | 1.0 | 1.0 | 702 | $1,425 | $2.03 | 1d | 1 | 0.91mi |
| 3284 Walden Ave Depew, NY | 1.0 | 1.0 | 750 | $1,350 | $1.80 | 43d | 1 | 1.33mi |
| 5841 Transit Rd Unit 3 Depew, NY | 2.0 | 1.0 | 750 | $1,335 | $1.78 | 3d | 1 | 1.43mi |
Listing history 14 events
-
2026-04-07status Pending
-
2026-04-01price $224,899
-
2026-03-02$224,900 Active
-
2025-12-26price $249,897
-
2025-12-26price $249,897
-
2025-11-08price $249,898
-
2025-11-08price $249,898
-
2025-10-31price $249,899
-
2025-10-31price $249,899
-
2025-10-21$249,900 Active
-
2025-10-14historical
-
2025-10-14$249,900 Active
-
2025-09-19$249,900 Active
-
2024-08-21soldstatus $110,000
ⓘ Source: listings_history table (triggers on properties + properties_extension) + one-shot
backfill from property_details.listing_events for pre-trigger history.
Tax reassessment forecast NY · Partial reset (capped growth)
- Current annual tax
- $3,332 · $278/mo
- Projected year-2 tax
- $3,567 · $297/mo
- Expected delta
- +$234/yr (+$20/mo · 7.0%)
ⓘ Screening estimate from a state-policy table — verify with the county assessor before closing.
Climate risk First Street
- Flood 7/10 Severe FEMA zone X (unshaded) · 75% chance over 30 yrs
- Wildfire 3/10 Moderate
- Heat 3/10 Moderate 7 d/yr ≥92°F today · 15 d/yr by 30 yrs out
- Wind 1/10 Low
- Air quality 3/10 Moderate 2 unhealthy d/yr today · 3 by 30 yrs out
Nearby sold comps map
Loading sold comps map…
Walkable amenities ~0.75 mi
Loading nearby amenities…
Taxation est. · year 1
- Rental income
- $37,332
- − Mortgage interest
- −$12,598
- − Property taxes
- −$3,332
- − Insurance
- −$1,791
- − Repairs & maintenance
- −$2,987
- − Management
- −$2,987
- − Depreciation
- −$6,543
- Taxable income
- $7,095
- Est. tax owed @ 24.0%
- −$1,703
- After-tax cash flow
- $8,513/yr
For passive investors: Depreciation is non-cash, so a rental often shows a tax loss while cash-flowing — sheltering income. Rental losses are passive: they offset passive income freely, and up to $25,000/yr can offset ordinary (W-2) income if you actively participate and your MAGI is under $100k (phasing out to $0 by $150k); unused losses carry forward. On sale, claimed depreciation is recaptured at up to 25%, and gains may owe capital-gains tax (a 1031 exchange can defer both). Figures are a year-1 estimate at your 24.0% rate — not tax advice; consult a CPA.
Schools (NCES district)
- District
- Lancaster Central School District
- NCES district ID
- 3616680
- Math proficiency
- 57% ▼ -13.00%
- Reading proficiency
- 61% ▲ 2.00%
- Median HH income
- $64,668
- Composite
- 51.64/100
- National rank
- #1700
- State rank
- #234 of 590 in NY
Livability — Lancaster
- Score
- 78/100
- State rank
- #164
- US rank
- #2566
Category grades
Schools grade is shown separately in the Schools card above.
Census & demographics
- Census place
- Lancaster, NY
- County
- Erie County · 714,559 people
- City population
- 35,635
- Metro
- Buffalo-Cheektowaga, NY
- Population (ZIP)
- 35,635
- Household income
- $99,499
- Rent vs Own
- Severe rent burden
- 513.0
Population outlook (Erie County) Hauer SSP2
- Today (2025)
- 933,037 people
- By 2030
- 935,181 · +0.2%
- By 2040
- 928,531 · -0.5%
- By 2050
- 905,725 · -2.9%
- By 2075
- 834,037 · -10.6%
- By 2100
- 708,033 · -24.1%
Race, ethnicity, and origin ACS 2023
- Neighborhood character
- Predominantly White (95%)
- Race & ethnicity
- White 95% Two or more races 2% Black 1% Hispanic / Latino 1%
- Common ancestry
- Romanian 28% Lithuanian 2% Slovak 2%
- Foreign-born
- 3% · Canada
- Languages at home
- 96% English-only · Russian/Polish/Slavic 1% Other Indo-European 1% Arabic 1%
Political lean MEDSL · Erie
- 2024 margin
- Lean D (+9.7) · D 54.8% · R 45.2%
- 2008→2024 swing
- -7.9pp toward R · 2008: 17.5pp · 2024: 9.7pp
- All cycles
- 2024: D+9.7 2020: D+14.7 2016: D+4.8 2012: D+15.6 2008: D+17.5
Not yet ingested
- Civics
- —
Market trends
- HPI YoY
- ▼ -133.14%
- Current HPI
- 302.7484
- Rent YoY
- —
- Metro
- Buffalo-Cheektowaga, NY
- State GDP YoY
- ▲ 2.60%
- F500 in state
- 92
Industry mix (Fortune 500 HQ in NY)
| Industry | F500 HQs | Revenue |
|---|---|---|
| Financial Services | 10 | $950B |
|
||
| Consumer Goods | 9 | $162B |
|
||
| Insurance | 4 | $225B |
|
||
| Telecommunications | 2 | $144B |
|
||
| Pharmaceuticals | 2 | $112B |
|
||
| Media / Entertainment | 2 | $69B |
|
||
Price history
+104.5% since first listed14 events — show timeline
- 2026-04-07 Pending — WNYREIS
- 2026-04-01 Price Changed $224,899 WNYREIS
- 2026-03-02 Listed $224,900 WNYREIS
- 2025-12-26 Price Changed $249,897 WNYREIS
- 2025-12-26 Price Changed $249,897 WNYREIS
- 2025-11-08 Price Changed $249,898 WNYREIS
- 2025-11-08 Price Changed $249,898 WNYREIS
- 2025-10-31 Price Changed $249,899 WNYREIS
- 2025-10-31 Price Changed $249,899 WNYREIS
- 2025-10-21 Listed $249,900 WNYREIS
- 2025-10-14 Listing Removed — WNYREIS
- 2025-10-14 Listed $249,900 WNYREIS
- 2025-09-19 Listed $249,900 WNYREIS
- 2024-08-21 Sold (Public Records) $110,000 Public Records
Property tax history
+7.3%/yrLatest (2025): $3,332 · +0.5% YoY. Source: county tax records.
Cash-flow waterfall
monthlySold comps — $/sqft
last 12 mo · ≤1 miLoading sold comps…