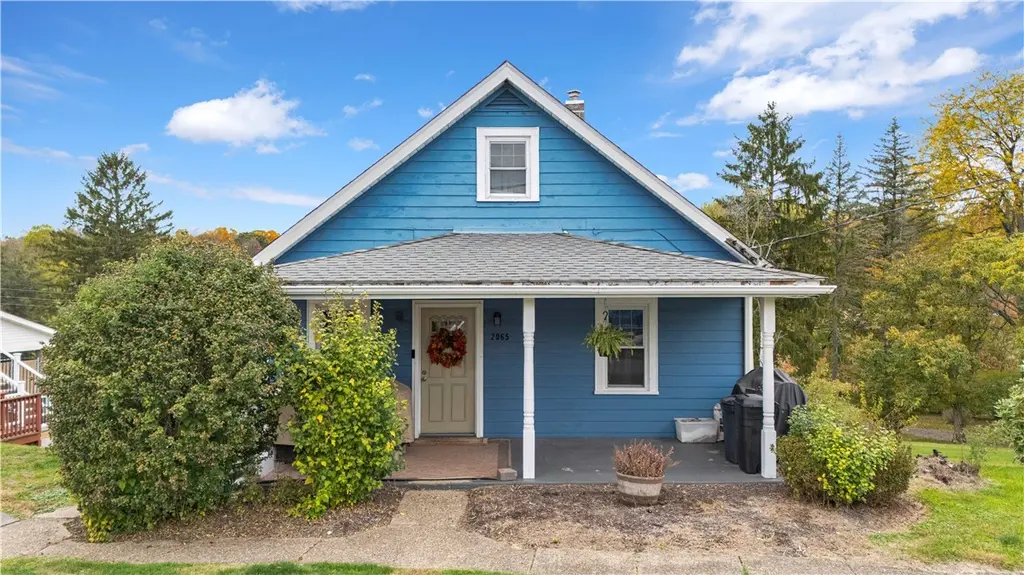
2065 Brodhead Rd · Hopewell, PA
Flood risk 1/10 · Minimal
- FEMA flood zone
- X (unshaded)
- Chance of flooding over 30 yrs
- 0.0%
- Est. flood insurance / yr
- $473 – $860
Fire risk 1/10 · Minimal
- Est. fire insurance / yr
- $511 – $949
Heat risk 3/10 · Minor
- Hot days now (above 97°F)
- 7 days/yr
- Hot days in 30 yrs
- 17 days/yr
Wind risk 2/10 · Minimal
- Chance of severe wind over 30 yrs
- —
Air-quality risk 3/10 · Minor
- Unhealthy air days now
- 2 days/yr
- Unhealthy air days in 30 yrs
- 4 days/yr
Risk factors via First Street. Map © Google.
Why this score? — see what drove the C+ grade
The composite is a weighted blend of 9 inputs, each scored 0–100. Each bar is that input's sub-score; the figure is the points it added to the 100-point composite (weight × sub-score).
- Cash flow +22.5/30.0
- ARV discount +15.0/15.0
- DSCR +7.2/10.0
- 1% rule +5.8/10.0
- Schools +4.2/10.0
- Rent growth +3.0/5.0
- Livability +2.9/5.0
- Condition / age +2.5/5.0
- Appreciation +0.0/10.0
$150,000
🖨 Deal sheet 📄 Offer letter ✓ Due diligence
Listing remarks MLS
This charming 3-bedroom, 1-bath home in the Hopewell School District offers a newer roof, updated mechanics, and a walk-out basement with plenty of storage. Inside, you'll find a flexible floor plan with a dining room that can also serve as a home office. The fenced yard provides usable outdoor space ideal for relaxing, playing, or pets. With its convenient location and versatile layout, this property is perfect as a primary residence, home/office, or investment opportunity.
Key facts
- Fenced yard
- Newer roof
- Flexible floor plan
Tags
Neighborhood map
What this means for you Summary
Snapshot
- This is a 3-bed/1.0-bath single-family listed at $150k.
Deal economics
- At list price, monthly cash flow is $253 ($3k/yr) — positive.
- The deal already cash-flows at list — no discount required.
- Meets the 1% rule at list price ($2k rent vs $150k).
- Recommended offer: $132k (12.0% below list) — sets the bar for market timing.
Location & tenants
- Location reads 57/100 on livability (#1,615 in PA) — a working-class tenant base; expect higher turnover. Strengths: cost of living A+, housing B+; Watch: crime D+, employment D, schools F.
- Hopewell Area SD (suburban): math 36% / reading 60% proficiency, ranked #191 of 539 in PA (top 35%) — families likely to look elsewhere, expect single-tenant / working-renter base with shorter leases.
- Market conditions: Rents rising (+2.0%/yr); 130 active listings in the ZIP; 1 comparable units currently listed for rent nearby; 272 units permitted in Beaver County in 2024 (80 in 5+ unit buildings).
Forward outlook
- Local home prices are declining (-3.0%/yr); year-one equity from $1k of loan paydown is wiped out by about $4k of value loss. Plan a longer hold.
- Beaver County population projected at -14% by 2050 — secular population decline; favor cash flow + early exit over multi-decade hold.
Negotiation context
- It's been on market 227 days — a 12% lower offer ($132k) is reasonable based on typical stale-listing flexibility.
- 2 sale attempts since 19y ago with the ask held roughly flat each time — persistent listings suggest the price (not the market) is what's stuck; bring a comps-based counter.
- Current owner paid $88k; list at $150k implies a 71% gain — meaningful room to come down on a strong offer.
Risks & watch-outs
- Watch-outs: built in 1946 — expect roof / HVAC / electrical / plumbing capex.
Questions for the listing agent
- It's been on market 227 days. Have you received any prior offers? Is the seller open to a 12% concession, seller financing, or rate buy-down credit?
- Built in 1946 — when were the roof, HVAC, electrical panel, plumbing, and water heater last replaced?
- Why hasn't it sold? Are there any deal-killer items the seller is aware of (foundation, flood, title, zoning, code violations)?
- Is there a deadline driving the sale (1031 exchange, divorce, estate, relocation)? That informs how much negotiation room exists.
- Schools are F-rated, which usually means shorter tenancies and higher turnover. Who's the typical renter profile here, and what's been the actual vacancy rate?
- Crime grade is D in this area — have there been break-ins, vandalism, or insurance claims at this property in the last 3 years? What carrier currently insures it and at what premium?
- What's the average days-on-market for RENTAL listings here right now (not sales)? A rising rental-DOM trend means longer vacancies and softer asking-rent achievability than the comps imply.
- What's the recent tenant-quality profile in this submarket — average credit score on applications, eviction rate, late-payment / NSF rate, and stable-employment percentage? A property-management company in the area should have these aggregated.
- How much new for-sale + rental construction is in the pipeline within 1–3 miles? Heavy new supply typically softens prices + rents 12–24 months out; constrained supply supports both.
Investment metrics
- 1% rule
- 1.08% ✓
- Cap rate
- 8.32%
- Cash-on-cash
- 7.23%
- DSCR
- 1.32
- GRM
- 7.7
CMA / ARV
- ARV (median comp)
- $186,124
- List price
- $150,000
- Delta
- -19.41%
- Verdict
- UNDERPRICED
- Comps
- 20 within 1.0 mi
Show comp detail 12 sales within ~0.75 mi
| Address | Dist | Beds/Ba | Sqft | Sold | Price | $/sf | Match |
|---|---|---|---|---|---|---|---|
| 2071 Brodhead Rd | 0.03mi | 2/2.0 (-1) | 946 (-4%) | 2mo | $150,000 | $159 | 82 |
| 3112 Ridge Ave | 0.28mi | 3/1.0 | 1,001 (+2%) | 11mo | $120,000 | $120 | 74 |
| 2118 Brodhead Rd | 0.26mi | 3/1.0 | 1,056 (+8%) | 3mo | $217,500 | $206 | 73 |
| 205 Morrow Way | 0.30mi | 3/1.5 | 960 (-2%) | 10mo | $186,000 | $194 | 72 |
| 5037 Clifton Dr | 0.43mi | 3/1.5 | 988 (+1%) | 11mo | $226,000 | $229 | 68 |
| 125 Strawberry Aly | 0.21mi | 3/1.5 | 1,077 (+10%) | 12mo | $180,000 | $167 | 62 |
| 5032 Clifton Dr | 0.40mi | 4/1.5 (+1) | 1,040 (+6%) | 12mo | $250,000 | $240 | 54 |
| 5129 Wickham St | 0.58mi | 3/2.0 | 1,040 (+6%) | 13mo | $240,000 | $231 | 48 |
| 5204 Webb St | 0.59mi | 3/1.5 | 1,056 (+8%) | 13mo | $222,500 | $211 | 47 |
| 5106 Mcintosh Dr | 0.65mi | 3/1.0 | 1,056 (+8%) | 12mo | $235,000 | $223 | 47 |
| 5100 Mcintosh Dr | 0.61mi | 2/1.5 (-1) | 1,092 (+11%) | 5mo | $190,000 | $174 | 41 |
| 5612 Alan St | 0.70mi | 3/2.0 | 1,100 (+12%) | 8mo | $241,000 | $219 | 36 |
Match score weights: distance 35% · size 25% · config 20% · recency 20%. Top-matched comps best support the ARV.
Projected returns pro-forma
-3.0% appreciation · 2.05% rent growth · sell at horizon
- IRR
- -6.3%
- Equity multiple
- 0.77×
- Total profit
- $-9,694
- Equity at exit
- $22,365
- IRR
- 2.2%
- Equity multiple
- 1.15×
- Total profit
- $6,228
- Equity at exit
- $12,969
Cash invested: $42,000 (down + closing). Projections, not guarantees.
Landlord ↔ Tenant lean methodology
- Overall (STATE)
- 62 Landlord-Friendly
- State Pennsylvania
- 62 Landlord-Friendly · EVEN
- County
- — inherits STATE
- City
- — inherits STATE
ZIP-level market 15001
- Home prices YoY
- -20.8%
- Rents YoY
- 2.0%
- Active inventory
- 130
- Price-to-rent
- 7.7×
Monthly cashflow live
- Estimated rent
- $1,618 medium interval (Pro) →
- Mortgage (P&I)
- −$787
- Tax from tax record
- −$176 /mo · $2,110/yr
- Insurance
- −$62
- HOA
- −$0
- Vacancy / Maint / Mgmt
- −$340
- Net cashflow
- $253
Break-even live
UW: 25.0% down · 7.5% · 30yr · 1.5% tax · 5.0% vac · 8.0% maint · 8.0% mgmt
Financing live
Cash to close
- Down payment
- $37,500
- Closing costs
- $4,500
- Reserves months
- —
- Total cash needed
- —
Loan-product check · same deal, 3 products live
Conventional
25% down · 7.5% · 30yr
- Down + closing
- —
- Monthly P&I
- —
- Monthly cashflow
- —
- DSCR
- —
- Eligible?
- —
Personal DTI + credit; lowest rate.
DSCR
20% down · 8.5% · 30yr
- Down + closing
- —
- Monthly P&I
- —
- Monthly cashflow
- —
- DSCR
- —
- Eligible?
- —
No personal income docs; deal must DSCR.
Hard money
10% down · 12.0% · 12mo
- Down + closing
- —
- Monthly P&I
- —
- Monthly cashflow
- —
- DSCR
- —
- Eligible?
- —
Short-term bridge; refi at stabilization.
Rent comps 1 comps
| Address | Beds | Baths | Sqft | Rent | $/sqft | DOM | Units | Dist |
|---|---|---|---|---|---|---|---|---|
| 2971 Kane Rd Aliquippa, PA | 1.0–3.0 | 1.0–2.0 | 1173 | $1,880 | $1.60 | 1d | 18 | 1.23mi |
Listing history 19 events
-
2026-06-18days on market $150,000 Active 227 DOM
-
2026-06-17days on market $150,000 Active 226 DOM
-
2026-06-16days on market $150,000 Active 225 DOM
-
2026-06-15days on market $150,000 Active 224 DOM
-
2026-06-13days on market $150,000 Active 222 DOM
-
2026-06-09days on market $150,000 Active 218 DOM
-
2026-06-08days on market $150,000 Active 217 DOM
-
2026-06-07days on market $150,000 Active 216 DOM
-
2026-06-05days on market $150,000 Active 213 DOM
-
2026-06-03days on market $150,000 Active 212 DOM
-
2026-06-02days on market $150,000 Active 211 DOM
-
2026-06-01days on market $150,000 Active 210 DOM
-
2026-05-31days on market $150,000 Active 209 DOM
-
2026-04-28price $150,000 479-char remark
Show marketing remark (479 chars)
This charming 3-bedroom, 1-bath home in the Hopewell School District offers a newer roof, updated mechanics, and a walk-out basement with plenty of storage. Inside, you'll find a flexible floor plan with a dining room that can also serve as a home office. The fenced yard provides usable outdoor space ideal for relaxing, playing, or pets. With its convenient location and versatile layout, this property is perfect as a primary residence, home/office, or investment opportunity.
-
2025-11-03$157,000 Active 479-char remark
Show marketing remark (479 chars)
This charming 3-bedroom, 1-bath home in the Hopewell School District offers a newer roof, updated mechanics, and a walk-out basement with plenty of storage. Inside, you'll find a flexible floor plan with a dining room that can also serve as a home office. The fenced yard provides usable outdoor space ideal for relaxing, playing, or pets. With its convenient location and versatile layout, this property is perfect as a primary residence, home/office, or investment opportunity.
-
2007-10-11soldstatus $87,500
-
2007-08-31soldstatus $87,500
-
2007-04-19$114,900
-
1974-09-01soldstatus $10,000
ⓘ Source: listings_history table (triggers on properties + properties_extension) + one-shot
backfill from property_details.listing_events for pre-trigger history.
Tax reassessment forecast PA · Partial reset (capped growth)
- Current annual tax
- $2,110 · $176/mo
- Projected year-2 tax
- $2,240 · $187/mo
- Expected delta
- +$130/yr (+$11/mo · 6.2%)
ⓘ Screening estimate from a state-policy table — verify with the county assessor before closing.
Climate risk First Street
- Flood 1/10 Low FEMA zone X (unshaded) · 0% chance over 30 yrs
- Wildfire 1/10 Low
- Heat 3/10 Moderate 7 d/yr ≥97°F today · 17 d/yr by 30 yrs out
- Wind 2/10 Low
- Air quality 3/10 Moderate 2 unhealthy d/yr today · 4 by 30 yrs out
Nearby sold comps map
Loading sold comps map…
Walkable amenities ~0.75 mi
Loading nearby amenities…
Taxation est. · year 1
- Rental income
- $19,416
- − Mortgage interest
- −$8,402
- − Property taxes
- −$2,110
- − Insurance
- −$750
- − Repairs & maintenance
- −$1,553
- − Management
- −$1,553
- − Depreciation
- −$4,364
- Taxable income
- $683
- Est. tax owed @ 24.0%
- −$164
- After-tax cash flow
- $2,875/yr
For passive investors: Depreciation is non-cash, so a rental often shows a tax loss while cash-flowing — sheltering income. Rental losses are passive: they offset passive income freely, and up to $25,000/yr can offset ordinary (W-2) income if you actively participate and your MAGI is under $100k (phasing out to $0 by $150k); unused losses carry forward. On sale, claimed depreciation is recaptured at up to 25%, and gains may owe capital-gains tax (a 1031 exchange can defer both). Figures are a year-1 estimate at your 24.0% rate — not tax advice; consult a CPA.
Schools (NCES district)
- District
- Hopewell Area SD
- NCES district ID
- 4212030
- Math proficiency
- 36% ▼ -12.00%
- Reading proficiency
- 60% ▼ -7.00%
- Median HH income
- $59,944
- Composite
- 41.98/100
- National rank
- #3340
- State rank
- #191 of 539 in PA
Livability — Hopewell
- Score
- 57/100
- State rank
- #1615
- US rank
- #22072
Category grades
Schools grade is shown separately in the Schools card above.
Census & demographics
- County
- Beaver County · 116,001 people
- Metro
- Pittsburgh, PA
- Population (ZIP)
- 31,976
- Household income
- $70,985
- Rent vs Own
- Severe rent burden
- 720.0
Population outlook (Beaver County) Hauer SSP2
- Today (2025)
- 164,976 people
- By 2030
- 161,449 · -2.1%
- By 2040
- 151,752 · -8.0%
- By 2050
- 141,155 · -14.4%
- By 2075
- 118,142 · -28.4%
- By 2100
- 91,740 · -44.4%
Race, ethnicity, and origin ACS 2023
- Neighborhood character
- Predominantly White (80%)
- Race & ethnicity
- White 80% Black 13% Two or more races 5% Hispanic / Latino 2%
- Common ancestry
- Romanian 6% Serbian 2% Subsaharan African 2%
- Foreign-born
- 3% · Canada
- Languages at home
- 96% English-only · Other Indo-European 2% Spanish 1% German/W. Germanic 1%
Political lean MEDSL · Beaver
- 2024 margin
- Strong R (+20.7) · D 39.2% · R 59.9%
- 2008→2024 swing
- -17.9pp toward R · 2008: -2.8pp · 2024: -20.7pp
- All cycles
- 2024: R+20.7 2020: R+17.7 2016: R+20.1 2012: R+6.6 2008: R+2.8
Not yet ingested
- Civics
- —
Market trends
- HPI YoY
- ▼ -65.21%
- Current HPI
- 247.7251
- Rent YoY
- ▲ 2.05%
- Metro
- Pittsburgh, PA
- State GDP YoY
- ▲ 1.68%
- F500 in state
- 34
Industry mix (Fortune 500 HQ in PA)
| Industry | F500 HQs | Revenue |
|---|---|---|
| Healthcare | 2 | $309B |
|
||
| Insurance | 2 | $27B |
|
||
| Telecommunications / Media | 1 | $124B |
|
||
| Industrial Distribution | 1 | $22B |
|
||
| Financial Services | 1 | $20B |
|
||
| Chemicals / Materials | 1 | $18B |
|
||
Price history
+1400.0% since first listed6 events — show timeline
- 2026-04-28 Price Changed $150,000 West Penn MLS
- 2025-11-03 Listed $157,000 West Penn MLS
- 2007-10-11 Sold (Public Records) $87,500 Public Records
- 2007-08-31 Sold (MLS) $87,500 West Penn MLS
- 2007-04-19 Listed $114,900 West Penn MLS
- 1974-09-01 Sold (Public Records) $10,000 Public Records
Property tax history
+3.6%/yrLatest (2026): $2,110 · +3.5% YoY. Source: county tax records.
Cash-flow waterfall
monthlySold comps — $/sqft
last 12 mo · ≤1 miLoading sold comps…