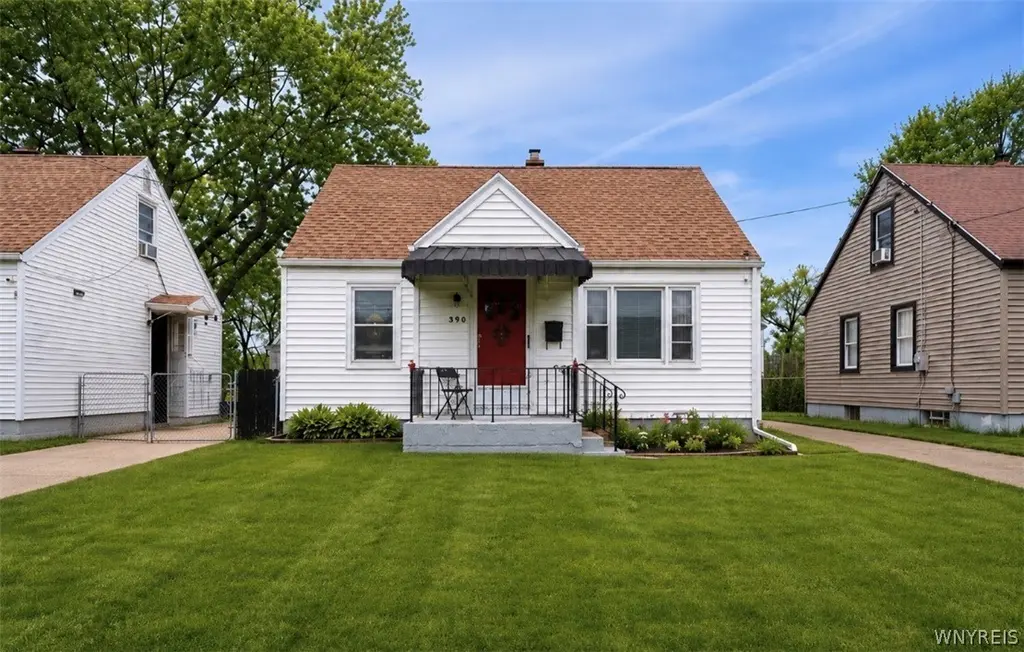
390 Roesch Ave · Buffalo, NY
Flood risk 1/10 · Minimal
- FEMA flood zone
- X (unshaded)
- Chance of flooding over 30 yrs
- 0.0%
- Est. flood insurance / yr
- $473 – $860
Fire risk 1/10 · Minimal
- Est. fire insurance / yr
- $691 – $1,283
Heat risk 3/10 · Minor
- Hot days now (above 93°F)
- 7 days/yr
- Hot days in 30 yrs
- 15 days/yr
Wind risk 1/10 · Minimal
- Chance of severe wind over 30 yrs
- —
Air-quality risk 3/10 · Minor
- Unhealthy air days now
- 3 days/yr
- Unhealthy air days in 30 yrs
- 4 days/yr
Risk factors via First Street. Map © Google.
Why this score? — see what drove the C+ grade
The composite is a weighted blend of 9 inputs, each scored 0–100. Each bar is that input's sub-score; the figure is the points it added to the 100-point composite (weight × sub-score).
- Cash flow +21.9/30.0
- ARV discount +15.0/15.0
- DSCR +7.0/10.0
- 1% rule +4.5/10.0
- Rent growth +4.5/5.0
- Livability +3.9/5.0
- Schools +3.3/10.0
- Condition / age +2.5/5.0
- Appreciation +0.0/10.0
$169,900
🖨 Deal sheet 📄 Offer letter ✓ Due diligence
Listing remarks MLS
Cute 3 bedroom cape with a fenced in yard and hardwood floors throughout. Just needs your finishing touches to make it your own. Come take a look!
Key facts
- Spacious kitchen
- Roof replacement
- Expansive backyard
Tags
Property features AI
Exterior
- Parking: Detached garage; Approximately 1.5 garage spaces
- Utilities: Electricity connected; Public water connected; Sewer connected
- Home design: Single-story property; Existing structure
- Construction: Vinyl siding; Asphalt shingle roof; Poured foundation
- Exterior features: Concrete driveway; Rectangular residential lot, 44 x 120
Interior
- Kitchen: Dishwasher; Gas oven; Gas range; Refrigerator
- Bedrooms: 2 main-level bedrooms
- Flooring: Carpet; Hardwood; Vinyl; Varied flooring
- Bathrooms: 1 full bathroom (main level)
- Heating & cooling: Gas forced-air heating; Central air conditioning
- Interior features: Eat-in kitchen; Solid surface counters; Partially finished full basement
- Laundry & utility: Laundry in basement; Gas water heater
Neighborhood map
What this means for you Summary
Snapshot
- This is a 3-bed/1.0-bath single-family listed at $170k.
Deal economics
- At list price, monthly cash flow is $268 ($3k/yr) — positive.
- The deal already cash-flows at list — no discount required.
- To meet the 1% rule (rent ≥ 1% of price), the offer needs to be $161k (5.3% below list).
- Recommended offer: $161k (5.3% below list) — sets the bar for 1% rule.
Location & tenants
- Location reads 77/100 on livability (#195 in NY, #3,011 nationally) — a middle-class / working-renter tenant base. Strengths: commute A+, housing A+, health & safety A+; Watch: crime F, employment D-.
- Buffalo City School District (urban): math 41% / reading 40% proficiency, ranked #535 of 590 in NY (top 91%) — families likely to look elsewhere, expect single-tenant / working-renter base with shorter leases; 75% free/reduced lunch — lower-income household profile, screen leases tightly.
- Market conditions: Rents rising fast (+8.2%/yr); 197 active listings in the ZIP; 16 comparable units currently listed for rent nearby; rentals at typical pace (median 21d on market — plan ~3-4 weeks tenant-placement turnaround); lower-income renter base — watch delinquency; 1,244 units permitted in Erie County in 2024 (563 in 5+ unit buildings).
- At $1,609/mo this rent would consume 49% of the median local household income ($40k/yr) (locally 2177% of renters already pay >50% of income on rent) — very limited rent-growth headroom before tenants either downsize or default.
Forward outlook
- Local home prices are declining (-3.0%/yr); year-one equity from $1k of loan paydown is wiped out by about $5k of value loss. Plan a longer hold.
- At projected returns (-3.0% appreciation + 8.0% rent growth), your $48k cash investment doubles in ~9 years — after that, you're playing with house money.
Negotiation context
- Only 4 days on market — expect competitive offers; lowballing is unlikely to land.
- 2 sale attempts since 12y ago with the ask held roughly flat each time — persistent listings suggest the price (not the market) is what's stuck; bring a comps-based counter.
- Current owner paid $41k; list at $170k implies a 314% gain — meaningful room to come down on a strong offer.
Risks & watch-outs
- Watch-outs: built in 1952 — expect roof / HVAC / electrical / plumbing capex.
Questions for the listing agent
- Built in 1952 — when were the roof, HVAC, electrical panel, plumbing, and water heater last replaced?
- Is there a deadline driving the sale (1031 exchange, divorce, estate, relocation)? That informs how much negotiation room exists.
- Crime grade is F in this area — have there been break-ins, vandalism, or insurance claims at this property in the last 3 years? What carrier currently insures it and at what premium?
- What's the average days-on-market for RENTAL listings here right now (not sales)? A rising rental-DOM trend means longer vacancies and softer asking-rent achievability than the comps imply.
- What's the recent tenant-quality profile in this submarket — average credit score on applications, eviction rate, late-payment / NSF rate, and stable-employment percentage? A property-management company in the area should have these aggregated.
- How much new for-sale + rental construction is in the pipeline within 1–3 miles? Heavy new supply typically softens prices + rents 12–24 months out; constrained supply supports both.
Investment metrics
- 1% rule
- 0.95% ✗
- Cap rate
- 8.19%
- Cash-on-cash
- 6.76%
- DSCR
- 1.30
- GRM
- 8.8
CMA / ARV
- ARV (on-the-fly)
- $211,120
- Comps found
- 12
Show comp detail 12 sales within ~0.75 mi
| Address | Dist | Beds/Ba | Sqft | Sold | Price | $/sf | Match |
|---|---|---|---|---|---|---|---|
| 361 Roesch Ave | 0.06mi | 3/1.0 | 1,116 (+7%) | 8mo | $218,500 | $196 | 78 |
| 108 Argus St | 0.39mi | 3/1.0 | 993 (-4%) | 6mo | $40,000 | $40 | 69 |
| 242 Hoover Ave | 0.58mi | 3/1.0 | 1,035 (-0%) | 6mo | $227,500 | $220 | 67 |
| 221 Newfield St | 0.21mi | 4/1.5 (+1) | 1,127 (+8%) | 4mo | $75,000 | $67 | 66 |
| 419 Washington Ave | 0.62mi | 3/1.0 | 1,014 (-2%) | 6mo | $220,000 | $217 | 62 |
| 55 Irene St | 0.55mi | 3/2.0 | 1,080 (+4%) | 7mo | $205,000 | $190 | 59 |
| 82 Beatrice Ave | 0.46mi | 3/1.0 | 1,166 (+12%) | 2mo | $165,000 | $142 | 56 |
| 446 Victoria Blvd | 0.58mi | 3/1.0 | 1,144 (+10%) | 2mo | $265,000 | $232 | 55 |
| 5 Ruhl Ave | 0.75mi | 3/1.0 | 964 (-7%) | 0mo | $234,100 | $243 | 53 |
| 370 Washington Ave | 0.70mi | 3/1.0 | 1,132 (+9%) | 3mo | $230,000 | $203 | 50 |
| 145 Hoover Ave | 0.74mi | 3/2.0 | 1,143 (+10%) | 2mo | $155,000 | $136 | 43 |
| 384 Mang Ave | 0.72mi | 3/1.0 | 1,155 (+11%) | 7mo | $267,000 | $231 | 42 |
Match score weights: distance 35% · size 25% · config 20% · recency 20%. Top-matched comps best support the ARV.
Projected returns pro-forma
-3.0% appreciation · 8.0% rent growth · sell at horizon
- IRR
- -1.1%
- Equity multiple
- 0.96×
- Total profit
- $-2,046
- Equity at exit
- $25,333
- IRR
- 12.8%
- Equity multiple
- 2.23×
- Total profit
- $58,559
- Equity at exit
- $14,690
Cash invested: $47,572 (down + closing). Projections, not guarantees.
Landlord ↔ Tenant lean methodology
- Overall (STATE)
- 15 Strongly Tenant-Friendly
- State New York
- 15 Strongly Tenant-Friendly · D+10
- County
- — inherits STATE
- City
- — inherits STATE
ZIP-level market 14207
- Home prices YoY
- -18.9%
- Rents YoY
- 8.2%
- Active inventory
- 197
- Price-to-rent
- 8.8×
Monthly cashflow live
- Estimated rent
- $1,609 high interval (Pro) →
- Mortgage (P&I)
- −$891
- Tax from tax record
- −$41 /mo · $495/yr
- Insurance
- −$71
- HOA
- −$0
- Vacancy / Maint / Mgmt
- −$338
- Net cashflow
- $268
Break-even live
UW: 25.0% down · 7.5% · 30yr · 1.5% tax · 5.0% vac · 8.0% maint · 8.0% mgmt
Financing live
Cash to close
- Down payment
- $42,475
- Closing costs
- $5,097
- Reserves months
- —
- Total cash needed
- —
Loan-product check · same deal, 3 products live
Conventional
25% down · 7.5% · 30yr
- Down + closing
- —
- Monthly P&I
- —
- Monthly cashflow
- —
- DSCR
- —
- Eligible?
- —
Personal DTI + credit; lowest rate.
DSCR
20% down · 8.5% · 30yr
- Down + closing
- —
- Monthly P&I
- —
- Monthly cashflow
- —
- DSCR
- —
- Eligible?
- —
No personal income docs; deal must DSCR.
Hard money
10% down · 12.0% · 12mo
- Down + closing
- —
- Monthly P&I
- —
- Monthly cashflow
- —
- DSCR
- —
- Eligible?
- —
Short-term bridge; refi at stabilization.
Rent comps 16 comps
| Address | Beds | Baths | Sqft | Rent | $/sqft | DOM | Units | Dist |
|---|---|---|---|---|---|---|---|---|
| 62 Seabrook St Buffalo, NY | 4.0 | 1.0 | 1300 | $2,000 | $1.54 | 1d | 1 | 0.04mi |
| 2075 Kenmore Ave Unit 611 Buffalo, NY | 2.0 | 2.0 | 981 | $1,950 | $1.99 | 1d | 1 | 0.25mi |
| 15 Beatrice Ave Buffalo, NY | 2.0 | 1.0 | 950 | $1,150 | $1.21 | 14d | 1 | 0.48mi |
| 134 Philadelphia St Buffalo, NY | 3.0 | 1.0 | 871 | $1,100 | $1.26 | 3d | 1 | 0.48mi |
| 158 Chadduck Ave Buffalo, NY | 4.0 | 1.0 | 1200 | $1,250 | $1.04 | 23d | 1 | 0.61mi |
| 480 W Hazeltine Ave Buffalo, NY | 3.0 | 1.0 | 989 | $1,900 | $1.92 | 23d | 1 | 0.62mi |
| 239 Crowley Ave Buffalo, NY | 2.0 | 1.0 | 966 | $1,025 | $1.06 | 3d | 1 | 0.76mi |
| 237 W Girard Blvd Buffalo, NY | 4.0 | 1.5 | 1329 | $4,000 | $3.01 | 23d | 1 | 1.03mi |
| 118 Rano St Buffalo, NY | 3.0 | 1.0 | 1050 | $1,200 | $1.14 | 21d | 1 | 1.07mi |
| 68 Laforce Pl Unit U Buffalo, NY | 2.0 | 1.0 | 900 | $1,099 | $1.22 | 43d | 1 | 1.15mi |
| 356 Hertel Ave Buffalo, NY | 2.0 | 1.5 | 800 | $2,300 | $2.88 | 2d | 1 | 1.23mi |
| 15 Ontario St Unit 1 Buffalo, NY | 3.0 | 1.0 | 1000 | $1,500 | $1.50 | 1d | 1 | 1.31mi |
| 52 Somerton Ave Unit Upper Buffalo, NY | 2.0 | 1.0 | 900 | $1,200 | $1.33 | 23d | 1 | 1.36mi |
| 36-46 Crowell Ct Unit 40 Tonawanda, NY | 3.0 | 1.0 | 1000 | $1,395 | $1.40 | 23d | 1 | 1.38mi |
| 3113 Delaware Ave Unit 1 Buffalo, NY | 2.0 | 1.0 | 1083 | $1,200 | $1.11 | 23d | 1 | 1.44mi |
| 49 Tulane Rd Buffalo, NY | 2.0 | 1.0 | 1100 | $1,600 | $1.45 | 17d | 1 | 1.44mi |
Listing history 4 events
-
2026-06-07statusdays on market $169,900 Pending 4 DOM
-
2026-06-03days on market $169,900 Active 2 DOM
-
2026-06-02remarks 699-char remark
-
2026-06-02$169,900 Active 1 DOM
ⓘ Source: listings_history table (triggers on properties + properties_extension) + one-shot
backfill from property_details.listing_events for pre-trigger history.
Tax reassessment forecast NY · Partial reset (capped growth)
- Current annual tax
- $495 · $41/mo
- Projected year-2 tax
- $1,683 · $140/mo
- Expected delta
- +$1,188/yr (+$99/mo · 239.8%)
ⓘ Screening estimate from a state-policy table — verify with the county assessor before closing.
Climate risk First Street
- Flood 1/10 Low FEMA zone X (unshaded) · 0% chance over 30 yrs
- Wildfire 1/10 Low
- Heat 3/10 Moderate 7 d/yr ≥93°F today · 15 d/yr by 30 yrs out
- Wind 1/10 Low
- Air quality 3/10 Moderate 3 unhealthy d/yr today · 4 by 30 yrs out
Nearby sold comps map
Loading sold comps map…
Walkable amenities ~0.75 mi
Loading nearby amenities…
Taxation est. · year 1
- Rental income
- $19,306
- − Mortgage interest
- −$9,517
- − Property taxes
- −$495
- − Insurance
- −$850
- − Repairs & maintenance
- −$1,544
- − Management
- −$1,544
- − Depreciation
- −$4,943
- Taxable income
- $412
- Est. tax owed @ 24.0%
- −$99
- After-tax cash flow
- $3,116/yr
For passive investors: Depreciation is non-cash, so a rental often shows a tax loss while cash-flowing — sheltering income. Rental losses are passive: they offset passive income freely, and up to $25,000/yr can offset ordinary (W-2) income if you actively participate and your MAGI is under $100k (phasing out to $0 by $150k); unused losses carry forward. On sale, claimed depreciation is recaptured at up to 25%, and gains may owe capital-gains tax (a 1031 exchange can defer both). Figures are a year-1 estimate at your 24.0% rate — not tax advice; consult a CPA.
Schools (NCES district)
- District
- Buffalo City School District
- NCES district ID
- 3605850
- Math proficiency
- 41% ▲ 11.00%
- Reading proficiency
- 40% ▲ 7.00%
- Median HH income
- $31,665
- Composite
- 33.17/100
- National rank
- #5544
- State rank
- #535 of 590 in NY
Livability — Buffalo
- Score
- 77/100
- State rank
- #195
- US rank
- #3011
Category grades
Schools grade is shown separately in the Schools card above.
Census & demographics
- Census place
- Buffalo, NY
- County
- Erie County · 714,559 people
- City population
- 440,021
- Metro
- Buffalo-Cheektowaga, NY
- Population (ZIP)
- 26,327
- Household income
- $39,753
- Rent vs Own
- Severe rent burden
- 2177.0
Population outlook (Erie County) Hauer SSP2
- Today (2025)
- 933,037 people
- By 2030
- 935,181 · +0.2%
- By 2040
- 928,531 · -0.5%
- By 2050
- 905,725 · -2.9%
- By 2075
- 834,037 · -10.6%
- By 2100
- 708,033 · -24.1%
Race, ethnicity, and origin ACS 2023
- Neighborhood character
- Highly diverse neighborhood (Simpson 0.74)
- Race & ethnicity
- White 40% Hispanic / Latino 23% Black 16% Asian 15% Two or more races 14%
- Hispanic origin (detail)
- Puerto Rican 18% Dominican 2%
- Common ancestry
- Romanian 8% Portuguese 1% Arab 1%
- Foreign-born
- 19% · Philippines, Canada, India
- Languages at home
- 65% English-only · Spanish 14% Other Asian/Pacific 10% Other Indo-European 5%
Political lean MEDSL · Erie
- 2024 margin
- Lean D (+9.7) · D 54.8% · R 45.2%
- 2008→2024 swing
- -7.9pp toward R · 2008: 17.5pp · 2024: 9.7pp
- All cycles
- 2024: D+9.7 2020: D+14.7 2016: D+4.8 2012: D+15.6 2008: D+17.5
Not yet ingested
- Civics
- —
Market trends
- HPI YoY
- ▼ -54.42%
- Current HPI
- 233.0902
- Rent YoY
- ▲ 8.19%
- Metro
- Buffalo-Cheektowaga, NY
- State GDP YoY
- ▲ 2.60%
- F500 in state
- 92
Industry mix (Fortune 500 HQ in NY)
| Industry | F500 HQs | Revenue |
|---|---|---|
| Financial Services | 10 | $950B |
|
||
| Consumer Goods | 9 | $162B |
|
||
| Insurance | 4 | $225B |
|
||
| Telecommunications | 2 | $144B |
|
||
| Pharmaceuticals | 2 | $112B |
|
||
| Media / Entertainment | 2 | $69B |
|
||
Price history
+239.8% since first listed4 events — show timeline
- 2026-06-01 Listed $169,900 WNYREIS
- 2014-12-05 Sold (MLS) $41,000 WNYREIS
- 2014-10-14 Listed $44,500 WNYREIS
- 2007-07-10 Sold (Public Records) $50,000 Public Records
Property tax history
+4.5%/yrLatest (2025): $495 · +10.5% YoY. Source: county tax records.
Cash-flow waterfall
monthlySold comps — $/sqft
last 12 mo · ≤1 miLoading sold comps…