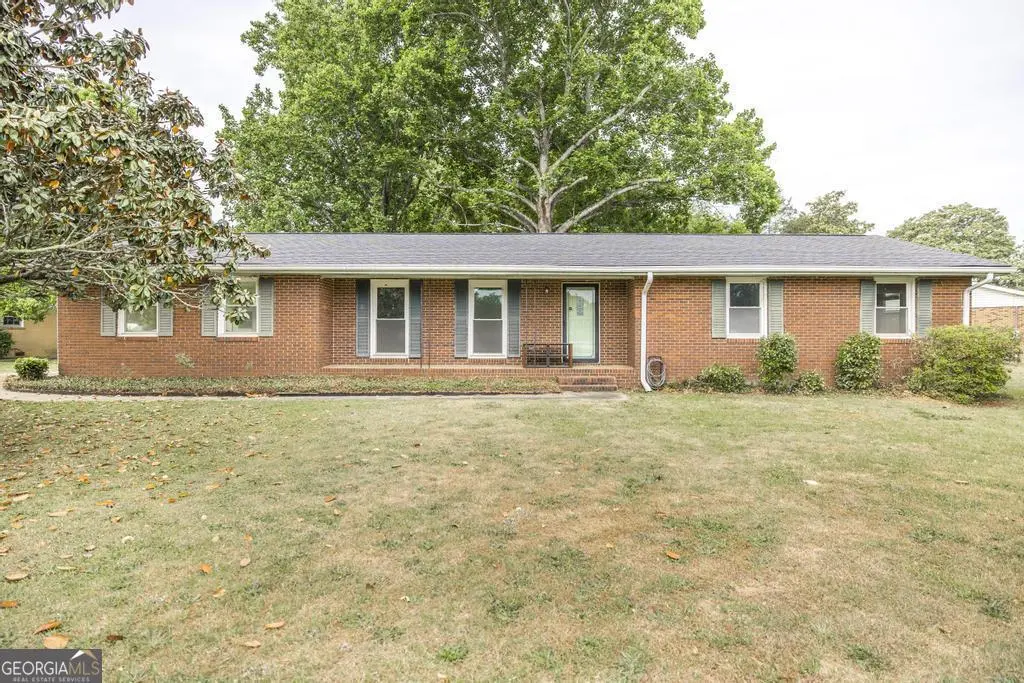
105 Auburn Dr · Warner Robins, GA
Flood risk No data
- FEMA flood zone
- —
- Chance of flooding over 30 yrs
- %
- Est. flood insurance / yr
- —
Fire risk No data
- Est. fire insurance / yr
- —
Heat risk No data
- Hot days now (above °F)
- days/yr
- Hot days in 30 yrs
- days/yr
Wind risk No data
- Chance of severe wind over 30 yrs
- %
Air-quality risk No data
- Unhealthy air days now
- days/yr
- Unhealthy air days in 30 yrs
- days/yr
Risk factors via First Street. Map © Google.
Why this score? — see what drove the C+ grade
The composite is a weighted blend of 9 inputs, each scored 0–100. Each bar is that input's sub-score; the figure is the points it added to the 100-point composite (weight × sub-score).
- Cash flow +21.4/30.0
- ARV discount +15.0/15.0
- DSCR +6.8/10.0
- 1% rule +5.6/10.0
- Schools +3.9/10.0
- Livability +3.2/5.0
- Rent growth +2.9/5.0
- Condition / age +2.5/5.0
- Appreciation +0.0/10.0
$150,000
🖨 Deal sheet 📄 Offer letter ✓ Due diligence
Listing remarks
Solid brick ranch situated on a spacious lot with mature trees and a fully usable backyard. This home offers a functional layout, covered front porch, carport, and a large covered back patio that's perfect for outdoor living and entertaining. Additional features include gutters, a storage building, and fenced backyard. Interior offers multiple living spaces, ample natural light, and a layout ready for your personal touch. Kitchen and baths are in original condition, providing an excellent opportunity for updates and customization. The roof is about a year old. Conveniently located near shopping, dining, and Robins AFB, this property presents a great opportunity for buyers looking to renovat
Key facts
- Covered front porch
- Carport
- Spacious lot
Tags
Neighborhood map
What this means for you Summary
Snapshot
- This is a 3-bed/2.0-bath single-family listed at $150k.
Deal economics
- At list price, monthly cash flow is $222 ($3k/yr) — positive.
- The deal already cash-flows at list — no discount required.
- Meets the 1% rule at list price ($2k rent vs $150k).
- Recommended offer: $148k (1.5% below list) — sets the bar for market timing.
- Cap rate 8.1% vs local median 4.9% in Warner Robins — top-decile yield for the area; either an underpriced asset or a hidden risk that comps aren't pricing in. Stress-test before assuming the spread holds.
Location & tenants
- Location reads 65/100 on livability (#227 in GA) — a middle-class / working-renter tenant base. Strengths: cost of living A+, housing A+, health & safety A+; Watch: schools D+, employment D+, crime F.
- Houston County (urban): math 43% / reading 46% proficiency, ranked #23 of 174 in GA (top 13%) — families likely to look elsewhere, expect single-tenant / working-renter base with shorter leases.
- Market conditions: Rents rising (+1.7%/yr); 286 active listings in the ZIP; 28 comparable units currently listed for rent nearby; rentals lingering (median 44d on market — plan ~5-8 weeks vacancy on turnover, expect pricing pressure); 50% of comp listings sitting > 30 days — soft ceiling on asking rent; solid renter incomes; 1,545 units permitted in Houston County in 2024 (336 in 5+ unit buildings).
Forward outlook
- Local home prices are declining (-3.0%/yr); year-one equity from $1k of loan paydown is wiped out by about $4k of value loss. Plan a longer hold.
- Houston County population projected at +22% by 2050 — long-run rental-demand tailwind backs the buy-and-hold thesis.
Negotiation context
- It's been on market 21 days — a 2% lower offer ($148k) is reasonable based on typical stale-listing flexibility.
Questions for the listing agent
- Built in 1968 — when were the roof, HVAC, electrical panel, plumbing, and water heater last replaced?
- Is there a deadline driving the sale (1031 exchange, divorce, estate, relocation)? That informs how much negotiation room exists.
- Schools are D-rated, which usually means shorter tenancies and higher turnover. Who's the typical renter profile here, and what's been the actual vacancy rate?
- Crime grade is F in this area — have there been break-ins, vandalism, or insurance claims at this property in the last 3 years? What carrier currently insures it and at what premium?
- What's the average days-on-market for RENTAL listings here right now (not sales)? A rising rental-DOM trend means longer vacancies and softer asking-rent achievability than the comps imply.
- What's the recent tenant-quality profile in this submarket — average credit score on applications, eviction rate, late-payment / NSF rate, and stable-employment percentage? A property-management company in the area should have these aggregated.
- How much new for-sale + rental construction is in the pipeline within 1–3 miles? Heavy new supply typically softens prices + rents 12–24 months out; constrained supply supports both.
Investment metrics
- 1% rule
- 1.06% ✓
- Cap rate
- 8.07%
- Cash-on-cash
- 6.33%
- DSCR
- 1.28
- GRM
- 7.8
CMA / ARV
- ARV (on-the-fly)
- $195,059
- Comps found
- 12
Show comp detail 12 sales within ~0.75 mi
| Address | Dist | Beds/Ba | Sqft | Sold | Price | $/sf | Match |
|---|---|---|---|---|---|---|---|
| 111 Avalon Dr | 0.30mi | 3/2.0 | 1,500 (+1%) | 7mo | $213,000 | $142 | 79 |
| 104 Fox Meadow Ct | 0.32mi | 3/2.0 | 1,428 (-4%) | 4mo | $199,000 | $139 | 75 |
| 200 Ridgeland Dr | 0.38mi | 3/2.0 | 1,505 (+1%) | 8mo | $184,000 | $122 | 74 |
| 410 Gawin Dr Dr | 0.64mi | 3/2.0 | 1,541 (+4%) | 0mo | $188,000 | $122 | 64 |
| 111 Oakridge Dr | 0.32mi | 3/2.0 | 1,334 (-10%) | 6mo | $175,000 | $131 | 62 |
| 208 Pellimore Dr | 0.47mi | 3/2.0 | 1,336 (-10%) | 1mo | $185,000 | $138 | 60 |
| 414 Forest Lake Dr | 0.69mi | 3/2.0 | 1,542 (+4%) | 3mo | $210,000 | $136 | 59 |
| 214 Camelot Pl | 0.51mi | 3/2.0 | 1,358 (-9%) | 3mo | $157,000 | $116 | 59 |
| 110 Brittany Ct | 0.48mi | 3/2.0 | 1,602 (+8%) | 8mo | $216,000 | $135 | 58 |
| 719 Meadowridge Dr | 0.47mi | 3/2.0 | 1,640 (+10%) | 5mo | $175,000 | $107 | 57 |
| 413 Sarah Dr | 0.68mi | 3/1.5 | 1,424 (-4%) | 4mo | $147,000 | $103 | 56 |
| 1716 Green Sts | 0.48mi | 3/2.0 | 1,686 (+13%) | 4mo | $220,000 | $130 | 52 |
Match score weights: distance 35% · size 25% · config 20% · recency 20%. Top-matched comps best support the ARV.
Projected returns pro-forma
-3.0% appreciation · 1.67% rent growth · sell at horizon
- IRR
- -8.0%
- Equity multiple
- 0.71×
- Total profit
- $-12,273
- Equity at exit
- $22,365
- IRR
- -0.3%
- Equity multiple
- 0.98×
- Total profit
- $-821
- Equity at exit
- $12,969
Cash invested: $42,000 (down + closing). Projections, not guarantees.
Landlord ↔ Tenant lean methodology
- Overall (STATE)
- 90 Strongly Landlord-Friendly
- State Georgia
- 90 Strongly Landlord-Friendly · R+3
- County
- — inherits STATE
- City
- — inherits STATE
ZIP-level market 31088
- Rents YoY
- 1.7%
- Active inventory
- 286
- Price-to-rent
- 7.8×
Monthly cashflow live
- Estimated rent
- $1,593 high interval (Pro) →
- Mortgage (P&I)
- −$787
- Tax est. 1.5%
- −$188 /mo · $2,250/yr
- Insurance
- −$62
- HOA
- −$0
- Vacancy / Maint / Mgmt
- −$334
- Net cashflow
- $222
Break-even live
UW: 25.0% down · 7.5% · 30yr · 1.5% tax · 5.0% vac · 8.0% maint · 8.0% mgmt
Financing live
Cash to close
- Down payment
- $37,500
- Closing costs
- $4,500
- Reserves months
- —
- Total cash needed
- —
Loan-product check · same deal, 3 products live
Conventional
25% down · 7.5% · 30yr
- Down + closing
- —
- Monthly P&I
- —
- Monthly cashflow
- —
- DSCR
- —
- Eligible?
- —
Personal DTI + credit; lowest rate.
DSCR
20% down · 8.5% · 30yr
- Down + closing
- —
- Monthly P&I
- —
- Monthly cashflow
- —
- DSCR
- —
- Eligible?
- —
No personal income docs; deal must DSCR.
Hard money
10% down · 12.0% · 12mo
- Down + closing
- —
- Monthly P&I
- —
- Monthly cashflow
- —
- DSCR
- —
- Eligible?
- —
Short-term bridge; refi at stabilization.
Rent comps 28 comps
| Address | Beds | Baths | Sqft | Rent | $/sqft | DOM | Units | Dist |
|---|---|---|---|---|---|---|---|---|
| 203 Lumpkin Dr Warner Robins, GA | 3.0 | 3.0 | 1700 | $2,200 | $1.29 | 43d | 1 | 0.64mi |
| 501 Pinecrest Dr Warner Robins, GA | 4.0 | 2.0 | 1818 | $2,100 | $1.16 | 43d | 1 | 0.72mi |
| 111 Marilyn Dr Warner Robins, GA | 3.0 | 1.0 | 912 | $1,250 | $1.37 | 43d | 1 | 0.76mi |
| 111 Marilyn Dr Warner Robins, GA | 3.0 | 1.0 | 912 | $1,175 | $1.29 | 21d | 1 | 0.76mi |
| 313 Westcliff Center St Warner Robins, GA | 2.0 | 2.0 | 1241 | $1,300 | $1.05 | 21d | 1 | 0.77mi |
| 313 Westcliff Center St Warner Robins, GA | 2.0 | 2.0 | 1241 | $1,300 | $1.05 | 43d | 1 | 0.77mi |
| 318 Bruce St Warner Robins, GA | 3.0 | 1.0 | 960 | $1,150 | $1.20 | 43d | 1 | 0.78mi |
| 646 Gawin Dr Warner Robins, GA | 2.0 | 1.5 | 1050 | $1,025 | $0.98 | 43d | 1 | 0.79mi |
| 111 Hawthorne Rd Warner Robins, GA | 3.0 | 2.0 | 1551 | $1,500 | $0.97 | 43d | 1 | 0.84mi |
| 208 Wray St Warner Robins, GA | 3.0 | 2.0 | 1509 | $1,700 | $1.13 | 13d | 1 | 0.85mi |
| 142 Hughes Dr Warner Robins, GA | 3.0 | 2.0 | 1503 | $1,745 | $1.16 | 13d | 1 | 0.86mi |
| 126 Hughes Dr Warner Robins, GA | 3.0 | 2.0 | 1508 | $1,845 | $1.22 | 43d | 1 | 0.93mi |
| 319 Orchard Ln Warner Robins, GA | 3.0 | 1.0 | 950 | $1,400 | $1.47 | 43d | 1 | 0.93mi |
| 106 Scarborough Rd Centerville, GA | 3.0 | 2.0 | 1471 | $1,400 | $0.95 | 21d | 1 | 0.99mi |
| 122 Briarwood Dr Warner Robins, GA | 4.0 | 2.0 | 1218 | $1,195 | $0.98 | 21d | 1 | 1.05mi |
| 124 Briarwood Dr Warner Robins, GA | 3.0 | 2.0 | 1134 | $1,500 | $1.32 | 43d | 1 | 1.06mi |
| 104 Woodcarver Trl Warner Robins, GA | 3.0 | 2.0 | 1300 | $1,600 | $1.23 | 13d | 1 | 1.06mi |
| 206 Northlake Dr Warner Robins, GA | 1.0–3.0 | 1.0–2.0 | 942 | $1,225 | $1.30 | 13d | 10 | 1.10mi |
| 600 Arizona Ave Warner Robins, GA | 1.0–3.0 | 1.0–1.5 | 912 | $1,100 | $1.21 | 13d | 29 | 1.21mi |
| 114 Dixie Trl Warner Robins, GA | 3.0 | 2.0 | 980 | $1,250 | $1.28 | 21d | 1 | 1.22mi |
| 310 Northlake Dr Warner Robins, GA | 1.0–2.0 | 1.0–1.5 | 825 | $1,250 | $1.52 | 13d | 23 | 1.25mi |
| 108 Stonefield Ct Warner Robins, GA | 3.0 | 2.0 | 1483 | $1,475 | $0.99 | 43d | 1 | 1.34mi |
| 302 Hawaii Ave Unit D Warner Robins, GA | 3.0 | 2.0 | 1190 | $1,500 | $1.26 | 13d | 1 | 1.34mi |
| 302 Hawaii Ave Unit C Warner Robins, GA | 2.0 | 1.0 | 981 | $1,200 | $1.22 | 13d | 1 | 1.34mi |
| 126 Jaybee Dr Warner Robins, GA | 3.0 | 2.0 | 1378 | $1,750 | $1.27 | 43d | 1 | 1.47mi |
| 700 Fieldstone Rd Warner Robins, GA | 3.0 | 2.0 | 1339 | $1,625 | $1.21 | 43d | 1 | 1.49mi |
| 111 Rainbow Ave Warner Robins, GA | 3.0 | 2.0 | 1422 | $1,695 | $1.19 | 21d | 1 | 1.49mi |
| 111 Rainbow Ave Warner Robins, GA | 3.0 | 2.0 | 1422 | $1,695 | $1.19 | 43d | 1 | 1.49mi |
Listing history 2 events
-
2026-06-19remarks 699-char remark
-
2026-06-19$150,000 Under Contract 21 DOM
ⓘ Source: listings_history table (triggers on properties + properties_extension) + one-shot
backfill from property_details.listing_events for pre-trigger history.
Nearby sold comps map
Loading sold comps map…
Walkable amenities ~0.75 mi
Loading nearby amenities…
Taxation est. · year 1
- Rental income
- $19,112
- − Mortgage interest
- −$8,402
- − Property taxes
- −$2,250
- − Insurance
- −$750
- − Repairs & maintenance
- −$1,529
- − Management
- −$1,529
- − Depreciation
- −$4,364
- Taxable income
- $288
- Est. tax owed @ 24.0%
- −$69
- After-tax cash flow
- $2,590/yr
For passive investors: Depreciation is non-cash, so a rental often shows a tax loss while cash-flowing — sheltering income. Rental losses are passive: they offset passive income freely, and up to $25,000/yr can offset ordinary (W-2) income if you actively participate and your MAGI is under $100k (phasing out to $0 by $150k); unused losses carry forward. On sale, claimed depreciation is recaptured at up to 25%, and gains may owe capital-gains tax (a 1031 exchange can defer both). Figures are a year-1 estimate at your 24.0% rate — not tax advice; consult a CPA.
Schools (NCES district)
- District
- Houston County
- NCES district ID
- 1302880
- Math proficiency
- 43% ▼ -7.00%
- Reading proficiency
- 46% ▼ -2.00%
- Median HH income
- $54,823
- Composite
- 38.68/100
- National rank
- #4144
- State rank
- #23 of 174 in GA
Livability — Warner Robins
- Score
- 65/100
- State rank
- #227
- US rank
- #13290
Category grades
Schools grade is shown separately in the Schools card above.
Census & demographics
- Census place
- Warner Robins, GA
- County
- Houston County · 157,321 people
- City population
- 92,102
- Metro
- Warner Robins, GA
- Population (ZIP)
- 58,585
- Household income
- $83,082
- Rent vs Own
- Severe rent burden
- 1668.0
Population outlook (Houston County) Hauer SSP2
- Today (2025)
- 169,502 people
- By 2030
- 178,486 · +5.3%
- By 2040
- 194,642 · +14.8%
- By 2050
- 207,119 · +22.2%
- By 2075
- 231,480 · +36.6%
- By 2100
- 235,034 · +38.7%
Race, ethnicity, and origin ACS 2023
- Neighborhood character
- Diverse neighborhood (Simpson 0.63)
- Race & ethnicity
- White 51% Black 32% Two or more races 9% Hispanic / Latino 7% Asian 4%
- Hispanic origin (detail)
- Mexican 4%
- Common ancestry
- Romanian 2% Slovak 2% Lithuanian 2%
- Foreign-born
- 9% · Canada, Vietnam, Jamaica
- Languages at home
- 90% English-only · Spanish 5% Other Asian/Pacific 2% Vietnamese 2%
Political lean MEDSL · Houston
- 2024 margin
- R (+11.3) · D 44.0% · R 55.3%
- 2008→2024 swing
- +8.9pp toward D · 2008: -20.2pp · 2024: -11.3pp
- All cycles
- 2024: R+11.3 2020: R+12.4 2016: R+21.6 2012: R+20.7 2008: R+20.2
Not yet ingested
- Civics
- —
Market trends
- HPI YoY
- ▼ -135.75%
- Current HPI
- 219.8261
- Rent YoY
- ▲ 1.67%
- Metro
- Warner Robins, GA
- State GDP YoY
- ▲ 2.66%
- F500 in state
- 28
Industry mix (Fortune 500 HQ in GA)
| Industry | F500 HQs | Revenue |
|---|---|---|
| Paper / Packaging | 2 | $29B |
|
||
| Retail | 1 | $160B |
|
||
| Transportation / Logistics | 1 | $91B |
|
||
| Airlines | 1 | $62B |
|
||
| Consumer Goods | 1 | $47B |
|
||
| Utilities | 1 | $25B |
|
||
Cash-flow waterfall
monthlySold comps — $/sqft
last 12 mo · ≤1 miLoading sold comps…