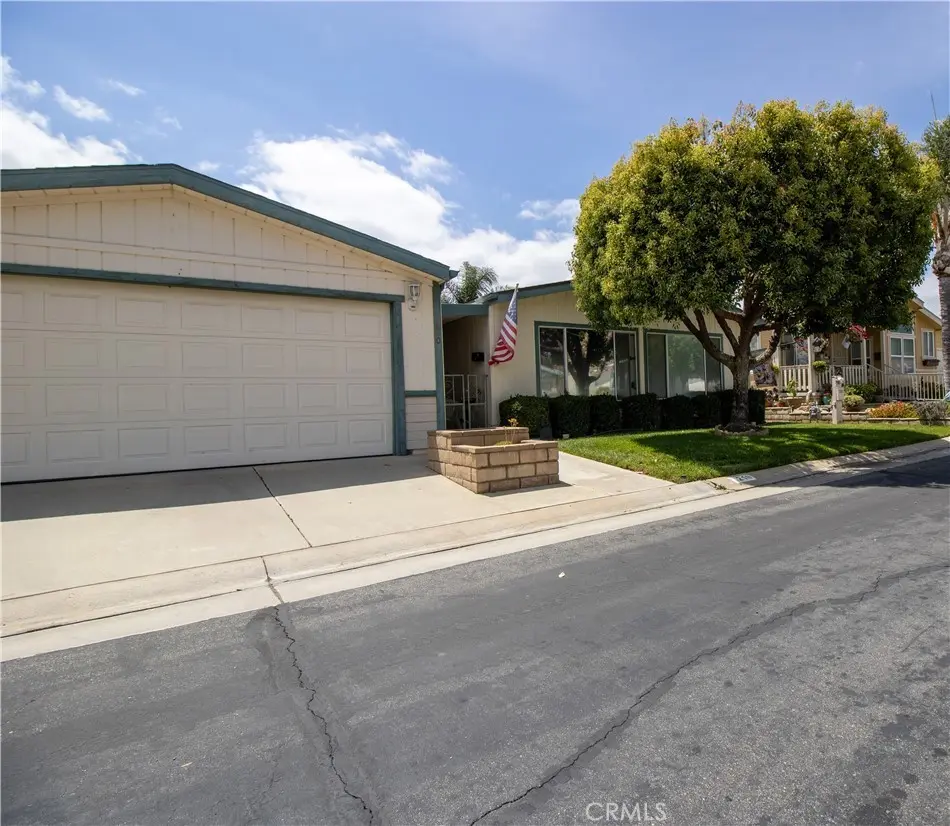
10961 Desert Lawn Dr (210 Vineyard) #210 · Calimesa, CA
Flood risk 1/10 · Minimal
- FEMA flood zone
- X (unshaded)
- Chance of flooding over 30 yrs
- 0.0%
- Est. flood insurance / yr
- $507 – $1,088
Fire risk 10/10 · Severe
- Est. fire insurance / yr
- $659 – $1,223
Heat risk 6/10 · Moderate
- Hot days now (above 101°F)
- 7 days/yr
- Hot days in 30 yrs
- 20 days/yr
Wind risk 1/10 · Minimal
- Chance of severe wind over 30 yrs
- —
Air-quality risk 10/10 · Severe
- Unhealthy air days now
- 34 days/yr
- Unhealthy air days in 30 yrs
- 40 days/yr
Risk factors via First Street. Map © Google.
Why this score? — see what drove the B- grade
The composite is a weighted blend of 9 inputs, each scored 0–100. Each bar is that input's sub-score; the figure is the points it added to the 100-point composite (weight × sub-score).
- Cash flow +30.0/30.0
- DSCR +10.0/10.0
- 1% rule +8.6/10.0
- ARV discount +5.7/15.0
- Schools +4.0/10.0
- Livability +2.8/5.0
- Rent growth +2.5/5.0
- Condition / age +2.5/5.0
- Appreciation +0.0/10.0
$169,000
🖨 Deal sheet 📄 Offer letter ✓ Due diligence
Listing remarks
Charming 2-Bedroom, 2-Bath Cottage in a Vibrant 55+ Community Step into this delightful 1,344 sq ft cottage-style home featuring 2 bedrooms and 2 bathrooms, perfectly designed for comfortable, low-maintenance retirement living. This warm and inviting residence boasts a beautiful brick fireplace as its centerpiece — ideal for cozy evenings and efficient winter heating. All appliances are included, so you can move in and start enjoying your new home right away, this property has a new roof and updated, like new water heater. . Outside, a lovely backyard offers a peaceful retreat for gardening, relaxing with morning coffee, or entertaining friends. Nestled in a friendly 55+ retirement c
Key facts
- Brick fireplace
- Lovely backyard
- Easy freeway access
Tags
Property features AI
Finance
- Other: Park name: Plantation on the Lake
- Financial info: Land lease of $972 per month (current)
- HOA & community: Senior community; Association amenities include pool, spa, clubhouse, gym/exercise room, billiard room, card room, pickleball, dog park, fire pit; pets permitted with rules and breed restrictions; Manager approval required
Exterior
- Parking: Attached 2-car garage; 2 total parking spaces; Located in Plantation on the Lake park
- Utilities: Public sewer; District/Public water
- Home design: Double-wide mobile home (12' x 56') remains on site; Single story
- Construction: Year built per public records
- Exterior features: No pool; Lot in 0–1 unit/acre range
Interior
- Bathrooms: 2 full bathrooms
- Interior features: One-level home; Single entry level
- Laundry & utility: Inside laundry room; Washer included; Dryer included; Washer hookup; Gas dryer hookup; Individual laundry room
Neighborhood map
What this means for you Summary
Snapshot
- This is a 2-bed/2.0-bath manufactured listed at $169k.
Deal economics
- At list price, monthly cash flow is $823 ($10k/yr) — positive.
- The deal already cash-flows at list — no discount required.
- Meets the 1% rule at list price ($2k rent vs $169k).
- Recommended offer: $166k (1.5% below list) — sets the bar for market timing.
- Cap rate 12.1% vs local median 6.7% in Calimesa — top-decile yield for the area; either an underpriced asset or a hidden risk that comps aren't pricing in. Stress-test before assuming the spread holds.
Location & tenants
- Location reads 55/100 on livability (#865 in CA) — a working-class tenant base; expect higher turnover. Strengths: housing A+, crime A-, employment B; Watch: health & safety D+, schools D, amenities F.
- Beaumont Unified (suburban): math 32% / reading 60% proficiency, ranked #168 of 517 in CA (top 32%) — families likely to look elsewhere, expect single-tenant / working-renter base with shorter leases.
- Market conditions: 67 active listings in the ZIP; 9,195 units permitted in Riverside County in 2024 (1,512 in 5+ unit buildings).
Forward outlook
- Local home prices are declining (-3.0%/yr); year-one equity from $1k of loan paydown is wiped out by about $5k of value loss. Plan a longer hold.
- Riverside County population projected at +22% by 2050 — long-run rental-demand tailwind backs the buy-and-hold thesis.
- At projected returns (-3.0% appreciation + 3.0% rent growth), your $47k cash investment doubles in ~6 years — after that, you're playing with house money.
Negotiation context
- It's been on market 22 days — a 2% lower offer ($166k) is reasonable based on typical stale-listing flexibility.
- 5 sale attempts since 18y ago with the ask held roughly flat each time — persistent listings suggest the price (not the market) is what's stuck; bring a comps-based counter.
Risks & watch-outs
- Climate carrying-cost: severe wildfire risk; extreme-heat days projected 7→20/yr by 2055 (HVAC capex compounding) — expect insurance premiums to compound above CPI over the hold.
Questions for the listing agent
- Is there a deadline driving the sale (1031 exchange, divorce, estate, relocation)? That informs how much negotiation room exists.
- Schools are D-rated, which usually means shorter tenancies and higher turnover. Who's the typical renter profile here, and what's been the actual vacancy rate?
- What's the average days-on-market for RENTAL listings here right now (not sales)? A rising rental-DOM trend means longer vacancies and softer asking-rent achievability than the comps imply.
- What's the recent tenant-quality profile in this submarket — average credit score on applications, eviction rate, late-payment / NSF rate, and stable-employment percentage? A property-management company in the area should have these aggregated.
- How much new for-sale + rental construction is in the pipeline within 1–3 miles? Heavy new supply typically softens prices + rents 12–24 months out; constrained supply supports both.
Investment metrics
- 1% rule
- 1.36% ✓
- Cap rate
- 12.13%
- Cash-on-cash
- 20.86%
- DSCR
- 1.93
- GRM
- 6.1
CMA / ARV
- ARV (on-the-fly)
- $162,624
- Comps found
- 12
Show comp detail 12 sales within ~0.75 mi
| Address | Dist | Beds/Ba | Sqft | Sold | Price | $/sf | Match |
|---|---|---|---|---|---|---|---|
| 10961 Desert Lawn Dr #19 | 0.00mi | 2/2.0 | 1,344 (0%) | 8mo | $130,000 | $97 | 93 |
| 10961 Desert Lawn Dr #3 | 0.00mi | 2/2.0 | 1,344 (0%) | 8mo | $142,000 | $106 | 93 |
| 10961 Desert Lawn Dr #181 | 0.00mi | 2/2.0 | 1,344 (0%) | 11mo | $100,000 | $74 | 90 |
| 10961 Desert Lawn Dr #116 | 0.00mi | 2/2.0 | 1,344 (0%) | 12mo | $82,500 | $61 | 90 |
| 10961 Desert Lawn Dr #44 | 0.00mi | 2/2.0 | 1,344 (0%) | 14mo | $149,000 | $111 | 88 |
| 10961 Desert Lawn Dr #162 | 0.00mi | 2/2.0 | 1,440 (+7%) | 1mo | $120,000 | $83 | 87 |
| 10961 Desert Lawn Dr #59 | 0.00mi | 2/2.0 | 1,344 (0%) | 16mo | $196,500 | $146 | 86 |
| 10961 Desert Lawn Dr #329 | 0.00mi | 2/2.0 | 1,380 (+3%) | 14mo | $275,000 | $199 | 84 |
| 10961 Desert Lawn Dr #202 | 0.00mi | 2/2.0 | 1,440 (+7%) | 13mo | $175,000 | $122 | 77 |
| 10961 Desert Lawn Dr #96 | 0.28mi | 2/2.0 | 1,280 (-5%) | 14mo | $185,000 | $145 | 67 |
| 10961 Desert Lawn Dr #479 | 0.00mi | 2/2.0 | 1,508 (+12%) | 15mo | $240,000 | $159 | 67 |
| 10961 Desert Lawn Dr #135 | 0.00mi | 2/2.0 | 1,532 (+14%) | 16mo | $185,000 | $121 | 63 |
Match score weights: distance 35% · size 25% · config 20% · recency 20%. Top-matched comps best support the ARV.
Projected returns pro-forma
-3.0% appreciation · 3.0% rent growth · sell at horizon
- IRR
- 13.2%
- Equity multiple
- 1.53×
- Total profit
- $24,937
- Equity at exit
- $25,198
- IRR
- 22.1%
- Equity multiple
- 2.88×
- Total profit
- $88,892
- Equity at exit
- $14,612
Cash invested: $47,320 (down + closing). Projections, not guarantees.
Landlord ↔ Tenant lean methodology
- Overall (STATE)
- 18 Strongly Tenant-Friendly
- State California
- 18 Strongly Tenant-Friendly · D+13
- County
- — inherits STATE
- City
- — inherits STATE
ZIP-level market 92320
- Home prices YoY
- -22.2%
- Active inventory
- 67
- Price-to-rent
- 6.1×
Monthly cashflow live
- Estimated rent
- $2,302 medium interval (Pro) →
- Mortgage (P&I)
- −$886
- Tax from tax record
- −$39 /mo · $470/yr
- Insurance
- −$70
- HOA
- −$0
- Vacancy / Maint / Mgmt
- −$483
- Net cashflow
- $823
Break-even live
UW: 25.0% down · 7.5% · 30yr · 1.5% tax · 5.0% vac · 8.0% maint · 8.0% mgmt
Financing live
Cash to close
- Down payment
- $42,250
- Closing costs
- $5,070
- Reserves months
- —
- Total cash needed
- —
Loan-product check · same deal, 3 products live
Conventional
25% down · 7.5% · 30yr
- Down + closing
- —
- Monthly P&I
- —
- Monthly cashflow
- —
- DSCR
- —
- Eligible?
- —
Personal DTI + credit; lowest rate.
DSCR
20% down · 8.5% · 30yr
- Down + closing
- —
- Monthly P&I
- —
- Monthly cashflow
- —
- DSCR
- —
- Eligible?
- —
No personal income docs; deal must DSCR.
Hard money
10% down · 12.0% · 12mo
- Down + closing
- —
- Monthly P&I
- —
- Monthly cashflow
- —
- DSCR
- —
- Eligible?
- —
Short-term bridge; refi at stabilization.
Listing history 29 events
-
2026-06-18days on market $169,000 Active 22 DOM
-
2026-06-17days on market $169,000 Active 21 DOM
-
2026-06-16days on market $169,000 Active 20 DOM
-
2026-06-15days on market $169,000 Active 19 DOM
-
2026-06-13days on market $169,000 Active 17 DOM
-
2026-06-13days on market $169,000 Active 16 DOM
-
2026-06-09days on market $169,000 Active 13 DOM
-
2026-06-08days on market $169,000 Active 12 DOM
-
2026-06-07days on market $169,000 Active 11 DOM
-
2026-06-04days on market $169,000 Active 8 DOM
-
2026-06-03days on market $169,000 Active 7 DOM
-
2026-06-02days on market $169,000 Active 6 DOM
-
2026-06-01days on market $169,000 Active 5 DOM
-
2026-05-31days on market $169,000 Active 4 DOM
-
2026-05-27$169,000 Active
-
2015-03-28historical
-
2014-05-16price $85,000
-
2014-05-16price $79,000
-
2014-04-27price $80,000
-
2014-04-15price $85,000
-
2014-03-27$90,000 Active
-
2010-07-08historical
-
2010-04-08price $74,900
-
2009-11-19historical
-
2009-11-19price $84,900
-
2009-10-21$84,900 Active
-
2009-10-16$89,950 Active
-
2009-02-27historical
-
2008-11-05$129,900
ⓘ Source: listings_history table (triggers on properties + properties_extension) + one-shot
backfill from property_details.listing_events for pre-trigger history.
Tax reassessment forecast CA · Resets to sale price
- Current annual tax
- $470 · $39/mo
- Projected year-2 tax
- $1,284 · $107/mo
- Expected delta
- +$814/yr (+$68/mo · 173.1%)
ⓘ Screening estimate from a state-policy table — verify with the county assessor before closing.
Climate risk First Street
- Flood 1/10 Low FEMA zone X (unshaded) · 0% chance over 30 yrs
- Wildfire 10/10 Extreme
- Heat 6/10 Major 7 d/yr ≥101°F today · 20 d/yr by 30 yrs out
- Wind 1/10 Low
- Air quality 10/10 Extreme 34 unhealthy d/yr today · 40 by 30 yrs out
Nearby sold comps map
Loading sold comps map…
Walkable amenities ~0.75 mi
Loading nearby amenities…
Taxation est. · year 1
- Rental income
- $27,623
- − Mortgage interest
- −$9,467
- − Property taxes
- −$470
- − Insurance
- −$845
- − Repairs & maintenance
- −$2,210
- − Management
- −$2,210
- − Depreciation
- −$4,916
- Taxable income
- $7,505
- Est. tax owed @ 24.0%
- −$1,801
- After-tax cash flow
- $8,070/yr
For passive investors: Depreciation is non-cash, so a rental often shows a tax loss while cash-flowing — sheltering income. Rental losses are passive: they offset passive income freely, and up to $25,000/yr can offset ordinary (W-2) income if you actively participate and your MAGI is under $100k (phasing out to $0 by $150k); unused losses carry forward. On sale, claimed depreciation is recaptured at up to 25%, and gains may owe capital-gains tax (a 1031 exchange can defer both). Figures are a year-1 estimate at your 24.0% rate — not tax advice; consult a CPA.
Schools (NCES district)
- District
- Beaumont Unified
- NCES district ID
- 0604290
- Math proficiency
- 32% ▼ -4.00%
- Reading proficiency
- 60% ▲ 11.00%
- Median HH income
- $60,635
- Composite
- 40.37/100
- National rank
- #3736
- State rank
- #168 of 517 in CA
Livability — Calimesa
- Score
- 55/100
- State rank
- #865
- US rank
- #23579
Category grades
Schools grade is shown separately in the Schools card above.
Census & demographics
- Census place
- Calimesa, CA
- City population
- 10,680
- Population (ZIP)
- 10,680
Population outlook (Riverside County) Hauer SSP2
- Today (2025)
- 2,664,475 people
- By 2030
- 2,802,692 · +5.2%
- By 2040
- 3,050,904 · +14.5%
- By 2050
- 3,256,783 · +22.2%
- By 2075
- 3,655,058 · +37.2%
- By 2100
- 3,766,594 · +41.4%
Race, ethnicity, and origin ACS 2023
- Neighborhood character
- Diverse neighborhood (Simpson 0.57)
- Race & ethnicity
- White 57% Hispanic / Latino 31% Two or more races 12% Asian 3% Black 3% Native American 1%
- Hispanic origin (detail)
- Mexican 27%
- Common ancestry
- Italian 2% Slovak 1% Lithuanian 1%
- Foreign-born
- 7% · Canada
- Languages at home
- 85% English-only · Spanish 12% Tagalog/Filipino 2%
Political lean MEDSL · Riverside
- 2024 margin
- Toss-up / Even · D 48.0% · R 49.3% · Other 2.6%
- 2008→2024 swing
- -3.6pp toward R · 2008: 2.3pp · 2024: -1.3pp
- All cycles
- 2024: R+1.3 2020: D+8.0 2016: D+4.3 2012: R+0.4 2008: D+2.3
Not yet ingested
- Civics
- —
Market trends
- HPI YoY
- ▼ -104.13%
- Current HPI
- 364.3627
- Rent YoY
- —
- Metro
- —
- State GDP YoY
- ▲ 3.21%
- F500 in state
- 116
Industry mix (Fortune 500 HQ in CA)
| Industry | F500 HQs | Revenue |
|---|---|---|
| Technology | 27 | $1,492B |
|
||
| Financial Services | 3 | $174B |
|
||
| Retail | 3 | $44B |
|
||
| Insurance | 3 | $26B |
|
||
| Media / Entertainment | 2 | $115B |
|
||
| Pharmaceuticals / Biotech | 2 | $62B |
|
||
Price history
+30.1% since first listed15 events — show timeline
- 2026-05-27 Listed $169,000 CRMLS
- 2015-03-28 Listing Removed — CRMLS
- 2014-05-16 Price Changed $79,000 CRMLS
- 2014-05-16 Price Changed $85,000 CRMLS
- 2014-04-27 Price Changed $80,000 CRMLS
- 2014-04-15 Price Changed $85,000 CRMLS
- 2014-03-27 Listed $90,000 CRMLS
- 2010-07-08 Listing Removed — CRMLS
- 2010-04-08 Price Changed $74,900 CRMLS
- 2009-11-19 Listing Removed — CRMLS
- 2009-11-19 Price Changed $84,900 CRMLS
- 2009-10-21 Listed $84,900 CRMLS
- 2009-10-16 Listed $89,950 CRMLS
- 2009-02-27 Listing Removed — CRMLS
- 2008-11-05 Listed $129,900 CRMLS
Property tax history
-5.9%/yrLatest (2025): $470 · +2.0% YoY. Source: county tax records.
Cash-flow waterfall
monthlySold comps — $/sqft
last 12 mo · ≤1 miLoading sold comps…