 🏷️ Likely Rental
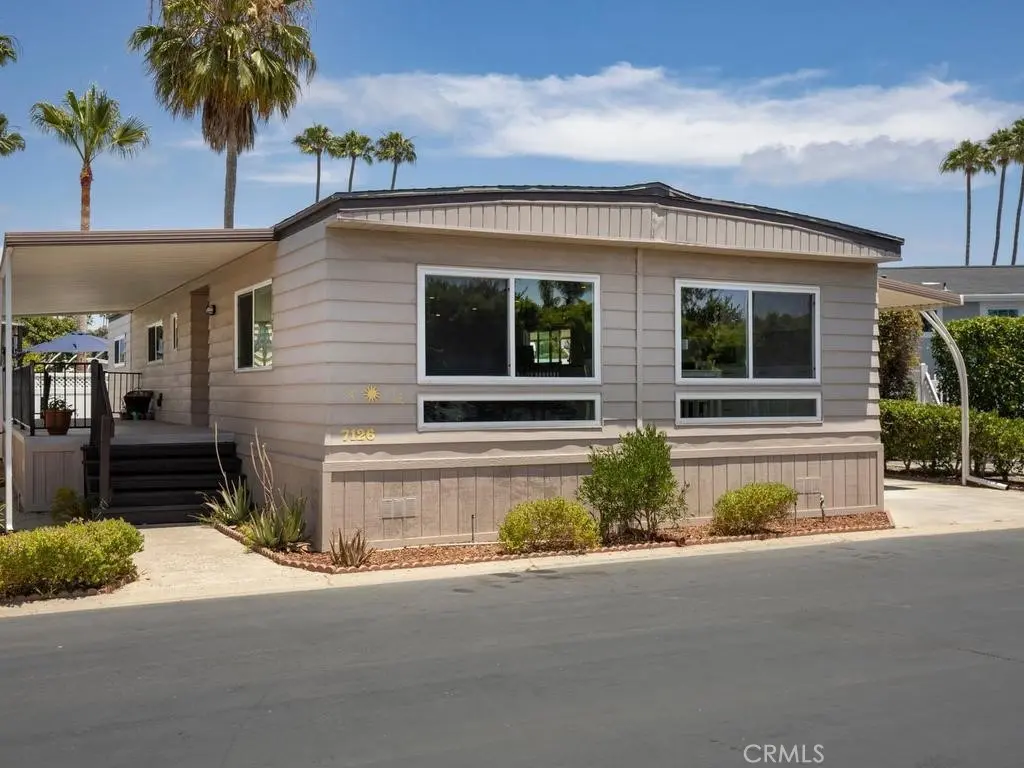
7126 San Luis St #121 · Carlsbad, CA
Flood risk 1/10 · Minimal
- FEMA flood zone
- X (unshaded)
- Chance of flooding over 30 yrs
- 0.0%
- Est. flood insurance / yr
- $507 – $1,088
Fire risk 1/10 · Minimal
- Est. fire insurance / yr
- $659 – $1,223
Heat risk 5/10 · Moderate
- Hot days now (above 82°F)
- 7 days/yr
- Hot days in 30 yrs
- 19 days/yr
Wind risk 1/10 · Minimal
- Chance of severe wind over 30 yrs
- —
Air-quality risk 3/10 · Minor
- Unhealthy air days now
- 4 days/yr
- Unhealthy air days in 30 yrs
- 4 days/yr
Risk factors via First Street. Map © Google.
Why this score? — see what drove the B+ grade
The composite is a weighted blend of 9 inputs, each scored 0–100. Each bar is that input's sub-score; the figure is the points it added to the 100-point composite (weight × sub-score).
- Cash flow +30.0/30.0
- 1% rule +10.0/10.0
- DSCR +10.0/10.0
- ARV discount +7.5/15.0
- Schools +6.5/10.0
- Appreciation +5.9/10.0
- Livability +3.9/5.0
- Rent growth +3.4/5.0
- Condition / age +2.5/5.0
$160,000
🖨 Deal sheet 📄 Offer letter ✓ Due diligence
Listing remarks MLS
Lowest space rent in the park! $1,350 per month. Beautiful sunset views from the dual pane picture windows in the Living and Dining Rooms. Lots and lots of built-in cabinets and storage. Tile in the Dining Room, Kitchen and Bathrooms. Home Office off the Family Room. No neighbors in front of your home. 7X17 enclosed patio off the front porch. This home is convenient and comfortable and well located in Lakeshore Gardens – "Paradise Near the Beach" Lakeshore Gardens is close to the beach and shopping. Neighborhoods: Lakeshore Gardens Complex Features: , ,, ,, ,, ,, , Equipment: Dryer, Range/Oven, Shed(s), Washer Other Fees: 0 Sewer: Sewer Connected Topography: LL
Key facts
- Large center island
- Remodeled kitchen
- Abundant cabinetry
Tags
Property features AI
Finance
- Other: Park name: Lakeshore Gardens; Community features include biking
- Financial info: Land lease applies
- HOA & community: Senior community; Onsite property management; Clubhouse; Pool; Spa; Gym/exercise room; Billiard room; Card room; Meeting/banquet facilities; Outdoor cooking area / barbecue; Fire pit; Common RV parking; Security; Pets permitted (with pet rules); Manager approval required
Exterior
- Parking: Attached carport; Carport fits 2 vehicles; Has parking
- Security: Automatic gate; Gated community; Smoke detector; Carbon monoxide detector
- Utilities: District/public water; Public sewer; Natural gas connected; Electricity connected; Underground utilities
- Home design: Mobile home (24' x 60') remains on site; Double body type (multi-unit/mobile setting); Single-story; Entry level: 1; Facing south
- Construction: Wood skirting
- Exterior features: Covered front porch; Patio; In-ground community pool; Wood skirting; Vinyl fencing; Shed (1); Landscaped yard; Garden; Back yard; Lot is level/flat; Maintained, paved road access; South-facing
Interior
- Kitchen: Kitchen island; Built-in trash/recycling; Gas cooktop; Gas oven; Microwave; Refrigerator; Dishwasher; Gas water heater
- Bedrooms: All bedrooms on the main level
- Flooring: Tile flooring; Laminate flooring
- Bathrooms: One full bathroom; One three-quarter bathroom; Master bath with double sinks; Walk-in shower; Low-flow toilets; Shower
- Heating & cooling: Forced air heating (natural gas); Central air conditioning
- Interior features: Ceiling fan; Storage space; Panel doors; Double pane windows; No interior steps; Doors swing inward; One-level home; Entry on north side; Turnkey condition; Community spa
- Laundry & utility: Laundry room inside; Gas dryer hookup; 220V outlet in laundry; Utility room
Neighborhood map
What this means for you Summary
Snapshot
- This is a 2-bed/2.0-bath manufactured listed at $160k.
Deal economics
- At list price, monthly cash flow is $2k ($30k/yr) — positive.
- The deal already cash-flows at list — no discount required.
- Meets the 1% rule at list price ($5k rent vs $160k).
- Cap rate 24.9% vs local median 2.1% in Carlsbad — top-decile yield for the area; either an underpriced asset or a hidden risk that comps aren't pricing in. Stress-test before assuming the spread holds.
Location & tenants
- Location reads 78/100 on livability (#67 in CA, #2,526 nationally) — a middle-class / working-renter tenant base. Strengths: schools A+, amenities A+, commute A+; Watch: health & safety D+, cost of living F.
- Carlsbad Unified (urban): math 68% / reading 76% proficiency, ranked #87 of 1,400 in CA (top 6%) — strong family-tenant draw, lease renewals of 3-5y typical; only 18% free/reduced lunch — higher-income household profile.
- Market conditions: Rents rising (+3.5%/yr); 96 active listings in the ZIP; 17 comparable units currently listed for rent nearby; rentals lingering (median 44d on market — plan ~5-8 weeks vacancy on turnover, expect pricing pressure); 53% of comp listings sitting > 30 days — soft ceiling on asking rent; high-income renter base; 11,759 units permitted in San Diego County in 2024 (7,244 in 5+ unit buildings).
- This rent runs 34% of the median local income ($159k/yr) — at the standard rent-burdened threshold; future hikes will face affordability resistance.
Forward outlook
- In year one you build about $4k of equity ($1k loan paydown + $3k appreciation (1.8% local appreciation)).
- San Diego County population projected at +20% by 2050 — long-run rental-demand tailwind backs the buy-and-hold thesis.
- At projected returns (1.8% appreciation + 3.5% rent growth), your $45k cash investment doubles in ~2 years — after that, you're playing with house money.
- By year 9, paydown + projected appreciation supports a ~$34k cash-out refi (75% LTV) — recoverable capital for the next deal without selling this one.
Negotiation context
- Only 7 days on market — expect competitive offers; lowballing is unlikely to land.
- 3 sale attempts since 11y ago with the ask held roughly flat each time — persistent listings suggest the price (not the market) is what's stuck; bring a comps-based counter.
- Current owner paid $92k; list at $160k implies a 73% gain — meaningful room to come down on a strong offer.
Risks & watch-outs
- Climate carrying-cost: extreme-heat days projected 7→19/yr by 2055 (HVAC capex compounding) — expect insurance premiums to compound above CPI over the hold.
Questions for the listing agent
- Built in 1972 — when were the roof, HVAC, electrical panel, plumbing, and water heater last replaced?
- Is there a deadline driving the sale (1031 exchange, divorce, estate, relocation)? That informs how much negotiation room exists.
- Schools are A-rated — typically a magnet for longer-tenancy family renters. What's the average tenant stay here, and is there a school-zone premium baked into asking?
- What's the average days-on-market for RENTAL listings here right now (not sales)? A rising rental-DOM trend means longer vacancies and softer asking-rent achievability than the comps imply.
- What's the recent tenant-quality profile in this submarket — average credit score on applications, eviction rate, late-payment / NSF rate, and stable-employment percentage? A property-management company in the area should have these aggregated.
- How much new for-sale + rental construction is in the pipeline within 1–3 miles? Heavy new supply typically softens prices + rents 12–24 months out; constrained supply supports both.
Investment metrics
- 1% rule
- 2.84% ✓
- Cap rate
- 24.95%
- Cash-on-cash
- 66.62%
- DSCR
- 3.96
- GRM
- 2.9
CMA / ARV
- ARV (on-the-fly)
- $360,000
- Comps found
- 12
Show comp detail 12 sales within ~0.75 mi
| Address | Dist | Beds/Ba | Sqft | Sold | Price | $/sf | Match |
|---|---|---|---|---|---|---|---|
| 7018 San Carlos St #60 | 0.07mi | 2/2.0 | 1,440 (0%) | 6mo | $392,000 | $272 | 92 |
| 7140 Santa Rosa St | 0.13mi | 2/2.0 | 1,440 (0%) | 6mo | $191,000 | $133 | 89 |
| 7106 Santa Cruz #56 | 0.13mi | 2/2.0 | 1,464 (+2%) | 9mo | $390,000 | $266 | 84 |
| 7217 San Luis St #173 | 0.17mi | 2/2.0 | 1,440 (0%) | 10mo | $280,000 | $194 | 84 |
| 7024 San Bartolo Unit 19 A | 0.10mi | 3/2.0 (+1) | 1,544 (+7%) | 2mo | $425,000 | $275 | 76 |
| 7203 San Luis St #166 | 0.11mi | 2/2.5 | 1,536 (+7%) | 9mo | $375,000 | $244 | 74 |
| 7318 San Luis St | 0.47mi | 2/2.0 | 1,440 (0%) | 9mo | $285,000 | $198 | 70 |
| 7304 Santa Barbara St #325 | 0.33mi | 2/2.0 | 1,512 (+5%) | 9mo | $481,000 | $318 | 69 |
| 7311 San Luis St #237 | 0.45mi | 3/2.0 (+1) | 1,359 (-6%) | 1mo | $236,550 | $174 | 64 |
| 7224 San Benito St | 0.23mi | 2/2.0 | 1,600 (+11%) | 9mo | $400,000 | $250 | 64 |
| 7243 San Luis St #257 | 0.31mi | 2/2.0 | 1,248 (-13%) | 2mo | $120,000 | $96 | 62 |
| 7313 San Luis St #236 | 0.42mi | 3/2.0 (+1) | 1,548 (+8%) | 5mo | $450,000 | $291 | 59 |
Match score weights: distance 35% · size 25% · config 20% · recency 20%. Top-matched comps best support the ARV.
Projected returns pro-forma
1.75% appreciation · 3.54% rent growth · sell at horizon
- IRR
- 70.7%
- Equity multiple
- 4.79×
- Total profit
- $169,890
- Equity at exit
- $60,944
- IRR
- 71.4%
- Equity multiple
- 9.93×
- Total profit
- $400,088
- Equity at exit
- $86,127
Cash invested: $44,800 (down + closing). Projections, not guarantees.
Landlord ↔ Tenant lean methodology
- Overall (STATE)
- 18 Strongly Tenant-Friendly
- State California
- 18 Strongly Tenant-Friendly · D+13
- County
- — inherits STATE
- City
- — inherits STATE
ZIP-level market 92011
- Home prices YoY
- 0.4%
- Rents YoY
- 3.5%
- Active inventory
- 96
- Price-to-rent
- 2.9×
Monthly cashflow live
- Estimated rent
- $4,548 high interval (Pro) →
- Mortgage (P&I)
- −$839
- Tax est. 1.5%
- −$200 /mo · $2,400/yr
- Insurance
- −$67
- HOA
- −$0
- Vacancy / Maint / Mgmt
- −$955
- Net cashflow
- $2,487
Break-even live
UW: 25.0% down · 7.5% · 30yr · 1.5% tax · 5.0% vac · 8.0% maint · 8.0% mgmt
Financing live
Cash to close
- Down payment
- $40,000
- Closing costs
- $4,800
- Reserves months
- —
- Total cash needed
- —
Loan-product check · same deal, 3 products live
Conventional
25% down · 7.5% · 30yr
- Down + closing
- —
- Monthly P&I
- —
- Monthly cashflow
- —
- DSCR
- —
- Eligible?
- —
Personal DTI + credit; lowest rate.
DSCR
20% down · 8.5% · 30yr
- Down + closing
- —
- Monthly P&I
- —
- Monthly cashflow
- —
- DSCR
- —
- Eligible?
- —
No personal income docs; deal must DSCR.
Hard money
10% down · 12.0% · 12mo
- Down + closing
- —
- Monthly P&I
- —
- Monthly cashflow
- —
- DSCR
- —
- Eligible?
- —
Short-term bridge; refi at stabilization.
Rent comps 17 comps
| Address | Beds | Baths | Sqft | Rent | $/sqft | DOM | Units | Dist |
|---|---|---|---|---|---|---|---|---|
| 6923 Whitecap Dr Carlsbad, CA | 3.0 | 2.0 | 1246 | $5,250 | $4.21 | 43d | 1 | 0.45mi |
| 820 Windcrest Dr Carlsbad, CA | 3.0 | 2.0 | 1404 | $5,581 | $3.98 | 18d | 1 | 0.59mi |
| 6790 Embarcadero Ln Carlsbad, CA | 1.0–2.0 | 2.0–2.5 | 2104 | $5,750 | $2.73 | 5d | 1 | 0.64mi |
| 6938 Seascape Dr Carlsbad, CA | 1.0–2.0 | 1.0–2.0 | 810 | $3,775 | $4.66 | 3d | 9 | 0.66mi |
| 6910 Peachtree Rd Unit 1546353P Carlsbad, CA | 3.0 | 2.0 | 1399 | $6,129 | $4.38 | 16d | 1 | 0.77mi |
| 6811 Alderwood Dr Carlsbad, CA | 2.0 | 2.0 | 1292 | $3,850 | $2.98 | 43d | 1 | 0.84mi |
| 916 Caminito Estrada Unit B Carlsbad, CA | 2.0 | 2.0 | 1188 | $3,650 | $3.07 | 43d | 1 | 0.93mi |
| 902 Caminito Madrigal Unit B Carlsbad, CA | 2.0 | 1.0 | 897 | $3,200 | $3.57 | 10d | 1 | 0.96mi |
| 6675 Paseo del Norte Unit B Carlsbad, CA | 2.0 | 2.0 | 959 | $4,300 | $4.48 | 43d | 1 | 0.97mi |
| 6675 Paseo del Norte Unit A Carlsbad, CA | 2.0 | 2.0 | 959 | $3,850 | $4.01 | 5d | 1 | 0.97mi |
| 6677 Paseo Del Norte Carlsbad, CA | 2.0 | 2.0 | 959 | $4,500 | $4.69 | 43d | 1 | 0.97mi |
| 6677 Paseo del Norte Unit B Carlsbad, CA | 2.0 | 1.0 | 959 | $3,950 | $4.12 | 43d | 1 | 0.97mi |
| 908 Caminito Madrigal Carlsbad, CA | 2.0 | 2.0 | 897 | $4,500 | $5.02 | 43d | 1 | 1.01mi |
| 908 Caminito Madrigal Unit D Carlsbad, CA | 2.0 | 1.5 | 897 | $4,500 | $5.02 | 43d | 1 | 1.03mi |
| 925 Wind Drift Dr Carlsbad, CA | 2.0 | 2.5 | 1110 | $3,895 | $3.51 | 43d | 1 | 1.09mi |
| 6555 Sea Gate Rd Carlsbad, CA | 2.0 | 2.0 | 1114 | $4,095 | $3.67 | 1d | 3 | 1.12mi |
| 1967 N Vulcan Ave Encinitas, CA | 1.0–2.0 | 1.0–2.0 | 929 | $5,359 | $5.77 | 1d | 7 | 1.36mi |
Listing history 7 events
-
2026-06-18days on market $160,000 Active 7 DOM
-
2026-06-17days on market $160,000 Active 6 DOM
-
2026-06-16days on market $160,000 Active 5 DOM
-
2026-06-15days on market $160,000 Active 4 DOM
-
2026-06-13days on market $160,000 Active 2 DOM
-
2026-06-13remarks 693-char remark
-
2026-06-13$160,000 Active 1 DOM
ⓘ Source: listings_history table (triggers on properties + properties_extension) + one-shot
backfill from property_details.listing_events for pre-trigger history.
Climate risk First Street
- Flood 1/10 Low FEMA zone X (unshaded) · 0% chance over 30 yrs
- Wildfire 1/10 Low
- Heat 5/10 Major 7 d/yr ≥82°F today · 19 d/yr by 30 yrs out
- Wind 1/10 Low
- Air quality 3/10 Moderate 4 unhealthy d/yr today · 4 by 30 yrs out
Nearby sold comps map
Loading sold comps map…
Walkable amenities ~0.75 mi
Loading nearby amenities…
Taxation est. · year 1
- Rental income
- $54,574
- − Mortgage interest
- −$8,962
- − Property taxes
- −$2,400
- − Insurance
- −$800
- − Repairs & maintenance
- −$4,366
- − Management
- −$4,366
- − Depreciation
- −$4,655
- Taxable income
- $29,025
- Est. tax owed @ 24.0%
- −$6,966
- After-tax cash flow
- $22,879/yr
For passive investors: Depreciation is non-cash, so a rental often shows a tax loss while cash-flowing — sheltering income. Rental losses are passive: they offset passive income freely, and up to $25,000/yr can offset ordinary (W-2) income if you actively participate and your MAGI is under $100k (phasing out to $0 by $150k); unused losses carry forward. On sale, claimed depreciation is recaptured at up to 25%, and gains may owe capital-gains tax (a 1031 exchange can defer both). Figures are a year-1 estimate at your 24.0% rate — not tax advice; consult a CPA.
Schools (NCES district)
- District
- Carlsbad Unified
- NCES district ID
- 0607500
- Math proficiency
- 68% ▲ 2.00%
- Reading proficiency
- 76% ▲ 2.00%
- Median HH income
- $81,200
- Composite
- 65.11/100
- National rank
- #1068
- State rank
- #87 of 1400 in CA
Livability — Carlsbad
- Score
- 78/100
- State rank
- #67
- US rank
- #2526
Category grades
Schools grade is shown separately in the Schools card above.
Census & demographics
- Census place
- Carlsbad, CA
- County
- San Diego County · 3,178,799 people
- City population
- 114,373
- Metro
- San Diego-Chula Vista-Carlsbad, CA
- Population (ZIP)
- 23,190
- Household income
- $159,235
- Rent vs Own
- Severe rent burden
- 714.0
Population outlook (San Diego County) Hauer SSP2
- Today (2025)
- 3,678,185 people
- By 2030
- 3,856,546 · +4.8%
- By 2040
- 4,171,407 · +13.4%
- By 2050
- 4,421,607 · +20.2%
- By 2075
- 4,831,599 · +31.4%
- By 2100
- 4,832,502 · +31.4%
Race, ethnicity, and origin ACS 2023
- Neighborhood character
- Majority White (64%)
- Race & ethnicity
- White 64% Hispanic / Latino 17% Two or more races 15% Asian 12%
- Hispanic origin (detail)
- Mexican 12%
- Common ancestry
- Portuguese 4% Slovak 3% Italian 3%
- Foreign-born
- 16% · Canada, China, Vietnam
- Languages at home
- 82% English-only · Spanish 6% Chinese 4% German/W. Germanic 2%
Political lean MEDSL · San Diego
- 2024 margin
- D (+16.8) · D 56.9% · R 40.1% · Other 2.9%
- 2008→2024 swing
- +6.6pp toward D · 2008: 10.2pp · 2024: 16.8pp
- All cycles
- 2024: D+16.8 2020: D+22.8 2016: D+17.8 2012: D+5.1 2008: D+10.2
Not yet ingested
- Civics
- —
Market trends
- HPI YoY
- ▲ 1.75%
- Current HPI
- 399.8502
- Rent YoY
- ▲ 3.54%
- Metro
- San Diego-Chula Vista-Carlsbad, CA
- State GDP YoY
- ▲ 3.21%
- F500 in state
- 116
Industry mix (Fortune 500 HQ in CA)
| Industry | F500 HQs | Revenue |
|---|---|---|
| Technology | 27 | $1,492B |
|
||
| Financial Services | 3 | $174B |
|
||
| Retail | 3 | $44B |
|
||
| Insurance | 3 | $26B |
|
||
| Media / Entertainment | 2 | $115B |
|
||
| Pharmaceuticals / Biotech | 2 | $62B |
|
||
Price history
+60.2% since first listed7 events — show timeline
- 2026-06-11 Listed $160,000 CRMLS
- 2016-04-29 Sold (MLS) $92,500 SDMLS
- 2016-04-29 Sold (MLS) $92,500 CRMLS
- 2016-03-16 Pending — SDMLS
- 2015-11-20 Price Changed $99,900 SDMLS
- 2015-07-29 Listed $119,900 SDMLS
- 2015-07-29 Listed $99,900 CRMLS
Cash-flow waterfall
monthlySold comps — $/sqft
last 12 mo · ≤1 miLoading sold comps…