 5-Plex
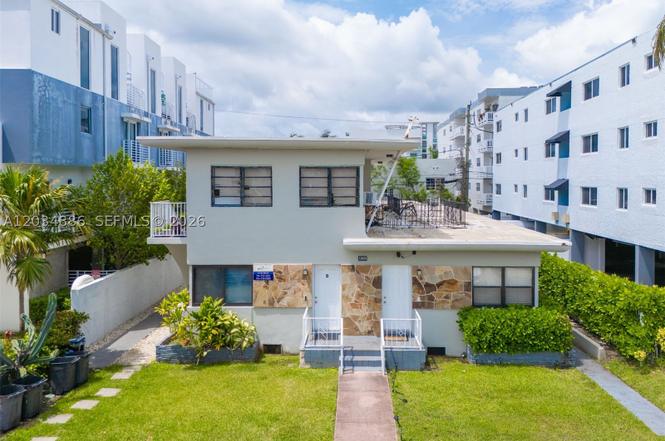
1980 Biarritz Dr · Miami Beach, FL
Flood risk 9/10 · Severe
- FEMA flood zone
- AE
- Chance of flooding over 30 yrs
- 0.99%
- Est. flood insurance / yr
- $1,737 – $8,500
Fire risk 1/10 · Minimal
- Est. fire insurance / yr
- $947 – $1,759
Heat risk 10/10 · Severe
- Hot days now (above 101°F)
- 7 days/yr
- Hot days in 30 yrs
- 29 days/yr
Wind risk 10/10 · Severe
- Chance of severe wind over 30 yrs
- 99.0%
Air-quality risk 2/10 · Minimal
- Unhealthy air days now
- 1 days/yr
- Unhealthy air days in 30 yrs
- 2 days/yr
Risk factors via First Street. Map © Google.
Why this score? — see what drove the C grade
The composite is a weighted blend of 9 inputs, each scored 0–100. Each bar is that input's sub-score; the figure is the points it added to the 100-point composite (weight × sub-score).
- Cash flow +24.6/30.0
- DSCR +7.9/10.0
- ARV discount +7.5/15.0
- 1% rule +6.1/10.0
- Schools +4.2/10.0
- Livability +4.0/5.0
- Rent growth +2.6/5.0
- Condition / age +2.5/5.0
- Appreciation +0.0/10.0
$1,680,000
🖨 Deal sheet 📄 Offer letter ✓ Due diligence
Multi-family units
County records classify this as Multi-Family (5+ Unit). Listing-text estimate: 5 units. confirmed
5+ unit building — per-unit beds/baths from public records are typically unavailable; the breakdown below (if shown) is an estimate from the listing text.
Listing remarks MLS
Charming Two story building. Four 1 bed /1 bath and a One Pent House 1 bed/ 2 bath - Ample Street Parking - Building 3,700 SF. . Land 6600 SF - Located on Normandy Isle. Easy access to Biscayne Blvd and the Beach- Excellent Condition -
Key facts
- Community pool
- Central location
- Favorable unit mix
Tags
Property features AI
Finance
- Financial info: Rents listed for units (examples): $1,810 and $2,050; Rent includes pest control, sewer, trash collection, and water
Exterior
- Parking: On-street parking for units
- Utilities: Public sewer; Cable available
- Home design: 2-story building; Flat roof; Block construction; Effective year built
- Construction: Block construction; Flat roof
- Exterior features: Less than quarter-acre lot; On-street parking
Interior
- Kitchen: Kitchens in units with range and refrigerator; Dishwasher in some units
- Bedrooms: One 1-bedroom unit; One 2-bedroom unit; One additional 1-bedroom unit; One more 1-bedroom unit
- Flooring: Hardwood; Tile; Wood
- Bathrooms: Each unit has 1 full bathroom
- Heating & cooling: Wall furnaces; Ceiling fans; Wall/window air conditioning units
- Interior features: Hardwood and tile flooring; Wood accents
- Laundry & utility: Washer and dryer included in some units
Neighborhood map
What this means for you Summary
Snapshot
- This is a 3×1bd/1.0ba + 1×2bd/1.0ba + 1×1bd/2.0ba units multifamily listed at $1.68M.
Deal economics
- At list price, monthly cash flow is $3k ($37k/yr) — positive. Per door: $610/mo.
- The deal already cash-flows at list — no discount required.
- Meets the 1% rule at list price ($19k rent vs $1.68M).
- Cap rate 8.8% vs local median 1.5% in Miami Beach — top-decile yield for the area; either an underpriced asset or a hidden risk that comps aren't pricing in. Stress-test before assuming the spread holds.
Location & tenants
- Location reads 80/100 on livability (#108 in FL, #1,672 nationally) — a professional / high-income tenant draw. Strengths: crime A+, commute A+, health & safety A+; Watch: housing C-, amenities D-, cost of living F.
- Miami-Dade (suburban): math 45% / reading 54% proficiency, ranked #40 of 73 in FL (top 55%) — families likely to look elsewhere, expect single-tenant / working-renter base with shorter leases; 64% free/reduced lunch — lower-income household profile, screen leases tightly.
- Market conditions: Rents flat; 644 active listings in the ZIP; 25 comparable units currently listed for rent nearby; rentals at typical pace (median 22d on market — plan ~3-4 weeks tenant-placement turnaround); 10,051 units permitted in Miami-Dade County in 2024 (7,758 in 5+ unit buildings).
- At $18,564/mo this rent would consume 324% of the median local household income ($69k/yr) (locally 3521% of renters already pay >50% of income on rent) — very limited rent-growth headroom before tenants either downsize or default.
Forward outlook
- Local home prices are declining (-3.0%/yr); year-one equity from $12k of loan paydown is wiped out by about $50k of value loss. Plan a longer hold.
- Miami-Dade County population projected at +28% by 2050 — long-run rental-demand tailwind backs the buy-and-hold thesis.
Negotiation context
- Only 7 days on market — expect competitive offers; lowballing is unlikely to land.
- 4 sale attempts since 11y ago with the ask held roughly flat each time — persistent listings suggest the price (not the market) is what's stuck; bring a comps-based counter.
- Current owner paid $730k; list at $1.68M implies a 130% gain — meaningful room to come down on a strong offer.
Risks & watch-outs
- Watch-outs: flood insurance adds $427/mo; built in 1951 — expect roof / HVAC / electrical / plumbing capex.
- Climate carrying-cost: in FEMA flood zone AE (mandatory federal flood insurance); severe wind risk, 99% chance of damaging wind over 30y; extreme-heat days projected 7→29/yr by 2055 (HVAC capex compounding) — expect insurance premiums to compound above CPI over the hold.
Questions for the listing agent
- Can we see the unit-by-unit rent roll, current vacancy, and any below-market leases? What's the average tenancy length?
- What capital expenditures (roof, boiler, parking lot, exteriors) have been made in the last 5 years, and what's planned in the next 2?
- Built in 1951 — when were the roof, HVAC, electrical panel, plumbing, and water heater last replaced?
- What's the actual annual flood-insurance premium (NFIP or private), and is the property in a SFHA with mandatory coverage?
- Is there a deadline driving the sale (1031 exchange, divorce, estate, relocation)? That informs how much negotiation room exists.
- Schools are A-rated — typically a magnet for longer-tenancy family renters. What's the average tenant stay here, and is there a school-zone premium baked into asking?
- What's the average days-on-market for RENTAL listings here right now (not sales)? A rising rental-DOM trend means longer vacancies and softer asking-rent achievability than the comps imply.
- What's the recent tenant-quality profile in this submarket — average credit score on applications, eviction rate, late-payment / NSF rate, and stable-employment percentage? A property-management company in the area should have these aggregated.
- How much new apartment / multifamily construction is in the pipeline within 1–3 miles? Heavy new supply (>2% of stock underway) typically softens rents 12–24 months out; light construction supports rent growth.
Investment metrics
- 1% rule
- 1.10% ✓
- Cap rate
- 8.78%
- Cash-on-cash
- 8.87%
- DSCR
- 1.39
- GRM
- 7.5
CMA / ARV
No comps found within radius.
Projected returns pro-forma
-3.0% appreciation · 0.44% rent growth · sell at horizon
- IRR
- -7.4%
- Equity multiple
- 0.74×
- Total profit
- $-124,328
- Equity at exit
- $250,493
- IRR
- -1.4%
- Equity multiple
- 0.92×
- Total profit
- $-38,751
- Equity at exit
- $145,256
Cash invested: $470,400 (down + closing). Projections, not guarantees.
Landlord ↔ Tenant lean methodology
- Overall (STATE)
- 87 Strongly Landlord-Friendly
- State Florida
- 87 Strongly Landlord-Friendly · R+3
- County
- — inherits STATE
- City
- — inherits STATE
ZIP-level market 33141
- Rents YoY
- 0.4%
- Active inventory
- 644
- Price-to-rent
- 38.0×
Monthly cashflow live
- Estimated rent
- $18,564 medium interval (Pro) →
- Mortgage (P&I)
- −$8,810
- Tax from tax record
- −$1,679 /mo · $20,149/yr
- Insurance
- −$700
- Flood insurance flood zone
- −$427 /mo · $5,118/yr
- HOA
- −$0
- Vacancy / Maint / Mgmt
- −$3,898
- Net cashflow
- $3,050
Break-even live
5-unit breakdown (identical units grouped — click to expand)
| Units | Beds | Baths | Est. rent |
|---|---|---|---|
| 3× units | 1 | 1 | $11,064 |
| #1 | 1 | 1 | $3,688 |
| #2 | 1 | 1 | $3,688 |
| #3 | 1 | 1 | $3,688 |
| 1× unit | 2 | 1 | $3,813 |
| 1× unit | 1 | 2 | $3,688 |
| Total (5 units) | $18,564 | ||
UW: 25.0% down · 7.5% · 30yr · 1.5% tax · 5.0% vac · 8.0% maint · 8.0% mgmt
Financing live
Cash to close
- Down payment
- $420,000
- Closing costs
- $50,400
- Reserves months
- —
- Total cash needed
- —
Loan-product check · same deal, 3 products live
Conventional
25% down · 7.5% · 30yr
- Down + closing
- —
- Monthly P&I
- —
- Monthly cashflow
- —
- DSCR
- —
- Eligible?
- —
Personal DTI + credit; lowest rate.
DSCR
20% down · 8.5% · 30yr
- Down + closing
- —
- Monthly P&I
- —
- Monthly cashflow
- —
- DSCR
- —
- Eligible?
- —
No personal income docs; deal must DSCR.
Hard money
10% down · 12.0% · 12mo
- Down + closing
- —
- Monthly P&I
- —
- Monthly cashflow
- —
- DSCR
- —
- Eligible?
- —
Short-term bridge; refi at stabilization.
Rent comps 25 comps
| Address | Beds | Baths | Sqft | Rent | $/sqft | DOM | Units | Dist |
|---|---|---|---|---|---|---|---|---|
| 1101 S Shore Dr Unit 1 Miami Beach, FL | 4.0 | 3.0 | 3411 | $42,000 | $12.31 | 24d | 1 | 0.32mi |
| 1510 S Treasure Dr Unit SINGLE North Bay Village, FL | 4.0 | 4.0 | 2669 | $26,000 | $9.74 | 7d | 1 | 0.85mi |
| 1510 S Treasure Dr Unit SINGLE North Bay Village, FL | 4.0 | 4.0 | 2669 | $26,000 | $9.74 | 21d | 1 | 0.85mi |
| 365 N Shore Dr Miami Beach, FL | 4.0 | 4.0 | 2672 | $25,000 | $9.36 | 24d | 1 | 0.86mi |
| 365 N Shore Dr Miami Beach, FL | 4.0 | 4.0 | 2672 | $25,000 | $9.36 | 2d | 1 | 0.86mi |
| 7972 Biscayne Point Cir Miami Beach, FL | 5.0 | 5.0 | 3989 | $60,000 | $15.04 | 24d | 1 | 0.93mi |
| 1625 Daytonia Rd Miami Beach, FL | 5.0 | 3.0 | 2690 | $18,000 | $6.69 | 24d | 1 | 0.93mi |
| 265 N Shore Dr Miami Beach, FL | 4.0 | 4.0 | 2786 | $27,500 | $9.87 | 2d | 1 | 0.93mi |
| 265 N Shore Dr Miami Beach, FL | 4.0 | 4.0 | 2786 | $30,000 | $10.77 | 21d | 1 | 0.93mi |
| 7939 East Dr Unit 1272352P North Bay Village, FL | 6.0 | 4.0 | 2992 | $26,437 | $8.84 | 20d | 1 | 0.96mi |
| 1365 Bay Ter North Bay Village, FL | 5.0 | 4.0 | 3094 | $40,000 | $12.93 | 24d | 1 | 1.05mi |
| 1170 S Biscayne Point Rd Unit N/A Miami Beach, FL | 4.0 | 3.5 | 2900 | $36,000 | $12.41 | 24d | 1 | 1.06mi |
| 7934 West Dr #501 North Bay Village, FL | 4.0 | 3.5 | 3721 | $18,000 | $4.84 | 24d | 1 | 1.14mi |
| 1575 Stillwater Dr Miami Beach, FL | 4.0 | 3.5 | 4645 | $43,000 | $9.26 | 21d | 1 | 1.29mi |
| 5621 Alton Rd Miami Beach, FL | 4.0 | 3.5 | 2986 | $19,500 | $6.53 | 21d | 1 | 1.30mi |
| 5621 Alton Rd Miami Beach, FL | 4.0 | 3.5 | 2986 | $19,500 | $6.53 | 12d | 1 | 1.30mi |
| 1135 N Biscayne Point Rd Miami Beach, FL | 4.0 | 5.0 | 5077 | $30,000 | $5.91 | 24d | 1 | 1.34mi |
| 5800 Lagorce Dr Unit SFH Miami Beach, FL | 5.0 | 4.5 | 3741 | $36,000 | $9.62 | 24d | 1 | 1.37mi |
| 7811 Carlyle Ave Miami Beach, FL | 6.0 | 5.5 | 3405 | $50,000 | $14.68 | 24d | 1 | 1.38mi |
| 1231 Stillwater Dr Miami Beach, FL | 4.0 | 4.0 | 2664 | $22,000 | $8.26 | 21d | 1 | 1.39mi |
| 1231 Stillwater Dr Unit SFH Miami Beach, FL | 4.0 | 4.0 | 2664 | $22,000 | $8.26 | 17d | 1 | 1.39mi |
| 1151 Stillwater Dr Miami Beach, FL | 5.0 | 3.0 | 3237 | $18,000 | $5.56 | 16d | 1 | 1.41mi |
| 5736 Lagorce Dr Miami Beach, FL | 4.0 | 4.5 | 4400 | $35,000 | $7.95 | 24d | 1 | 1.42mi |
| 1131 Stillwater Dr Unit SFH Miami Beach, FL | 5.0 | 3.5 | 3980 | $19,000 | $4.77 | 24d | 1 | 1.42mi |
| 1055 Stillwater Dr Miami Beach, FL | 6.0 | 5.5 | 4787 | $29,000 | $6.06 | 20d | 1 | 1.45mi |
Listing history 6 events
-
2026-06-18days on market $1,680,000 Active 7 DOM
-
2026-06-17days on market $1,680,000 Active 6 DOM
-
2026-06-16days on market $1,680,000 Active 5 DOM
-
2026-06-15days on market $1,680,000 Active 4 DOM
-
2026-06-13remarks 692-char remark
-
2026-06-13$1,680,000 Active 2 DOM
ⓘ Source: listings_history table (triggers on properties + properties_extension) + one-shot
backfill from property_details.listing_events for pre-trigger history.
Tax reassessment forecast FL · Resets to sale price
- Current annual tax
- $20,149 · $1,679/mo
- Projected year-2 tax
- $20,149 · $1,679/mo
- Expected delta
- $0/yr ($0/mo · 0.0%)
ⓘ Screening estimate from a state-policy table — verify with the county assessor before closing.
Climate risk First Street
- Flood 9/10 Extreme FEMA zone AE · 99% chance over 30 yrs
- Wildfire 1/10 Low
- Heat 10/10 Extreme 7 d/yr ≥101°F today · 29 d/yr by 30 yrs out
- Wind 10/10 Extreme 99% chance of damaging wind over 30 yrs
- Air quality 2/10 Low 1 unhealthy d/yr today · 2 by 30 yrs out
Nearby sold comps map
Loading sold comps map…
Walkable amenities ~0.75 mi
Loading nearby amenities…
Taxation est. · year 1
- Rental income
- $222,768
- − Mortgage interest
- −$94,106
- − Property taxes
- −$20,149
- − Insurance
- −$13,518
- − Repairs & maintenance
- −$17,821
- − Management
- −$17,821
- − Depreciation
- −$48,873
- Taxable income
- $10,479
- Est. tax owed @ 24.0%
- −$2,515
- After-tax cash flow
- $34,083/yr
For passive investors: Depreciation is non-cash, so a rental often shows a tax loss while cash-flowing — sheltering income. Rental losses are passive: they offset passive income freely, and up to $25,000/yr can offset ordinary (W-2) income if you actively participate and your MAGI is under $100k (phasing out to $0 by $150k); unused losses carry forward. On sale, claimed depreciation is recaptured at up to 25%, and gains may owe capital-gains tax (a 1031 exchange can defer both). Figures are a year-1 estimate at your 24.0% rate — not tax advice; consult a CPA.
Schools (NCES district)
- District
- Miami-Dade
- NCES district ID
- 1200390
- Math proficiency
- 45% ▼ -16.00%
- Reading proficiency
- 54% ▼ -5.00%
- Median HH income
- $43,928
- Composite
- 41.76/100
- National rank
- #3397
- State rank
- #40 of 73 in FL
Livability — Miami Beach
- Score
- 80/100
- State rank
- #108
- US rank
- #1672
Category grades
Schools grade is shown separately in the Schools card above.
Census & demographics
- Census place
- Miami Beach, FL
- County
- Miami-Dade County · 2,697,751 people
- City population
- 90,533
- Metro
- Miami-Fort Lauderdale-Pompano Beach, FL
- Population (ZIP)
- 36,438
- Household income
- $68,738
- Rent vs Own
- Severe rent burden
- 3521.0
Population outlook (Miami-Dade County) Hauer SSP2
- Today (2025)
- 3,126,439 people
- By 2030
- 3,325,765 · +6.4%
- By 2040
- 3,697,561 · +18.3%
- By 2050
- 4,012,134 · +28.3%
- By 2075
- 4,605,612 · +47.3%
- By 2100
- 4,866,598 · +55.7%
Race, ethnicity, and origin ACS 2023
- Neighborhood character
- Predominantly Hispanic (67%)
- Race & ethnicity
- Hispanic / Latino 67% Two or more races 36% White 20% Black 4% Asian 3%
- Hispanic origin (detail)
- Mexican 1% Puerto Rican 3% Cuban 27% Salvadoran 6%
- Common ancestry
- Scotch-Irish 2% Romanian 2% Armenian 1%
- Foreign-born
- 62% · Canada, Jamaica, Dominican Republic
- Languages at home
- 18% English-only · Spanish 69% Other Indo-European 4% French/Haitian/Cajun 3%
Political lean MEDSL · Miami-Dade
- 2024 margin
- R (+11.4) · D 43.9% · R 55.4%
- 2008→2024 swing
- -27.6pp toward R · 2008: 16.1pp · 2024: -11.4pp
- All cycles
- 2024: R+11.4 2020: D+7.3 2016: D+29.6 2012: D+23.7 2008: D+16.1
Not yet ingested
- Civics
- —
Market trends
- HPI YoY
- ▼ -472.71%
- Current HPI
- 336.7298
- Rent YoY
- ▲ 0.44%
- Metro
- Miami-Fort Lauderdale-Pompano Beach, FL
- State GDP YoY
- ▲ 3.28%
- F500 in state
- 36
Industry mix (Fortune 500 HQ in FL)
| Industry | F500 HQs | Revenue |
|---|---|---|
| Industrial Technology | 2 | $29B |
|
||
| Insurance | 2 | $17B |
|
||
| Retail | 1 | $60B |
|
||
| Technology Distribution | 1 | $58B |
|
||
| Homebuilding | 1 | $35B |
|
||
| Technology Manufacturing | 1 | $35B |
|
||
Price history
+1311.8% since first listed15 events — show timeline
- 2026-06-10 Listed $1,680,000 MARMLS
- 2025-01-18 Rental Removed $1,780 MARMLS
- 2025-01-11 Listed for Rent $1,780 MARMLS
- 2023-10-11 Listing Removed — MARMLS
- 2023-09-02 Rental Removed — APPFOLIO
- 2023-03-14 Price Changed $1,590,000 MARMLS
- 2022-12-06 Rental Removed — APPFOLIO
- 2022-09-09 Price Changed $1,650,000 MARMLS
- 2022-09-09 Listed $1,650 MARMLS
- 2015-08-07 Sold (Public Records) $730,000 Public Records
- 2015-08-05 Sold (MLS) $730,000 MARMLS
- 2015-05-01 Pending — MARMLS
- 2015-04-20 Listed $799,000 MARMLS
- 2014-06-23 Sold (Public Records) $475,000 Public Records
- 1989-11-27 Sold (Public Records) $119,000 Public Records
Property tax history
+7.4%/yrLatest (2025): $20,149 · +6.1% YoY. Source: county tax records.
Cash-flow waterfall
monthlySold comps — $/sqft
last 12 mo · ≤1 miLoading sold comps…