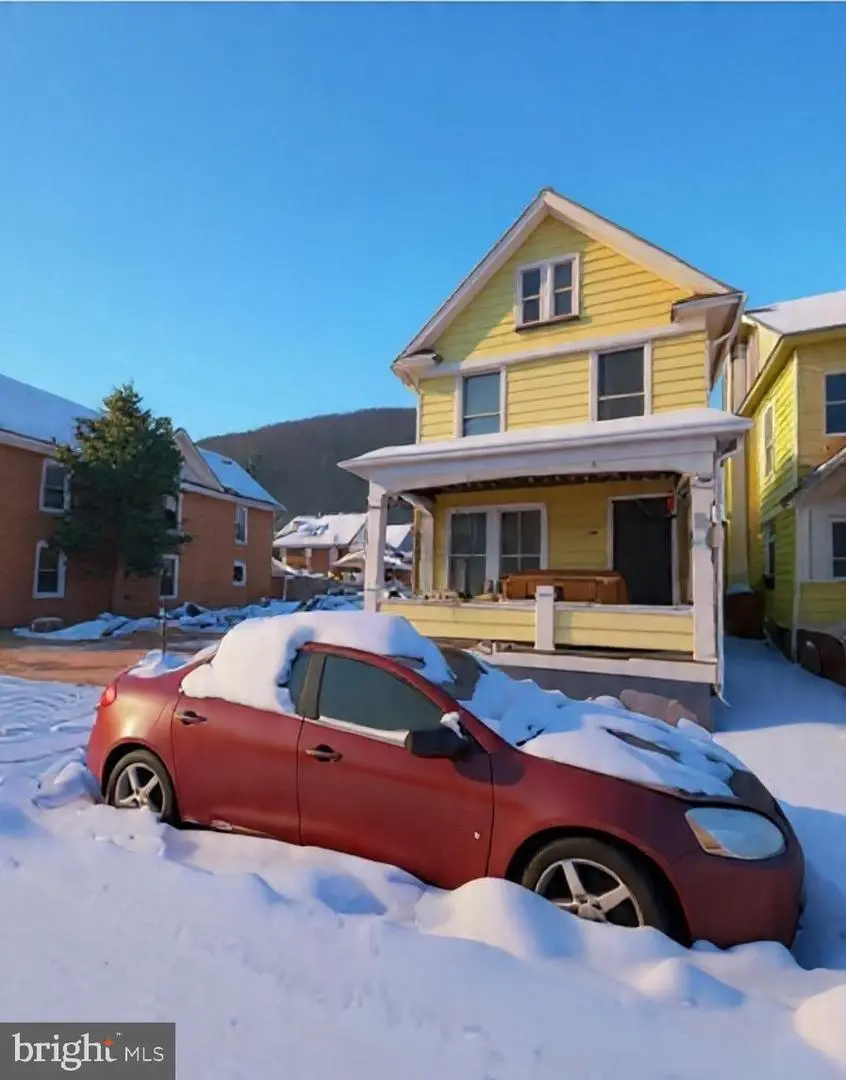
148 Susquehanna Ave · South Renovo, PA
Flood risk 1/10 · Minimal
- FEMA flood zone
- X (unshaded)
- Chance of flooding over 30 yrs
- 0.0%
- Est. flood insurance / yr
- $507 – $1,088
Fire risk 3/10 · Minor
- Est. fire insurance / yr
- $511 – $949
Heat risk 4/10 · Minor
- Hot days now (above 92°F)
- 8 days/yr
- Hot days in 30 yrs
- 20 days/yr
Wind risk 2/10 · Minimal
- Chance of severe wind over 30 yrs
- —
Air-quality risk 1/10 · Minimal
- Unhealthy air days now
- 0 days/yr
- Unhealthy air days in 30 yrs
- 0 days/yr
Risk factors via First Street. Map © Google.
Why this score? — see what drove the B grade
The composite is a weighted blend of 9 inputs, each scored 0–100. Each bar is that input's sub-score; the figure is the points it added to the 100-point composite (weight × sub-score).
- Cash flow +30.0/30.0
- 1% rule +10.0/10.0
- DSCR +10.0/10.0
- ARV discount +7.5/15.0
- Schools +3.2/10.0
- Livability +3.2/5.0
- Rent growth +2.5/5.0
- Condition / age +2.5/5.0
- Appreciation +1.4/10.0
$34,995
🖨 Deal sheet 📄 Offer letter ✓ Due diligence
Listing remarks
3 bed, 1.5 bath 2-story home with a basement. This home offers a great opportunity for the next owner to bring their vision and make it their own. Functional layout with comfortable living spaces and a practical floor plan that provides a solid starting point. The home has good bones and plenty of potential for thoughtful updates throughout. Ideal for an owner-occupant looking to personalize over time or an investor seeking a value-add opportunity.
Key facts
- 3,093 sq ft lot
- Built 1926
- Listed 35 days
Property features AI
Finance
- Other: Fee simple ownership; Accessibility features indicated
- Financial info: $911 annual tax (2025)
Exterior
- Parking: On-street parking
- Utilities: Public water; Public sewer; Sewer and water available; Electric cooling fuel and hot water
- Home design: Detached structure; Frame construction with vinyl siding; Shingle roof; Block foundation; Year built estimated
- Exterior features: Not in a federal flood zone; Above-grade and below-grade structures noted; Pets allowed with no restrictions
Interior
- Bedrooms: Three bedrooms on the main upper level
- Bathrooms: One full bathroom; One half bathroom
- Heating & cooling: Central heating (oil); Central air conditioning; Electric hot water
- Interior features: Estimated living area; No basement
Neighborhood map
What this means for you Summary
Snapshot
- This is a 3-bed/1.0-bath single-family listed at $35k.
Deal economics
- At list price, monthly cash flow is $689 ($8k/yr) — positive.
- The deal already cash-flows at list — no discount required.
- Meets the 1% rule at list price ($1k rent vs $35k).
- Recommended offer: $34k (3.0% below list) — sets the bar for market timing.
Location & tenants
- Location reads 65/100 on livability (#1,116 in PA) — a middle-class / working-renter tenant base. Strengths: cost of living A+, housing A+, health & safety A+; Watch: employment C-, crime D+, amenities F.
- Keystone Central SD (town): math 32% / reading 44% proficiency, ranked #384 of 539 in PA (top 71%) — families likely to look elsewhere, expect single-tenant / working-renter base with shorter leases.
- Zoned schools: Bucktail Hs (math 44%, 114 students, 49% FRL).
- Market conditions: 18 active listings in the ZIP; 44 units permitted in Clinton County in 2024 (0 in 5+ unit buildings).
Forward outlook
- Local home prices are declining (-3.0%/yr); year-one equity from $242 of loan paydown is wiped out by about $1k of value loss. Plan a longer hold.
- Clinton County population projected to shrink 5% by 2050 — rents likely to lag national; underwrite the cash flow, not the appreciation.
- At projected returns (-3.0% appreciation + 3.0% rent growth), your $10k cash investment doubles in ~2 years — after that, you're playing with house money.
Negotiation context
- It's been on market 35 days — a 3% lower offer ($34k) is reasonable based on typical stale-listing flexibility.
- 3 sale attempts; this cycle's ask has dropped $15k (30%) from the opening price — seller is motivated, your offer sets the floor, not the list.
- Current owner paid $30k; 17% above their basis — modest negotiation headroom, anchor on the comps not their cost.
Risks & watch-outs
- Watch-outs: property tax is 2.6% of price; built in 1926 — expect roof / HVAC / electrical / plumbing capex.
Questions for the listing agent
- It's been on market 35 days. Have you received any prior offers? Is the seller open to a 3% concession, seller financing, or rate buy-down credit?
- Built in 1926 — when were the roof, HVAC, electrical panel, plumbing, and water heater last replaced?
- Property tax is high relative to price — has the assessment been appealed recently, and will the sale trigger a re-assessment?
- Is there a deadline driving the sale (1031 exchange, divorce, estate, relocation)? That informs how much negotiation room exists.
- Schools are F-rated, which usually means shorter tenancies and higher turnover. Who's the typical renter profile here, and what's been the actual vacancy rate?
- Crime grade is D in this area — have there been break-ins, vandalism, or insurance claims at this property in the last 3 years? What carrier currently insures it and at what premium?
- What's the average days-on-market for RENTAL listings here right now (not sales)? A rising rental-DOM trend means longer vacancies and softer asking-rent achievability than the comps imply.
- What's the recent tenant-quality profile in this submarket — average credit score on applications, eviction rate, late-payment / NSF rate, and stable-employment percentage? A property-management company in the area should have these aggregated.
- How much new for-sale + rental construction is in the pipeline within 1–3 miles? Heavy new supply typically softens prices + rents 12–24 months out; constrained supply supports both.
Investment metrics
- 1% rule
- 3.48% ✓
- Cap rate
- 29.93%
- Cash-on-cash
- 84.42%
- DSCR
- 4.76
- GRM
- 2.4
CMA / ARV
- ARV (median comp)
- $86,664
- List price
- $34,995
- Delta
- -59.62%
- Verdict
- UNDERPRICED
- Comps
- 13 within 1.0 mi
Show comp detail 1 sale within ~0.75 mi
| Address | Dist | Beds/Ba | Sqft | Sold | Price | $/sf | Match |
|---|---|---|---|---|---|---|---|
| 365 Pennsylvania Ave | 0.21mi | 3/1.0 | 1,632 (-6%) | 18mo | $85,000 | $52 | 66 |
Match score weights: distance 35% · size 25% · config 20% · recency 20%. Top-matched comps best support the ARV.
Projected returns pro-forma
-3.0% appreciation · 3.0% rent growth · sell at horizon
- IRR
- 84.8%
- Equity multiple
- 4.91×
- Total profit
- $38,272
- Equity at exit
- $5,218
- IRR
- 88.1%
- Equity multiple
- 10.19×
- Total profit
- $90,015
- Equity at exit
- $3,026
Cash invested: $9,799 (down + closing). Projections, not guarantees.
Landlord ↔ Tenant lean methodology
- Overall (STATE)
- 62 Landlord-Friendly
- State Pennsylvania
- 62 Landlord-Friendly · EVEN
- County
- — inherits STATE
- City
- — inherits STATE
ZIP-level market 17764
- Home prices YoY
- -6.0%
- Active inventory
- 18
- Price-to-rent
- 2.4×
Monthly cashflow live
- Estimated rent
- $1,219 medium interval (Pro) →
- Mortgage (P&I)
- −$184
- Tax from tax record
- −$76 /mo · $911/yr
- Insurance
- −$15
- HOA
- −$0
- Vacancy / Maint / Mgmt
- −$256
- Net cashflow
- $689
Break-even live
UW: 25.0% down · 7.5% · 30yr · 1.5% tax · 5.0% vac · 8.0% maint · 8.0% mgmt
Financing live
Cash to close
- Down payment
- $8,749
- Closing costs
- $1,050
- Reserves months
- —
- Total cash needed
- —
Loan-product check · same deal, 3 products live
Conventional
25% down · 7.5% · 30yr
- Down + closing
- —
- Monthly P&I
- —
- Monthly cashflow
- —
- DSCR
- —
- Eligible?
- —
Personal DTI + credit; lowest rate.
DSCR
20% down · 8.5% · 30yr
- Down + closing
- —
- Monthly P&I
- —
- Monthly cashflow
- —
- DSCR
- —
- Eligible?
- —
No personal income docs; deal must DSCR.
Hard money
10% down · 12.0% · 12mo
- Down + closing
- —
- Monthly P&I
- —
- Monthly cashflow
- —
- DSCR
- —
- Eligible?
- —
Short-term bridge; refi at stabilization.
Listing history 25 events
-
2026-06-19days on market $34,995 Active 35 DOM
-
2026-06-18days on market $34,995 Active 34 DOM
-
2026-06-17days on market $34,995 Active 33 DOM
-
2026-06-17price $34,995 Active 32 DOM
-
2026-06-16days on market $39,995 Active 32 DOM
-
2026-06-15days on market $39,995 Active 31 DOM
-
2026-06-14days on market $39,995 Active 29 DOM
-
2026-06-12days on market $39,995 Active 28 DOM
-
2026-06-09days on market $39,995 Active 25 DOM
-
2026-06-08days on market $39,995 Active 24 DOM
-
2026-06-07days on market $39,995 Active 23 DOM
-
2026-06-04pricedays on market $39,995 Active 19 DOM
-
2026-06-02days on market $44,995 Active 18 DOM
-
2026-06-01days on market $44,995 Active 17 DOM
-
2026-05-31days on market $44,995 Active 16 DOM
-
2026-05-31days on market $44,995 Active 15 DOM
-
2026-05-15$49,995 Active 453-char remark
-
2026-03-26historical
-
2026-02-24price $37,500
-
2026-02-15price $45,000
-
2026-02-09price $50,000
-
2026-02-03status Active
-
2026-01-29historical
-
2026-01-28$59,998 Active
-
2011-08-02soldstatus $30,000
ⓘ Source: listings_history table (triggers on properties + properties_extension) + one-shot
backfill from property_details.listing_events for pre-trigger history.
Tax reassessment forecast PA · Partial reset (capped growth)
- Current annual tax
- $911 · $76/mo
- Projected year-2 tax
- $911 · $76/mo
- Expected delta
- $0/yr ($0/mo · 0.0%)
ⓘ Screening estimate from a state-policy table — verify with the county assessor before closing.
Climate risk First Street
- Flood 1/10 Low FEMA zone X (unshaded) · 0% chance over 30 yrs
- Wildfire 3/10 Moderate
- Heat 4/10 Moderate 8 d/yr ≥92°F today · 20 d/yr by 30 yrs out
- Wind 2/10 Low
- Air quality 1/10 Low 0 unhealthy d/yr today · 0 by 30 yrs out
Nearby sold comps map
Loading sold comps map…
Walkable amenities ~0.75 mi
Loading nearby amenities…
Taxation est. · year 1
- Rental income
- $14,633
- − Mortgage interest
- −$1,960
- − Property taxes
- −$911
- − Insurance
- −$175
- − Repairs & maintenance
- −$1,171
- − Management
- −$1,171
- − Depreciation
- −$1,018
- Taxable income
- $8,228
- Est. tax owed @ 24.0%
- −$1,975
- After-tax cash flow
- $6,297/yr
For passive investors: Depreciation is non-cash, so a rental often shows a tax loss while cash-flowing — sheltering income. Rental losses are passive: they offset passive income freely, and up to $25,000/yr can offset ordinary (W-2) income if you actively participate and your MAGI is under $100k (phasing out to $0 by $150k); unused losses carry forward. On sale, claimed depreciation is recaptured at up to 25%, and gains may owe capital-gains tax (a 1031 exchange can defer both). Figures are a year-1 estimate at your 24.0% rate — not tax advice; consult a CPA.
Schools (NCES district)
- District
- Keystone Central SD
- NCES district ID
- 4212725
- Math proficiency
- 32% ▼ -6.00%
- Reading proficiency
- 44% ▼ -10.00%
- Median HH income
- $42,713
- Composite
- 32.09/100
- National rank
- #5810
- State rank
- #384 of 539 in PA
Livability — South Renovo
- Score
- 65/100
- State rank
- #1116
- US rank
- #12721
Category grades
Schools grade is shown separately in the Schools card above.
Census & demographics
- Census place
- South Renovo, PA
- Population (ZIP)
- 2,460
Population outlook (Clinton County) Hauer SSP2
- Today (2025)
- 39,048 people
- By 2030
- 38,812 · -0.6%
- By 2040
- 38,011 · -2.7%
- By 2050
- 36,931 · -5.4%
- By 2075
- 34,077 · -12.7%
- By 2100
- 29,683 · -24.0%
Race, ethnicity, and origin ACS 2023
- Neighborhood character
- Predominantly White (92%)
- Race & ethnicity
- White 92% Two or more races 7% Hispanic / Latino 2%
- Common ancestry
- Romanian 3% Italian 2% Russian 1%
- Foreign-born
- 1% · Canada
- Languages at home
- 99% English-only · Spanish 1%
Political lean MEDSL · Clinton
- 2024 margin
- Solid R (+40.9) · D 29.1% · R 70.0%
- 2008→2024 swing
- -38.1pp toward R · 2008: -2.8pp · 2024: -40.9pp
- All cycles
- 2024: R+40.9 2020: R+36.3 2016: R+34.8 2012: R+11.3 2008: R+2.8
Not yet ingested
- Civics
- —
Market trends
- HPI YoY
- ▼ -7.16%
- Current HPI
- 111.66
- Rent YoY
- —
- Metro
- —
- State GDP YoY
- ▲ 1.68%
- F500 in state
- 34
Industry mix (Fortune 500 HQ in PA)
| Industry | F500 HQs | Revenue |
|---|---|---|
| Healthcare | 2 | $309B |
|
||
| Insurance | 2 | $27B |
|
||
| Telecommunications / Media | 1 | $124B |
|
||
| Industrial Distribution | 1 | $22B |
|
||
| Financial Services | 1 | $20B |
|
||
| Chemicals / Materials | 1 | $18B |
|
||
Price history
+16.7% since first listed12 events — show timeline
- 2026-06-16 Price Changed $34,995 BRIGHT MLS
- 2026-06-03 Price Changed $39,995 BRIGHT MLS
- 2026-05-26 Price Changed $44,995 BRIGHT MLS
- 2026-05-15 Listed $49,995 BRIGHT MLS
- 2026-03-26 Listing Removed — BRIGHT MLS
- 2026-02-24 Price Changed $37,500 BRIGHT MLS
- 2026-02-15 Price Changed $45,000 BRIGHT MLS
- 2026-02-09 Price Changed $50,000 BRIGHT MLS
- 2026-02-03 Relisted — BRIGHT MLS
- 2026-01-29 Listing Removed — BRIGHT MLS
- 2026-01-28 Listed $59,998 BRIGHT MLS
- 2011-08-02 Sold (Public Records) $30,000 Public Records
Property tax history
-4.6%/yrLatest (2026): $911 · +0.9% YoY. Source: county tax records.
Cash-flow waterfall
monthlySold comps — $/sqft
last 12 mo · ≤1 miLoading sold comps…