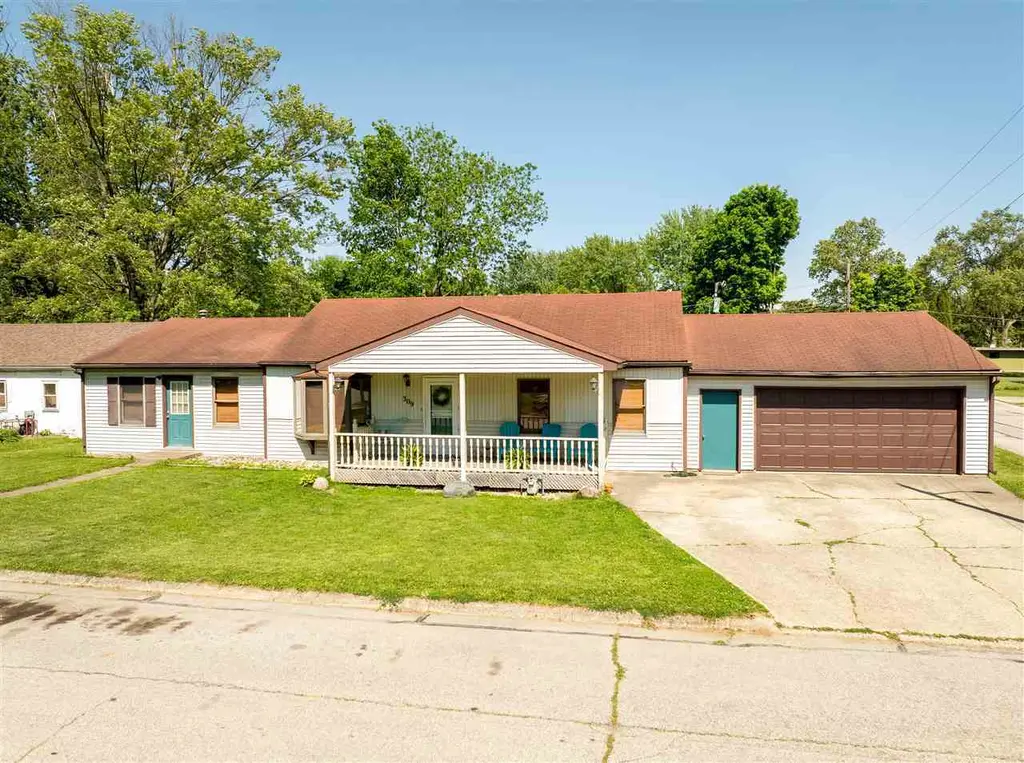
309 Imel St · Fountain City, IN
Flood risk 1/10 · Minimal
- FEMA flood zone
- X (unshaded)
- Chance of flooding over 30 yrs
- 0.0%
- Est. flood insurance / yr
- $507 – $1,088
Fire risk 1/10 · Minimal
- Est. fire insurance / yr
- $717 – $1,331
Heat risk 3/10 · Minor
- Hot days now (above 99°F)
- 7 days/yr
- Hot days in 30 yrs
- 18 days/yr
Wind risk 2/10 · Minimal
- Chance of severe wind over 30 yrs
- 1.0%
Air-quality risk 3/10 · Minor
- Unhealthy air days now
- 2 days/yr
- Unhealthy air days in 30 yrs
- 4 days/yr
Risk factors via First Street. Map © Google.
Why this score? — see what drove the C grade
The composite is a weighted blend of 9 inputs, each scored 0–100. Each bar is that input's sub-score; the figure is the points it added to the 100-point composite (weight × sub-score).
- Cash flow +15.5/30.0
- ARV discount +14.6/15.0
- Appreciation +5.9/10.0
- DSCR +4.8/10.0
- 1% rule +3.7/10.0
- Schools +3.5/10.0
- Livability +3.2/5.0
- Rent growth +2.5/5.0
- Condition / age +2.5/5.0
$134,000
🖨 Deal sheet 📄 Offer letter ✓ Due diligence
Listing remarks
This one-of-a-kind 4-bedroom, 1.5-bath ranch is ready for its next family to fill it with laughter, celebrations, and memories for years to come. From the moment you step inside, you will feel the warmth this home offers. The oversized great room is truly the heart of the home designed for bringing people together, perfect for hosting holidays, game nights, and large gatherings with family and friends. The covered front porch invites you to slow down and enjoy peaceful evenings, while the spacious 2-car garage provides plenty of room for vehicles, storage, and hobbies. Even better, all appliances stay, making your move that much easier. Situated in the heart of Fountain City within the Nort
Key facts
- Covered front porch
- All appliances stay
- Oversized great room
Tags
Property features AI
Exterior
- Parking: Attached garage; Approximately 2.5 garage spaces; Concrete driveway/parking
- Utilities: Public water; Public sewer
- Home design: Single family residence; One story
- Construction: Vinyl siding
- Exterior features: Asphalt shingle roof
Interior
- Kitchen: Dishwasher; Microwave; Electric range; Refrigerator
- Bathrooms: 2 full bathrooms
- Heating & cooling: Central air conditioning; Forced air heating
- Interior features: Water softener; Gas water heater
- Laundry & utility: Washer; Dryer
Neighborhood map
What this means for you Summary
Snapshot
- This is a 3-bed/1.5-bath single-family listed at $134k.
Deal economics
- At list price, monthly cash flow is $53 ($638/yr) — positive.
- The deal already cash-flows at list — no discount required.
- To meet the 1% rule (rent ≥ 1% of price), the offer needs to be $116k (13.3% below list).
- Recommended offer: $116k (13.3% below list) — sets the bar for 1% rule.
Location & tenants
- Location reads 65/100 on livability (#344 in IN) — a middle-class / working-renter tenant base. Strengths: cost of living A+, housing A+; Watch: crime C-, health & safety C-, employment D+.
- Northeastern Wayne Schools (rural): math 35% / reading 46% proficiency, ranked #132 of 301 in IN (top 44%) — families likely to look elsewhere, expect single-tenant / working-renter base with shorter leases.
- Zoned schools: Northeastern Elementary School (math 48% / reading 38%, grade F, #417 of 994 statewide, top 43%, 590 students, 55% FRL); Northeastern Middle School (math 28% / reading 50%, grade F, #128 of 330 statewide, top 40%, 324 students, 48% FRL); Northeastern High School (math 17% / reading 57%, grade F, #247 of 369 statewide, top 70%, 443 students, 45% FRL) — zoned schools average 49% FRL vs 30% district-wide (19 pts higher); higher-poverty schools than district average — tighter screening recommended.
- Market conditions: 13 active listings in the ZIP; 38 units permitted in Wayne County in 2024 (0 in 5+ unit buildings).
Forward outlook
- In year one you build about $3k of equity ($926 loan paydown + $2k appreciation (1.8% local appreciation)).
- Wayne County population projected at -21% by 2050 — secular population decline; favor cash flow + early exit over multi-decade hold.
- At projected returns (1.8% appreciation + 3.0% rent growth), your $38k cash investment doubles in ~8 years — after that, you're playing with house money.
- By year 10, paydown + projected appreciation supports a ~$33k cash-out refi (75% LTV) — recoverable capital for the next deal without selling this one.
Negotiation context
- Only 6 days on market — expect competitive offers; lowballing is unlikely to land.
Risks & watch-outs
- Watch-outs: built in 1955 — expect roof / HVAC / electrical / plumbing capex.
Questions for the listing agent
- Built in 1955 — when were the roof, HVAC, electrical panel, plumbing, and water heater last replaced?
- Is there a deadline driving the sale (1031 exchange, divorce, estate, relocation)? That informs how much negotiation room exists.
- Schools are F-rated, which usually means shorter tenancies and higher turnover. Who's the typical renter profile here, and what's been the actual vacancy rate?
- What's the average days-on-market for RENTAL listings here right now (not sales)? A rising rental-DOM trend means longer vacancies and softer asking-rent achievability than the comps imply.
- What's the recent tenant-quality profile in this submarket — average credit score on applications, eviction rate, late-payment / NSF rate, and stable-employment percentage? A property-management company in the area should have these aggregated.
- How much new for-sale + rental construction is in the pipeline within 1–3 miles? Heavy new supply typically softens prices + rents 12–24 months out; constrained supply supports both.
Investment metrics
- 1% rule
- 0.87% ✗
- Cap rate
- 6.77%
- Cash-on-cash
- 1.70%
- DSCR
- 1.08
- GRM
- 9.6
CMA / ARV
- ARV (on-the-fly)
- $159,264
- Comps found
- 6
Show comp detail 6 sales within ~0.75 mi
| Address | Dist | Beds/Ba | Sqft | Sold | Price | $/sf | Match |
|---|---|---|---|---|---|---|---|
| 306 Ross St | 0.04mi | 3/1.0 | 1,956 (+3%) | 20mo | $165,000 | $84 | 74 |
| 301 S Front St | 0.13mi | 4/2.0 (+1) | 1,680 (-11%) | 1mo | $181,000 | $108 | 67 |
| 315 US 27 | 0.19mi | 4/1.5 (+1) | 1,680 (-11%) | 10mo | $109,000 | $65 | 59 |
| 311 Davis St | 0.28mi | 4/2.5 (+1) | 1,868 (-2%) | 24mo | $137,000 | $73 | 56 |
| 116 Us Highway 27 N | 0.27mi | 3/2.0 | 1,670 (-12%) | 21mo | $36,900 | $22 | 48 |
| 2227 W Fountain City Pike | 0.68mi | 3/1.5 | 1,684 (-11%) | 12mo | $220,900 | $131 | 39 |
Match score weights: distance 35% · size 25% · config 20% · recency 20%. Top-matched comps best support the ARV.
Projected returns pro-forma
1.83% appreciation · 3.0% rent growth · sell at horizon
- IRR
- 5.7%
- Equity multiple
- 1.30×
- Total profit
- $11,413
- Equity at exit
- $51,641
- IRR
- 9.3%
- Equity multiple
- 2.24×
- Total profit
- $46,446
- Equity at exit
- $73,444
Cash invested: $37,520 (down + closing). Projections, not guarantees.
Landlord ↔ Tenant lean methodology
- Overall (STATE)
- 90 Strongly Landlord-Friendly
- State Indiana
- 90 Strongly Landlord-Friendly · R+11
- County
- — inherits STATE
- City
- — inherits STATE
ZIP-level market 47341
- Home prices YoY
- 0.9%
- Active inventory
- 13
- Price-to-rent
- 9.6×
Monthly cashflow live
- Estimated rent
- $1,161 medium interval (Pro) →
- Mortgage (P&I)
- −$703
- Tax from tax record
- −$106 /mo · $1,270/yr
- Insurance
- −$56
- HOA
- −$0
- Vacancy / Maint / Mgmt
- −$244
- Net cashflow
- $53
Break-even live
UW: 25.0% down · 7.5% · 30yr · 1.5% tax · 5.0% vac · 8.0% maint · 8.0% mgmt
Financing live
Cash to close
- Down payment
- $33,500
- Closing costs
- $4,020
- Reserves months
- —
- Total cash needed
- —
Loan-product check · same deal, 3 products live
Conventional
25% down · 7.5% · 30yr
- Down + closing
- —
- Monthly P&I
- —
- Monthly cashflow
- —
- DSCR
- —
- Eligible?
- —
Personal DTI + credit; lowest rate.
DSCR
20% down · 8.5% · 30yr
- Down + closing
- —
- Monthly P&I
- —
- Monthly cashflow
- —
- DSCR
- —
- Eligible?
- —
No personal income docs; deal must DSCR.
Hard money
10% down · 12.0% · 12mo
- Down + closing
- —
- Monthly P&I
- —
- Monthly cashflow
- —
- DSCR
- —
- Eligible?
- —
Short-term bridge; refi at stabilization.
Listing history 1 events
-
2026-05-20$134,000 Active
ⓘ Source: listings_history table (triggers on properties + properties_extension) + one-shot
backfill from property_details.listing_events for pre-trigger history.
Tax reassessment forecast IN · Partial reset (capped growth)
- Current annual tax
- $1,270 · $106/mo
- Projected year-2 tax
- $1,270 · $106/mo
- Expected delta
- $0/yr ($0/mo · 0.0%)
ⓘ Screening estimate from a state-policy table — verify with the county assessor before closing.
Climate risk First Street
- Flood 1/10 Low FEMA zone X (unshaded) · 0% chance over 30 yrs
- Wildfire 1/10 Low
- Heat 3/10 Moderate 7 d/yr ≥99°F today · 18 d/yr by 30 yrs out
- Wind 2/10 Low 100% chance of damaging wind over 30 yrs
- Air quality 3/10 Moderate 2 unhealthy d/yr today · 4 by 30 yrs out
Nearby sold comps map
Loading sold comps map…
Walkable amenities ~0.75 mi
Loading nearby amenities…
Taxation est. · year 1
- Rental income
- $13,937
- − Mortgage interest
- −$7,506
- − Property taxes
- −$1,270
- − Insurance
- −$670
- − Repairs & maintenance
- −$1,115
- − Management
- −$1,115
- − Depreciation
- −$3,898
- Taxable loss
- −$1,637
- Est. tax savings @ 24.0%
- +$393
- After-tax cash flow
- $1,031/yr
For passive investors: Depreciation is non-cash, so a rental often shows a tax loss while cash-flowing — sheltering income. Rental losses are passive: they offset passive income freely, and up to $25,000/yr can offset ordinary (W-2) income if you actively participate and your MAGI is under $100k (phasing out to $0 by $150k); unused losses carry forward. On sale, claimed depreciation is recaptured at up to 25%, and gains may owe capital-gains tax (a 1031 exchange can defer both). Figures are a year-1 estimate at your 24.0% rate — not tax advice; consult a CPA.
Schools (NCES district)
- District
- Northeastern Wayne Schools
- NCES district ID
- 1808190
- Math proficiency
- 35% ▼ -3.00%
- Reading proficiency
- 46% ▼ -2.00%
- Median HH income
- $51,159
- Composite
- 34.98/100
- National rank
- #5056
- State rank
- #132 of 301 in IN
Livability — Fountain City
- Score
- 65/100
- State rank
- #344
- US rank
- #13177
Category grades
Schools grade is shown separately in the Schools card above.
Census & demographics
- Census place
- Fountain City, IN
- Population (ZIP)
- 2,513
Population outlook (Wayne County) Hauer SSP2
- Today (2025)
- 63,316 people
- By 2030
- 60,893 · -3.8%
- By 2040
- 55,386 · -12.5%
- By 2050
- 49,946 · -21.1%
- By 2075
- 37,900 · -40.1%
- By 2100
- 26,562 · -58.0%
Race, ethnicity, and origin ACS 2023
- Neighborhood character
- Predominantly White (95%)
- Race & ethnicity
- White 95% Two or more races 3% Hispanic / Latino 1%
- Common ancestry
- Polish 2%
- Foreign-born
- 1%
- Languages at home
- 83% English-only · German/W. Germanic 16%
Political lean MEDSL · Wayne
- 2024 margin
- Solid R (+32.5) · D 32.9% · R 65.4% · Other 1.6%
- 2008→2024 swing
- -28.6pp toward R · 2008: -3.9pp · 2024: -32.5pp
- All cycles
- 2024: R+32.5 2020: R+29.1 2016: R+30.1 2012: R+14.7 2008: R+3.9
Not yet ingested
- Civics
- —
Market trends
- HPI YoY
- ▲ 1.83%
- Current HPI
- 199.9642
- Rent YoY
- —
- Metro
- —
- State GDP YoY
- ▲ 2.90%
- F500 in state
- 18
Industry mix (Fortune 500 HQ in IN)
| Industry | F500 HQs | Revenue |
|---|---|---|
| Industrial Machinery | 2 | $37B |
|
||
| Healthcare | 1 | $177B |
|
||
| Pharmaceuticals | 1 | $45B |
|
||
| Metals / Steel | 1 | $18B |
|
||
| Agriculture | 1 | $17B |
|
||
| Packaging | 1 | $12B |
|
||
Price history
1 event — show timeline
- 2026-05-20 Listed $134,000 RRELMS
Property tax history
+2.0%/yrLatest (2024): $1,270 · +8.7% YoY. Source: county tax records.
Cash-flow waterfall
monthlySold comps — $/sqft
last 12 mo · ≤1 miLoading sold comps…