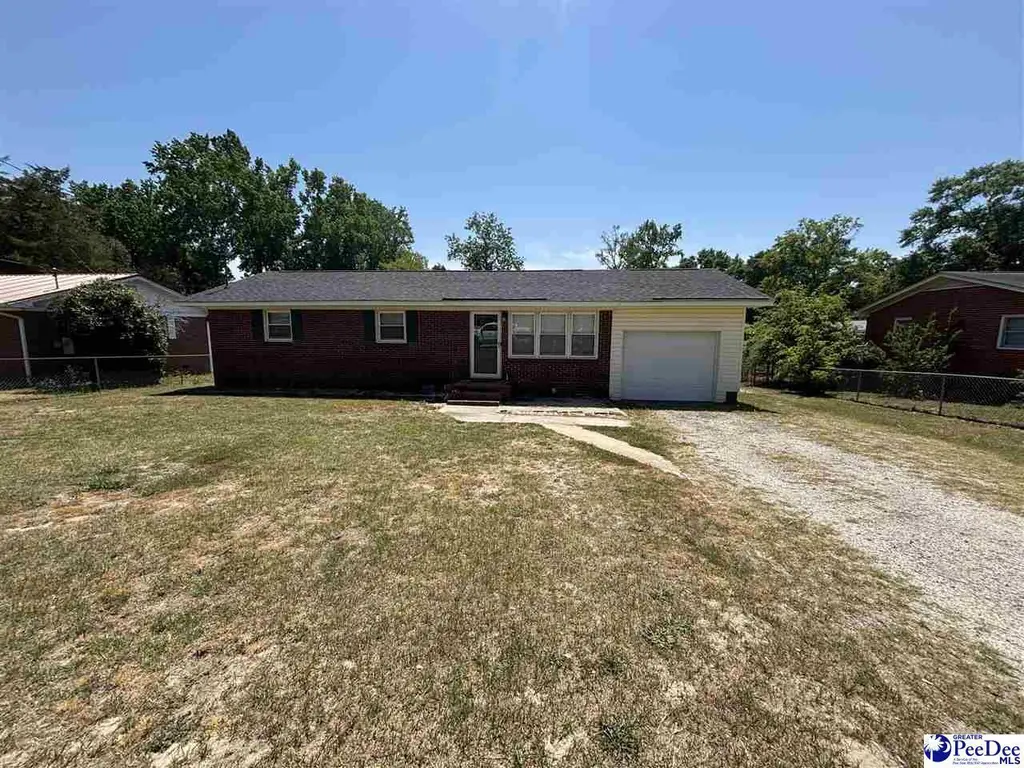
1416 Welch Dr · Florence, SC
Flood risk 1/10 · Minimal
- FEMA flood zone
- X (unshaded)
- Chance of flooding over 30 yrs
- 0.0%
- Est. flood insurance / yr
- $507 – $1,088
Fire risk 5/10 · Moderate
- Est. fire insurance / yr
- $783 – $1,453
Heat risk 7/10 · Major
- Hot days now (above 108°F)
- 7 days/yr
- Hot days in 30 yrs
- 16 days/yr
Wind risk 8/10 · Major
- Chance of severe wind over 30 yrs
- 80.0%
Air-quality risk 1/10 · Minimal
- Unhealthy air days now
- 0 days/yr
- Unhealthy air days in 30 yrs
- 0 days/yr
Risk factors via First Street. Map © Google.
Why this score? — see what drove the D+ grade
The composite is a weighted blend of 9 inputs, each scored 0–100. Each bar is that input's sub-score; the figure is the points it added to the 100-point composite (weight × sub-score).
- Cash flow +14.4/30.0
- ARV discount +9.2/15.0
- DSCR +4.4/10.0
- Rent growth +4.2/5.0
- 1% rule +3.8/10.0
- Schools +3.2/10.0
- Livability +3.1/5.0
- Condition / age +2.5/5.0
- Appreciation +0.0/10.0
$198,000
🖨 Deal sheet (PDF) 📄 Offer letter ✓ Due diligence
Listing remarks
3 bedroom 1.5 bath home in a convenient South Florence area with recent updates. Updates include a new HVAC unit, remodeled kitchen and hall bath. Flooring and lighting in bathrooms, hall, living room and kitchen are new. Carpets in remaining rooms only around 2 years old. This home features a spacious den off the kitchen for indoor entertainment. The house has an attached one car garage and a sunroom! The backyard is huge, fully fenced in, has a deck and a shed. Septic tank was pumped out about 2 years ago. These opportunities are difficult to come by now for under $200k. Take advantage of this while you still can!
Key facts
- New lighting
- Remodeled kitchen
- New flooring
Tags
Property features AI
Exterior
- Parking: Attached garage (1 car)
- Utilities: Public water; Septic tank sewer
- Home design: Single family residence; Residential property; Approximately 1,600 above-grade finished area
- Construction: Brick veneer and vinyl siding exterior; Shingle roof
- Exterior features: Storage; Deck; Fenced yard; Workshop
Interior
- Flooring: Carpet; Vinyl
- Bathrooms: 1 full bathroom; 1 half bathroom
- Heating & cooling: Central heating; Central air; Ceiling fan(s)
- Interior features: Carpet and vinyl flooring; Crawl space basement
Neighborhood map
What this means for you Summary
Snapshot
- This is a 3-bed/1.5-bath single-family listed at $198k.
Deal economics
- At list price, monthly cash flow is $42 ($499/yr) — positive.
- The deal already cash-flows at list — no discount required.
- To meet the 1% rule (rent ≥ 1% of price), the offer needs to be $175k (11.6% below list).
- Recommended offer: $175k (11.6% below list) — sets the bar for 1% rule.
- Cap rate 6.5% vs local median 3.5% in Florence — top-decile yield for the area; either an underpriced asset or a hidden risk that comps aren't pricing in. Stress-test before assuming the spread holds.
Location & tenants
- Location reads 62/100 on livability (#196 in SC) — a middle-class / working-renter tenant base. Strengths: cost of living A+, housing A+, health & safety B+; Watch: employment C-, crime F, amenities F.
- Florence 01 (urban): math 29% / reading 47% proficiency, ranked #34 of 80 in SC (top 42%) — families likely to look elsewhere, expect single-tenant / working-renter base with shorter leases.
- Zoned schools: Greenwood Elementary (math 25% / reading 35%, grade F, #394 of 597 statewide, top 66%, 542 students, 100% FRL); Southside Middle (math 18% / reading 38%, grade F, #146 of 229 statewide, top 64%, 1,100 students, 100% FRL); South Florence High (math 58% / reading 86%, grade B+, #48 of 196 statewide, top 26%, 1,643 students, 77% FRL) — zoned schools average 92% FRL vs 57% district-wide (35 pts higher); higher-poverty schools than district average — tighter screening recommended.
- Market conditions: Rents rising fast (+7.0%/yr); 185 active listings in the ZIP; 657 units permitted in Florence County in 2024 (40 in 5+ unit buildings).
- This rent runs 31% of the median local income ($67k/yr) — at the standard rent-burdened threshold; future hikes will face affordability resistance.
Forward outlook
- Local home prices are declining (-3.0%/yr); year-one equity from $1k of loan paydown is wiped out by about $6k of value loss. Plan a longer hold.
Negotiation context
- It's been on market 55 days — a 3% lower offer ($192k) is reasonable based on typical stale-listing flexibility.
- 5 sale attempts since 11y ago with the ask held roughly flat each time — persistent listings suggest the price (not the market) is what's stuck; bring a comps-based counter.
- Current owner paid $98k; list at $198k implies a 102% gain — meaningful room to come down on a strong offer.
Risks & watch-outs
- Climate carrying-cost: severe wind risk, 80% chance of damaging wind over 30y; moderate wildfire risk; extreme-heat days projected 7→16/yr by 2055 (HVAC capex compounding) — expect insurance premiums to compound above CPI over the hold.
Questions for the listing agent
- It's been on market 55 days. Have you received any prior offers? Is the seller open to a 12% concession, seller financing, or rate buy-down credit?
- Built in 1964 — when were the roof, HVAC, electrical panel, plumbing, and water heater last replaced?
- Is there a deadline driving the sale (1031 exchange, divorce, estate, relocation)? That informs how much negotiation room exists.
- Crime grade is F in this area — have there been break-ins, vandalism, or insurance claims at this property in the last 3 years? What carrier currently insures it and at what premium?
- The area grade is low — what's the realistic commute time and amenity access for the typical tenant pool here? Any planned neighborhood developments (good or bad) we should know about?
- What's the average days-on-market for RENTAL listings here right now (not sales)? A rising rental-DOM trend means longer vacancies and softer asking-rent achievability than the comps imply.
- What's the recent tenant-quality profile in this submarket — average credit score on applications, eviction rate, late-payment / NSF rate, and stable-employment percentage? A property-management company in the area should have these aggregated.
- How much new for-sale + rental construction is in the pipeline within 1–3 miles? Heavy new supply typically softens prices + rents 12–24 months out; constrained supply supports both.
Investment metrics
- 1% rule
- 0.88% ✗
- Cap rate
- 6.54%
- Cash-on-cash
- 0.90%
- DSCR
- 1.04
- GRM
- 9.4
CMA / ARV
- ARV (on-the-fly)
- $206,006
- Comps found
- 11
Show comp detail 11 sales within ~0.75 mi
| Address | Dist | Beds/Ba | Sqft | Sold | Price | $/sf | Match |
|---|---|---|---|---|---|---|---|
| 2600 Hardin St | 0.49mi | 3/2.0 | 1,406 (-0%) | 15mo | $205,000 | $146 | 62 |
| 1509 E Mcelveen Ter | 0.36mi | 3/2.0 | 1,320 (-6%) | 14mo | $179,210 | $136 | 59 |
| 1172 Hannah Dr | 0.29mi | 3/2.0 | 1,528 (+8%) | 19mo | $233,000 | $152 | 55 |
| 1205 S Riverdale Ave | 0.52mi | 3/1.0 | 1,242 (-12%) | 4mo | $182,000 | $147 | 50 |
| 1147 Hallie Dr | 0.35mi | 3/2.0 | 1,622 (+15%) | 9mo | $249,000 | $154 | 49 |
| 1106 Beauvoir Dr | 0.47mi | 3/2.0 | 1,282 (-9%) | 15mo | $163,000 | $127 | 49 |
| 1145 Hannah Dr | 0.37mi | 4/2.0 (+1) | 1,601 (+14%) | 8mo | $228,000 | $142 | 46 |
| 2229 Pine Forest Dr | 0.48mi | 3/1.5 | 1,264 (-10%) | 20mo | $157,500 | $125 | 43 |
| 1014 Annelle Dr | 0.66mi | 3/2.0 | 1,550 (+10%) | 10mo | $210,000 | $135 | 42 |
| 1006 Hannah Dr | 0.61mi | 3/2.0 | 1,332 (-6%) | 23mo | $213,000 | $160 | 41 |
| 2500 Broad Dr | 0.46mi | 3/2.0 | 1,200 (-15%) | 18mo | $200,000 | $167 | 36 |
Match score weights: distance 35% · size 25% · config 20% · recency 20%. Top-matched comps best support the ARV.
Projected returns pro-forma
-3.0% appreciation · 6.97% rent growth · sell at horizon
- IRR
- -10.6%
- Equity multiple
- 0.60×
- Total profit
- $-22,157
- Equity at exit
- $29,522
- IRR
- 3.5%
- Equity multiple
- 1.30×
- Total profit
- $16,535
- Equity at exit
- $17,119
Cash invested: $55,440 (down + closing). Projections, not guarantees.
Landlord ↔ Tenant lean methodology
- Overall (STATE)
- 90 Strongly Landlord-Friendly
- State South Carolina
- 90 Strongly Landlord-Friendly · R+6
- County
- — inherits STATE
- City
- — inherits STATE
ZIP-level market 29505
- Rents YoY
- 7.0%
- Active inventory
- 185
- Price-to-rent
- 9.4×
Monthly cashflow live
- Estimated rent
- $1,750 medium interval (Pro) →
- Mortgage (P&I)
- −$1,038
- Tax from tax record
- −$220 /mo · $2,645/yr
- Insurance
- −$82
- HOA
- −$0
- Vacancy / Maint / Mgmt
- −$368
- Net cashflow
- $42
Break-even live
Sensitivity live
| Price | -10% $154 | -5% $98 | +0% $42 | +5% $-14 | +10% $-71 |
|---|---|---|---|---|---|
| Rent | -10% $-97 | -5% $-28 | +0% $42 | +5% $111 | +10% $180 |
| Rate | -1.0pp $141 | -0.5pp $92 | base $42 | +0.5pp $-10 | +1.0pp $-62 |
UW: 25.0% down · 7.5% · 30yr · 1.5% tax · 5.0% vac · 8.0% maint · 8.0% mgmt
Financing live
Cash to close
- Down payment
- $49,500
- Closing costs
- $5,940
- Reserves months
- —
- Total cash needed
- —
Loan-product check · same deal, 3 products live
Conventional
25% down · 7.5% · 30yr
- Down + closing
- —
- Monthly P&I
- —
- Monthly cashflow
- —
- DSCR
- —
- Eligible?
- —
Personal DTI + credit; lowest rate.
DSCR
20% down · 8.5% · 30yr
- Down + closing
- —
- Monthly P&I
- —
- Monthly cashflow
- —
- DSCR
- —
- Eligible?
- —
No personal income docs; deal must DSCR.
Hard money
10% down · 12.0% · 12mo
- Down + closing
- —
- Monthly P&I
- —
- Monthly cashflow
- —
- DSCR
- —
- Eligible?
- —
Short-term bridge; refi at stabilization.
Listing history 29 events
-
2026-06-22days on market $198,000 Active 55 DOM
-
2026-06-19days on market $198,000 Active 53 DOM
-
2026-06-18days on market $198,000 Active 52 DOM
-
2026-06-17days on market $198,000 Active 51 DOM
-
2026-06-16days on market $198,000 Active 50 DOM
-
2026-06-15days on market $198,000 Active 49 DOM
-
2026-06-14days on market $198,000 Active 47 DOM
-
2026-06-13days on market $198,000 Active 46 DOM
-
2026-06-10days on market $198,000 Active 44 DOM
-
2026-06-09days on market $198,000 Active 43 DOM
-
2026-06-08days on market $198,000 Active 42 DOM
-
2026-06-07days on market $198,000 Active 41 DOM
-
2026-06-05days on market $198,000 Active 38 DOM
-
2026-06-02days on market $198,000 Active 36 DOM
-
2026-06-01days on market $198,000 Active 35 DOM
-
2026-05-31days on market $198,000 Active 34 DOM
-
2026-05-30days on market $198,000 Active 33 DOM
-
2026-05-19price $198,000
-
2026-04-27$199,900 Active
-
2025-06-04historical $1,400
-
2025-05-22price $165,000
-
2025-05-06$1,400
-
2025-03-31price $175,000
-
2025-03-14price $185,000
-
2025-02-19$189,900 Active
-
2024-09-04$199,900 Active
-
2016-03-22soldstatus $98,000
-
2016-03-18soldstatus
-
2015-06-02$99,900
ⓘ Source: listings_history table (triggers on properties + properties_extension) + one-shot
backfill from property_details.listing_events for pre-trigger history.
Tax reassessment forecast SC · Resets to sale price
- Current annual tax
- $2,645 · $220/mo
- Projected year-2 tax
- $2,645 · $220/mo
- Expected delta
- $0/yr ($0/mo · 0.0%)
ⓘ Screening estimate from a state-policy table — verify with the county assessor before closing.
Climate risk First Street
- Flood 1/10 Low FEMA zone X (unshaded) · 0% chance over 30 yrs
- Wildfire 5/10 Major
- Heat 7/10 Severe 7 d/yr ≥108°F today · 16 d/yr by 30 yrs out
- Wind 8/10 Severe 80% chance of damaging wind over 30 yrs
- Air quality 1/10 Low 0 unhealthy d/yr today · 0 by 30 yrs out
Nearby sold comps map
Loading sold comps map…
Walkable amenities ~0.75 mi
Loading nearby amenities…
Taxation est. · year 1
- Rental income
- $21,004
- − Mortgage interest
- −$11,091
- − Property taxes
- −$2,645
- − Insurance
- −$990
- − Repairs & maintenance
- −$1,680
- − Management
- −$1,680
- − Depreciation
- −$5,760
- Taxable loss
- −$2,842
- Est. tax savings @ 24.0%
- +$682
- After-tax cash flow
- $1,181/yr
For passive investors: Depreciation is non-cash, so a rental often shows a tax loss while cash-flowing — sheltering income. Rental losses are passive: they offset passive income freely, and up to $25,000/yr can offset ordinary (W-2) income if you actively participate and your MAGI is under $100k (phasing out to $0 by $150k); unused losses carry forward. On sale, claimed depreciation is recaptured at up to 25%, and gains may owe capital-gains tax (a 1031 exchange can defer both). Figures are a year-1 estimate at your 24.0% rate — not tax advice; consult a CPA.
Schools (NCES district)
- District
- Florence 01
- NCES district ID
- 4502130
- Math proficiency
- 29% ▼ -10.00%
- Reading proficiency
- 47% ▬ 0.00%
- Median HH income
- $45,782
- Composite
- 32.36/100
- National rank
- #5737
- State rank
- #34 of 80 in SC
Livability — Florence
- Score
- 62/100
- State rank
- #196
- US rank
- #17076
Category grades
Schools grade is shown separately in the Schools card above.
Census & demographics
- County
- Florence County · 93,345 people
- City population
- 93,345
- Metro
- Florence, SC
- Population (ZIP)
- 23,895
- Household income
- $67,343
- Rent vs Own
- Severe rent burden
- 559.0
Population outlook (Florence County) Hauer SSP2
- Today (2025)
- 141,714 people
- By 2030
- 142,121 · +0.3%
- By 2040
- 141,344 · -0.3%
- By 2050
- 139,478 · -1.6%
- By 2075
- 132,275 · -6.7%
- By 2100
- 118,374 · -16.5%
Race, ethnicity, and origin ACS 2023
- Neighborhood character
- Diverse neighborhood (Simpson 0.57)
- Race & ethnicity
- White 53% Black 38% Hispanic / Latino 5% Two or more races 3% Asian 1%
- Common ancestry
- Slovak 2% Lithuanian 1% Serbian 1%
- Foreign-born
- 3% · Canada, China
- Languages at home
- 96% English-only · Spanish 2% Other Indo-European 1%
Political lean MEDSL · Florence
- 2024 margin
- Lean R (+8.0) · D 45.3% · R 53.3% · Other 1.3%
- 2008→2024 swing
- -4.8pp toward R · 2008: -3.2pp · 2024: -8.0pp
- All cycles
- 2024: R+8.0 2020: R+2.3 2016: R+5.0 2012: R+0.5 2008: R+3.2
Not yet ingested
- Civics
- —
Market trends
- HPI YoY
- ▼ -138.13%
- Current HPI
- 177.9352
- Rent YoY
- ▲ 6.97%
- Metro
- Florence, SC
- State GDP YoY
- ▲ 4.51%
- F500 in state
- 2
Industry mix (Fortune 500 HQ in SC)
| Industry | F500 HQs | Revenue |
|---|---|---|
| Packaging | 1 | $7B |
|
||
Price history
+98.2% since first listed12 events — show timeline
- 2026-05-19 Price Changed $198,000 RAGPD
- 2026-04-27 Listed $199,900 RAGPD
- 2025-06-04 Rental Removed $1,400 RAGPD
- 2025-05-22 Price Changed $165,000 RAGPD
- 2025-05-06 Listed for Rent $1,400 RAGPD
- 2025-03-31 Price Changed $175,000 RAGPD
- 2025-03-14 Price Changed $185,000 RAGPD
- 2025-02-19 Listed $189,900 RAGPD
- 2024-09-04 Listed $199,900 RAGPD
- 2016-03-22 Sold (Public Records) $98,000 Public Records
- 2016-03-18 Sold (MLS) — RAGPD
- 2015-06-02 Listed $99,900 RAGPD
Property tax history
+29.4%/yrLatest (2025): $2,645 · +3.3% YoY. Source: county tax records.
Cash-flow waterfall
monthlySold comps — $/sqft
last 12 mo · ≤1 miLoading sold comps…