 Multi-family
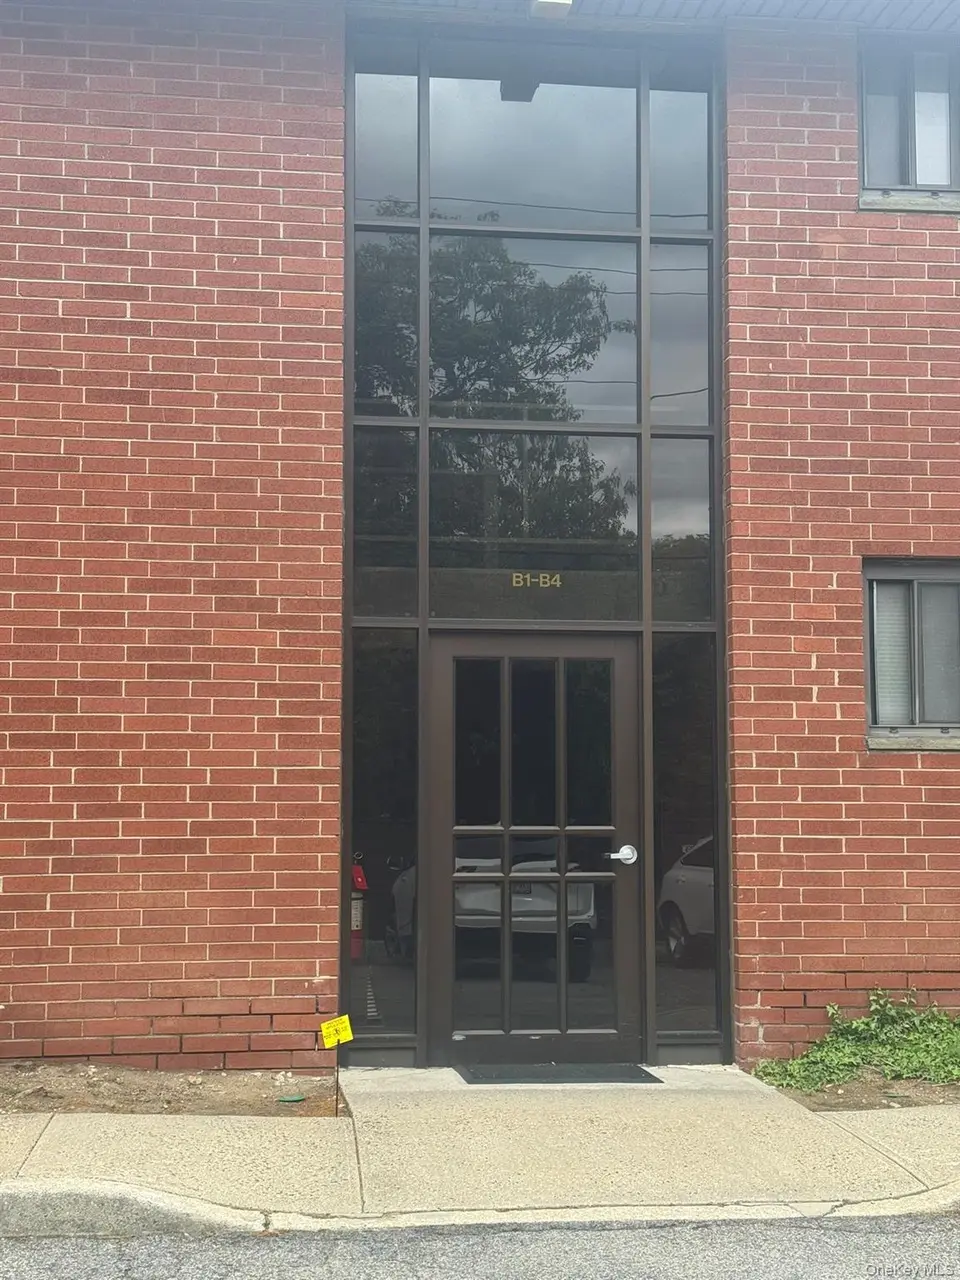
70 West St Unit B4 · Harrison, NY
Flood risk No data
- FEMA flood zone
- —
- Chance of flooding over 30 yrs
- —
- Est. flood insurance / yr
- —
Fire risk No data
- Est. fire insurance / yr
- —
Heat risk No data
- Hot days now (above threshold)
- —
- Hot days in 30 yrs
- —
Wind risk No data
- Chance of severe wind over 30 yrs
- —
Air-quality risk No data
- Unhealthy air days now
- —
- Unhealthy air days in 30 yrs
- —
Risk factors via First Street. Map © Google.
Why this score? — see what drove the B+ grade
The composite is a weighted blend of 9 inputs, each scored 0–100. Each bar is that input's sub-score; the figure is the points it added to the 100-point composite (weight × sub-score).
- Cash flow +30.0/30.0
- 1% rule +10.0/10.0
- DSCR +10.0/10.0
- ARV discount +7.5/15.0
- Schools +6.5/10.0
- Rent growth +4.9/5.0
- Livability +3.6/5.0
- Condition / age +2.5/5.0
- Appreciation +0.0/10.0
$250,000
🖨 Deal sheet 📄 Offer letter ✓ Due diligence
Multi-family units
County records classify this as Multi-Family (5+ Unit). Listing-text estimate: 1 unit. estimate disagrees with records
5+ unit building — per-unit beds/baths from public records are typically unavailable; the breakdown below (if shown) is an estimate from the listing text.
Listing remarks MLS
Spacious one bedroom second floor unit. Updated kitchen and bath with newer carpeting throughout. Large master bedroom (12x15) plus full wall closet. The large living/dining room (12.5x26) has ample space for entertaining. Both the BR and LR offer balcony access via new Andersen sliders. Monthly maintenance includes heat, hot water, cooking gas, water and one parking space directly across from the entry. Taxes W/O STAR. Convenient new laundry room. Walk to grocery, pharmacy, train and town.
Key facts
- $572 HOA
- Parking
- Built 1966
Tags
Property features AI
Finance
- Other: Living area reported by appraiser
- HOA & community: Association: Harrison House; Monthly association fee of $572; Association fee includes common area maintenance, exterior maintenance, gas, grounds care, heat, hot water, trash and water
Exterior
- Parking: Assigned parking (1 space); No carport
- Utilities: Con-Edison electric service; Public sewer; Electricity connected; Water connected; Sewer connected; Public trash collection
- Home design: Condominium; Fixer condition
- Construction: Brick construction
- Exterior features: Juliet balcony
Interior
- Kitchen: Dishwasher; Oven; Refrigerator
- Bedrooms: 3 rooms total
- Bathrooms: 1 full bathroom
- Heating & cooling: Hot air heating (natural gas); No cooling
- Interior features: Primary bathroom; Two stories; Entry on second level; No basement; No attic
Neighborhood map
What this means for you Summary
Snapshot
- This is a 1-bed/1.0-bath multifamily listed at $250k.
Deal economics
- At list price, monthly cash flow is $2k ($27k/yr) — positive.
- The deal already cash-flows at list — no discount required.
- Meets the 1% rule at list price ($6k rent vs $250k).
- Cap rate 17.1% vs local median 2.2% in Harrison — top-decile yield for the area; either an underpriced asset or a hidden risk that comps aren't pricing in. Stress-test before assuming the spread holds.
Location & tenants
- Location reads 72/100 on livability (#355 in NY) — a middle-class / working-renter tenant base. Strengths: commute A+, employment A+, crime A; Watch: housing C-, amenities F, cost of living F.
- Harrison Central School District (suburban): math 69% / reading 72% proficiency, ranked #92 of 590 in NY (top 16%) — strong family-tenant draw, lease renewals of 3-5y typical; only 10% free/reduced lunch — higher-income household profile.
- Zoned schools: Parsons Memorial School (math 71% / reading 62%, grade B+, #575 of 2,108 statewide, top 27%, 488 students, 24% FRL); Louis M Klein Middle School (math 51% / reading 71%, grade B+, #150 of 729 statewide, top 21%, 824 students, 22% FRL); Harrison High School (math 96%, 1,064 students, 21% FRL).
- Market conditions: Rents rising fast (+9.7%/yr); 62 active listings in the ZIP; 18 comparable units currently listed for rent nearby; rentals lingering (median 44d on market — plan ~5-8 weeks vacancy on turnover, expect pricing pressure); 50% of comp listings sitting > 30 days — soft ceiling on asking rent; high-income renter base; 954 units permitted in Westchester County in 2024 (649 in 5+ unit buildings).
- At $5,849/mo this rent would consume 45% of the median local household income ($154k/yr) (locally 461% of renters already pay >50% of income on rent) — very limited rent-growth headroom before tenants either downsize or default.
Forward outlook
- Local home prices are declining (-3.0%/yr); year-one equity from $2k of loan paydown is wiped out by about $8k of value loss. Plan a longer hold.
- Westchester County population projected at +10% by 2050 — modest demand growth; plan on rents tracking national, not racing it.
- At projected returns (-3.0% appreciation + 8.0% rent growth), your $70k cash investment doubles in ~3 years — after that, you're playing with house money.
Negotiation context
- Only 9 days on market — expect competitive offers; lowballing is unlikely to land.
- 6 sale attempts since 14y ago with the ask held roughly flat each time — persistent listings suggest the price (not the market) is what's stuck; bring a comps-based counter.
Questions for the listing agent
- Built in 1966 — when were the roof, HVAC, electrical panel, plumbing, and water heater last replaced?
- What does the HOA fee cover, when was the last increase, and are there any pending special assessments or reserve-fund shortfalls?
- Is there a deadline driving the sale (1031 exchange, divorce, estate, relocation)? That informs how much negotiation room exists.
- Schools are A-rated — typically a magnet for longer-tenancy family renters. What's the average tenant stay here, and is there a school-zone premium baked into asking?
- What's the average days-on-market for RENTAL listings here right now (not sales)? A rising rental-DOM trend means longer vacancies and softer asking-rent achievability than the comps imply.
- What's the recent tenant-quality profile in this submarket — average credit score on applications, eviction rate, late-payment / NSF rate, and stable-employment percentage? A property-management company in the area should have these aggregated.
- How much new apartment / multifamily construction is in the pipeline within 1–3 miles? Heavy new supply (>2% of stock underway) typically softens rents 12–24 months out; light construction supports rent growth.
Investment metrics
- 1% rule
- 2.34% ✓
- Cap rate
- 17.12%
- Cash-on-cash
- 38.65%
- DSCR
- 2.72
- GRM
- 3.6
CMA / ARV
No comps found within radius.
Projected returns pro-forma
-3.0% appreciation · 8.0% rent growth · sell at horizon
- IRR
- 41.3%
- Equity multiple
- 2.92×
- Total profit
- $134,486
- Equity at exit
- $37,276
- IRR
- 50.2%
- Equity multiple
- 7.35×
- Total profit
- $444,663
- Equity at exit
- $21,615
Cash invested: $70,000 (down + closing). Projections, not guarantees.
Landlord ↔ Tenant lean methodology
- Overall (STATE)
- 15 Strongly Tenant-Friendly
- State New York
- 15 Strongly Tenant-Friendly · D+10
- County
- — inherits STATE
- City
- — inherits STATE
ZIP-level market 10528
- Home prices YoY
- -18.4%
- Rents YoY
- 9.7%
- Active inventory
- 62
- Price-to-rent
- 7.1×
Monthly cashflow live
- Estimated rent
- $5,849 medium interval (Pro) →
- Mortgage (P&I)
- −$1,311
- Tax from tax record
- −$379 /mo · $4,545/yr
- Insurance
- −$104
- HOA
- −$572
- Vacancy / Maint / Mgmt
- −$1,228
- Net cashflow
- $2,255
Break-even live
2-unit breakdown (identical units grouped — click to expand)
| Units | Beds | Baths | Est. rent |
|---|---|---|---|
| 2× units | 1 | 1 | $5,848 |
| #1 | 1 | 1 | $2,924 |
| #2 | 1 | 1 | $2,924 |
| Total (2 units) | $5,849 | ||
UW: 25.0% down · 7.5% · 30yr · 1.5% tax · 5.0% vac · 8.0% maint · 8.0% mgmt
Financing live
Cash to close
- Down payment
- $62,500
- Closing costs
- $7,500
- Reserves months
- —
- Total cash needed
- —
Loan-product check · same deal, 3 products live
Conventional
25% down · 7.5% · 30yr
- Down + closing
- —
- Monthly P&I
- —
- Monthly cashflow
- —
- DSCR
- —
- Eligible?
- —
Personal DTI + credit; lowest rate.
DSCR
20% down · 8.5% · 30yr
- Down + closing
- —
- Monthly P&I
- —
- Monthly cashflow
- —
- DSCR
- —
- Eligible?
- —
No personal income docs; deal must DSCR.
Hard money
10% down · 12.0% · 12mo
- Down + closing
- —
- Monthly P&I
- —
- Monthly cashflow
- —
- DSCR
- —
- Eligible?
- —
Short-term bridge; refi at stabilization.
Rent comps 18 comps
| Address | Beds | Baths | Sqft | Rent | $/sqft | DOM | Units | Dist |
|---|---|---|---|---|---|---|---|---|
| 57 West St Unit 1 Harrison, NY | 1.0 | 1.0 | 826 | $2,835 | $3.43 | 24d | 1 | 0.12mi |
| 1408 Henry Ave #1 Mamaroneck, NY | 2.0 | 1.0 | 850 | $3,200 | $3.76 | 44d | 1 | 0.25mi |
| 501 N Barry Ave Unit 2F Mamaroneck, NY | 1.0 | 1.0 | 600 | $2,150 | $3.58 | 44d | 1 | 0.43mi |
| 538 Jefferson Ave Mamaroneck, NY | 1.0 | 1.0 | 600 | $2,100 | $3.50 | 44d | 1 | 0.51mi |
| 74 Nelson Ave Apt 4 Harrison, NY | 2.0 | 1.0 | 914 | $4,500 | $4.92 | 44d | 1 | 0.78mi |
| 74 Nelson Ave Apt 1 Harrison, NY | 2.0 | 1.0 | 900 | $4,000 | $4.44 | 44d | 1 | 0.78mi |
| 416 Tompkins Ave Unit SECOND FLOOR Mamaroneck, NY | 2.0 | 1.0 | 1100 | $3,800 | $3.45 | 44d | 1 | 0.82mi |
| 48 Oakland Ave Harrison, NY | 2.0 | 1.0 | 1000 | $3,000 | $3.00 | 24d | 1 | 0.83mi |
| 746 Mamaroneck Ave Mamaroneck, NY | 1.0–2.0 | 1.0–2.0 | 974 | $3,665 | $3.76 | 1d | 16 | 0.88mi |
| 18 Grand St Mamaroneck, NY | 1.0 | 1.0 | 790 | $3,025 | $3.83 | 21d | 1 | 0.89mi |
| 332 Halstead Ave Harrison, NY | 1.0–3.0 | 1.0–3.0 | 1116 | $5,000 | $4.48 | 1d | 1 | 0.90mi |
| 172 E Prospect Ave Unit 304 Mamaroneck, NY | 1.0 | 2.0 | 925 | $3,620 | $3.91 | 44d | 1 | 0.96mi |
| 225 Stanley Ave #313 Mamaroneck, NY | 1.0 | 1.0 | 825 | $3,500 | $4.24 | 24d | 1 | 1.06mi |
| 338 Palmer Ave Unit B Mamaroneck, NY | 2.0 | 1.0 | 900 | $3,700 | $4.11 | 24d | 1 | 1.15mi |
| 550 Halstead Ave Harrison, NY | — | 1.0 | 550 | $2,400 | $4.36 | 3d | 1 | 1.16mi |
| 300 Livingston Ave Unit 3E Mamaroneck, NY | 1.0 | 1.0 | 946 | $3,600 | $3.81 | 44d | 1 | 1.23mi |
| 560 Halstead Ave Unit 3L Harrison, NY | 1.0 | 1.0 | 691 | $2,950 | $4.27 | 15d | 1 | 1.24mi |
| 412 Munro Ave Apt 3F Mamaroneck, NY | 1.0 | 1.0 | 750 | $2,950 | $3.93 | 44d | 1 | 1.31mi |
HOA detail
- Monthly dues
- $572 · $6,864/yr
- Likely covers
- watergas
Listing history 8 events
-
2026-06-09days on market $250,000 Active 9 DOM
-
2026-06-08days on market $250,000 Active 8 DOM
-
2026-06-07days on market $250,000 Active 7 DOM
-
2026-06-04days on market $250,000 Active 4 DOM
-
2026-06-03days on market $250,000 Active 3 DOM
-
2026-06-02days on market $250,000 Active 2 DOM
-
2026-06-01remarks 124-char remark
-
2026-06-01$250,000 Active 1 DOM
ⓘ Source: listings_history table (triggers on properties + properties_extension) + one-shot
backfill from property_details.listing_events for pre-trigger history.
Tax reassessment forecast NY · Partial reset (capped growth)
- Current annual tax
- $4,545 · $379/mo
- Projected year-2 tax
- $4,545 · $379/mo
- Expected delta
- $0/yr ($0/mo · 0.0%)
ⓘ Screening estimate from a state-policy table — verify with the county assessor before closing.
Nearby sold comps map
Loading sold comps map…
Walkable amenities ~0.75 mi
Loading nearby amenities…
Taxation est. · year 1
- Rental income
- $70,188
- − Mortgage interest
- −$14,004
- − Property taxes
- −$4,545
- − Insurance
- −$1,250
- − Repairs & maintenance
- −$5,615
- − Management
- −$5,615
- − HOA
- −$6,864
- − Depreciation
- −$7,273
- Taxable income
- $25,022
- Est. tax owed @ 24.0%
- −$6,005
- After-tax cash flow
- $21,052/yr
For passive investors: Depreciation is non-cash, so a rental often shows a tax loss while cash-flowing — sheltering income. Rental losses are passive: they offset passive income freely, and up to $25,000/yr can offset ordinary (W-2) income if you actively participate and your MAGI is under $100k (phasing out to $0 by $150k); unused losses carry forward. On sale, claimed depreciation is recaptured at up to 25%, and gains may owe capital-gains tax (a 1031 exchange can defer both). Figures are a year-1 estimate at your 24.0% rate — not tax advice; consult a CPA.
Schools (NCES district)
- District
- Harrison Central School District
- NCES district ID
- 3613740
- Math proficiency
- 69% ▼ -6.00%
- Reading proficiency
- 72% ▲ 6.00%
- Median HH income
- $105,919
- Composite
- 65.12/100
- National rank
- #497
- State rank
- #92 of 590 in NY
Livability — Harrison
- Score
- 72/100
- State rank
- #355
- US rank
- #5963
Category grades
Schools grade is shown separately in the Schools card above.
Census & demographics
- Census place
- Harrison, NY
- County
- Westchester County · 709,332 people
- City population
- 14,091
- Metro
- New York-Newark-Jersey City, NY-NJ-PA
- Population (ZIP)
- 14,091
- Household income
- $154,416
- Rent vs Own
- Severe rent burden
- 461.0
Population outlook (Westchester County) Hauer SSP2
- Today (2025)
- 1,028,035 people
- By 2030
- 1,051,636 · +2.3%
- By 2040
- 1,098,520 · +6.9%
- By 2050
- 1,136,044 · +10.5%
- By 2075
- 1,196,925 · +16.4%
- By 2100
- 1,175,147 · +14.3%
Race, ethnicity, and origin ACS 2023
- Neighborhood character
- Predominantly White (68%)
- Race & ethnicity
- White 68% Hispanic / Latino 16% Asian 10% Two or more races 5% Black 3%
- Hispanic origin (detail)
- Puerto Rican 4% Salvadoran 1%
- Common ancestry
- Lithuanian 3% Romanian 2% Scotch-Irish 2%
- Foreign-born
- 23% · Canada, Dominican Republic, China
- Languages at home
- 70% English-only · Spanish 11% Other Indo-European 8% Other Asian/Pacific 7%
Political lean MEDSL · Westchester
- 2024 margin
- Strong D (+26.3) · D 63.1% · R 36.9%
- 2008→2024 swing
- -1.3pp toward R · 2008: 27.6pp · 2024: 26.3pp
- All cycles
- 2024: D+26.3 2020: D+36.3 2016: D+32.8 2012: D+22.2 2008: D+27.6
Not yet ingested
- Civics
- —
Market trends
- HPI YoY
- ▼ -66.61%
- Current HPI
- 296.3824
- Rent YoY
- ▲ 9.65%
- Metro
- New York-Newark-Jersey City, NY-NJ-PA
- State GDP YoY
- ▲ 2.60%
- F500 in state
- 92
Industry mix (Fortune 500 HQ in NY)
| Industry | F500 HQs | Revenue |
|---|---|---|
| Financial Services | 10 | $950B |
|
||
| Consumer Goods | 9 | $162B |
|
||
| Insurance | 4 | $225B |
|
||
| Telecommunications | 2 | $144B |
|
||
| Pharmaceuticals | 2 | $112B |
|
||
| Media / Entertainment | 2 | $69B |
|
||
Price history
+124.2% since first listed19 events — show timeline
- 2026-05-31 Listed $250,000 OneKey® MLS as Distributed by MLS Grid
- 2013-11-20 Sold (Public Records) $225,000 Public Records
- 2013-11-12 Sold (MLS) $225,000 HGMLS
- 2013-11-12 Sold (MLS) $225,000 OneKey® MLS as Distributed by MLS Grid
- 2013-10-23 Delisted — HGMLS
- 2013-09-27 Contingent — HGMLS
- 2013-09-09 Relisted — HGMLS
- 2013-09-09 Price Changed $225,000 HGMLS
- 2013-06-28 Delisted — HGMLS
- 2013-06-26 Price Changed $235,000 HGMLS
- 2013-04-29 Listed $245,000 HGMLS
- 2013-04-29 Listed $225,000 OneKey® MLS as Distributed by MLS Grid
- 2013-04-01 Delisted — HGMLS
- 2013-03-31 Listing Removed — OneKey® MLS as Distributed by MLS Grid
- 2013-02-20 Price Changed — HGMLS
- 2013-01-03 Price Changed — HGMLS
- 2012-10-04 Listed — HGMLS
- 2012-10-04 Listed $235,000 OneKey® MLS as Distributed by MLS Grid
- 1993-11-16 Sold (Public Records) $111,500 Public Records
Property tax history
+0.7%/yrLatest (2025): $4,545 · -8.7% YoY. Source: county tax records.
Cash-flow waterfall
monthlySold comps — $/sqft
last 12 mo · ≤1 miLoading sold comps…