 Triplex
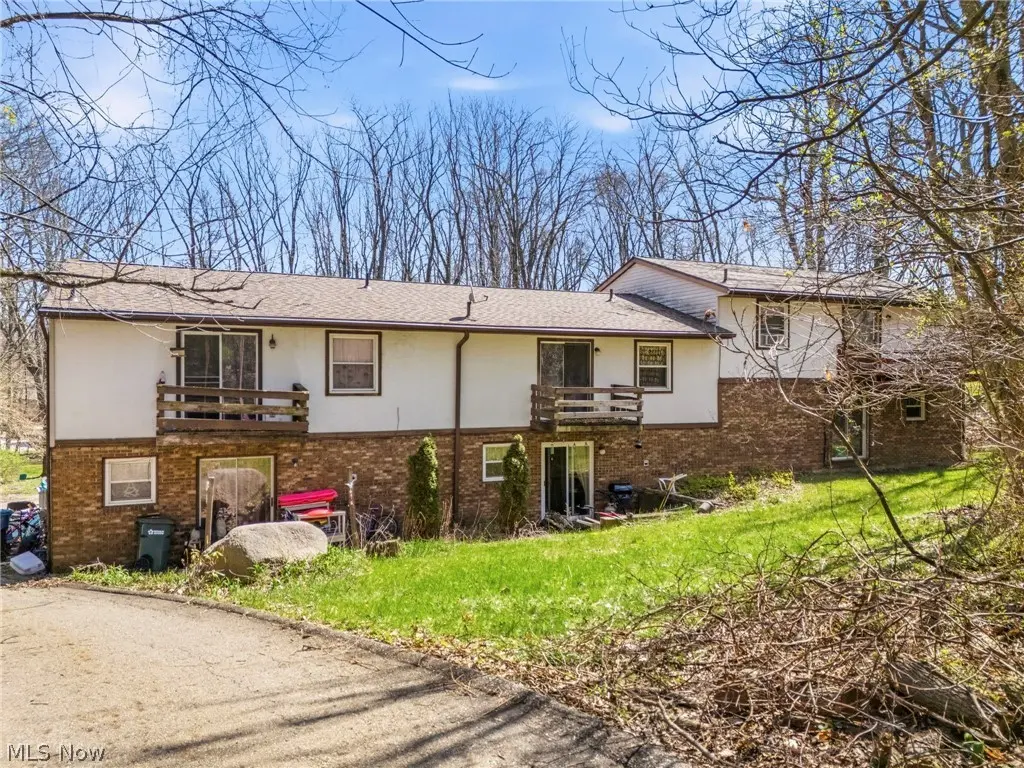
4839 Arlington Rd · Green, OH
Flood risk 1/10 · Minimal
- FEMA flood zone
- X (unshaded)
- Chance of flooding over 30 yrs
- 0.0%
- Est. flood insurance / yr
- $473 – $860
Fire risk 2/10 · Minimal
- Est. fire insurance / yr
- $713 – $1,323
Heat risk 3/10 · Minor
- Hot days now (above 97°F)
- 7 days/yr
- Hot days in 30 yrs
- 17 days/yr
Wind risk 1/10 · Minimal
- Chance of severe wind over 30 yrs
- —
Air-quality risk 2/10 · Minimal
- Unhealthy air days now
- 0 days/yr
- Unhealthy air days in 30 yrs
- 1 days/yr
Risk factors via First Street. Map © Google.
Why this score? — see what drove the B grade
The composite is a weighted blend of 9 inputs, each scored 0–100. Each bar is that input's sub-score; the figure is the points it added to the 100-point composite (weight × sub-score).
- Cash flow +30.0/30.0
- DSCR +10.0/10.0
- 1% rule +9.8/10.0
- ARV discount +7.5/15.0
- Schools +6.4/10.0
- Livability +4.4/5.0
- Rent growth +2.7/5.0
- Condition / age +2.5/5.0
- Appreciation +0.0/10.0
$339,900
🖨 Deal sheet (PDF) 📄 Offer letter ✓ Due diligence
Multi-family units
County records classify this as Multi-Family (2-4 Unit). Listing-text estimate: 3 units. confirmed
Listing remarks
Great investment opportunity with solid upside potential, located in the highly rated Green Local School District! This triplex features three spacious units, each offering 3 bedrooms, 1.5 baths, and the convenience of private in-unit laundry. Unit C stands out with a cozy fireplace and exclusive basement access. Each unit is all electric and includes a 1-car garage, along with a small private patio area for outdoor enjoyment. The property does need some TLC, but it’s a fantastic value-add opportunity for investors or even an owner-occupant looking to build equity over time. Major improvements have already been taken care of, including a new commercial-grade septic system (2025) and a
Key facts
- Small private patio
- Cozy fireplace
- Roof replaced
Tags
Property features AI
Finance
- Financial info: Tenant pays all utilities, electricity, internet and trash collection; Two units reported collecting $725/month rent each (Units A and B); Unit C listed as leased
Exterior
- Parking: 3-car garage; Direct access parking; Unpaved parking
- Utilities: Well water; Septic sewer
- Home design: 2-story building; Single building with multiple units
- Construction: Brick and vinyl siding exterior; Fiberglass roof
- Exterior features: Rain gutters; Wooded lot
Interior
- Kitchen: Range; Refrigerator
- Bedrooms: Three 3-bedroom units (Units A, B and C)
- Bathrooms: Three full bathrooms; Three half bathrooms; Each unit listed with 2 total bathrooms
- Heating & cooling: Baseboard heating; Electric heating; Fireplace heating; Window air conditioning units
- Interior features: Unfinished basement; Wood-burning fireplace; Has view; 15 total rooms
- Laundry & utility: In-unit laundry
Neighborhood map
What this means for you Summary
Snapshot
- This is a 3 × 3.0-bed/1.5-bath units multifamily listed at $340k.
Deal economics
- At list price, monthly cash flow is $1k ($18k/yr) — positive. Per door: $489/mo.
- The deal already cash-flows at list — no discount required.
- Meets the 1% rule at list price ($5k rent vs $340k).
- Recommended offer: $330k (3.0% below list) — sets the bar for market timing.
- Cap rate 11.5% vs local median 2.7% in Green — top-decile yield for the area; either an underpriced asset or a hidden risk that comps aren't pricing in. Stress-test before assuming the spread holds.
Location & tenants
- Location reads 87/100 on livability (#31 in OH, #281 nationally) — a professional / high-income tenant draw. Strengths: schools A+, amenities A+, employment A+; Watch: commute F.
- Green Local (suburban): math 75% / reading 74% proficiency, ranked #90 of 656 in OH (top 14%) — strong family-tenant draw, lease renewals of 3-5y typical; only 18% free/reduced lunch — higher-income household profile.
- Market conditions: Rents flat; 226 active listings in the ZIP; solid renter incomes; 1,114 units permitted in Summit County in 2024 (397 in 5+ unit buildings).
- At $5,026/mo this rent would consume 73% of the median local household income ($83k/yr) (locally 1068% of renters already pay >50% of income on rent) — very limited rent-growth headroom before tenants either downsize or default.
Forward outlook
- Local home prices are declining (-3.0%/yr); year-one equity from $2k of loan paydown is wiped out by about $10k of value loss. Plan a longer hold.
- Summit County population projected to shrink 6% by 2050 — rents likely to lag national; underwrite the cash flow, not the appreciation.
- At projected returns (-3.0% appreciation + 0.8% rent growth), your $95k cash investment doubles in ~8 years — after that, you're playing with house money.
Negotiation context
- It's been on market 39 days — a 3% lower offer ($330k) is reasonable based on typical stale-listing flexibility.
- 6 sale attempts since 5y ago with the ask held roughly flat each time — persistent listings suggest the price (not the market) is what's stuck; bring a comps-based counter.
- Current owner paid $200k; list at $340k implies a 70% gain — meaningful room to come down on a strong offer.
Questions for the listing agent
- It's been on market 39 days. Have you received any prior offers? Is the seller open to a 3% concession, seller financing, or rate buy-down credit?
- Can we see the unit-by-unit rent roll, current vacancy, and any below-market leases? What's the average tenancy length?
- What capital expenditures (roof, boiler, parking lot, exteriors) have been made in the last 5 years, and what's planned in the next 2?
- Built in 1979 — when were the roof, HVAC, electrical panel, plumbing, and water heater last replaced?
- Is there a deadline driving the sale (1031 exchange, divorce, estate, relocation)? That informs how much negotiation room exists.
- Schools are A-rated — typically a magnet for longer-tenancy family renters. What's the average tenant stay here, and is there a school-zone premium baked into asking?
- What's the average days-on-market for RENTAL listings here right now (not sales)? A rising rental-DOM trend means longer vacancies and softer asking-rent achievability than the comps imply.
- What's the recent tenant-quality profile in this submarket — average credit score on applications, eviction rate, late-payment / NSF rate, and stable-employment percentage? A property-management company in the area should have these aggregated.
- How much new apartment / multifamily construction is in the pipeline within 1–3 miles? Heavy new supply (>2% of stock underway) typically softens rents 12–24 months out; light construction supports rent growth.
Investment metrics
- 1% rule
- 1.48% ✓
- Cap rate
- 11.47%
- Cash-on-cash
- 18.49%
- DSCR
- 1.82
- GRM
- 5.6
CMA / ARV
No comps found within radius.
Projected returns pro-forma
-3.0% appreciation · 0.82% rent growth · sell at horizon
- IRR
- 7.6%
- Equity multiple
- 1.29×
- Total profit
- $27,708
- Equity at exit
- $50,680
- IRR
- 14.9%
- Equity multiple
- 2.08×
- Total profit
- $102,715
- Equity at exit
- $29,388
Cash invested: $95,172 (down + closing). Projections, not guarantees.
Landlord ↔ Tenant lean methodology
- Overall (STATE)
- 73 Landlord-Friendly
- State Ohio
- 73 Landlord-Friendly · R+6
- County
- — inherits STATE
- City
- — inherits STATE
ZIP-level market 44720
- Rents YoY
- 0.8%
- Active inventory
- 226
- Price-to-rent
- 16.9×
Monthly cashflow live
- Estimated rent
- $5,026 medium interval (Pro) →
- Mortgage (P&I)
- −$1,782
- Tax from tax record
- −$580 /mo · $6,959/yr
- Insurance
- −$142
- HOA
- −$0
- Vacancy / Maint / Mgmt
- −$1,055
- Net cashflow
- $1,467
Break-even live
Sensitivity live
| Price | -10% $1,659 | -5% $1,563 | +0% $1,467 | +5% $1,370 | +10% $1,274 |
|---|---|---|---|---|---|
| Rent | -10% $1,069 | -5% $1,268 | +0% $1,467 | +5% $1,665 | +10% $1,864 |
| Rate | -1.0pp $1,638 | -0.5pp $1,553 | base $1,467 | +0.5pp $1,378 | +1.0pp $1,289 |
3-unit breakdown (identical units grouped — click to expand)
| Units | Beds | Baths | Est. rent |
|---|---|---|---|
| 3× units | 3.0 | 1.5 | $5,025 |
| #1 | 3.0 | 1.5 | $1,675 |
| #2 | 3.0 | 1.5 | $1,675 |
| #3 | 3.0 | 1.5 | $1,675 |
| Total (3 units) | $5,026 | ||
UW: 25.0% down · 7.5% · 30yr · 1.5% tax · 5.0% vac · 8.0% maint · 8.0% mgmt
Financing live
Cash to close
- Down payment
- $84,975
- Closing costs
- $10,197
- Reserves months
- —
- Total cash needed
- —
Loan-product check · same deal, 3 products live
Conventional
25% down · 7.5% · 30yr
- Down + closing
- —
- Monthly P&I
- —
- Monthly cashflow
- —
- DSCR
- —
- Eligible?
- —
Personal DTI + credit; lowest rate.
DSCR
20% down · 8.5% · 30yr
- Down + closing
- —
- Monthly P&I
- —
- Monthly cashflow
- —
- DSCR
- —
- Eligible?
- —
No personal income docs; deal must DSCR.
Hard money
10% down · 12.0% · 12mo
- Down + closing
- —
- Monthly P&I
- —
- Monthly cashflow
- —
- DSCR
- —
- Eligible?
- —
Short-term bridge; refi at stabilization.
Listing history 10 events
-
2026-06-18days on market $339,900 Active 39 DOM
-
2026-06-17days on market $339,900 Active 38 DOM
-
2026-06-16days on market $339,900 Active 37 DOM
-
2026-06-15days on market $339,900 Active 36 DOM
-
2026-06-13days on market $339,900 Active 34 DOM
-
2026-06-12days on market $339,900 Active 33 DOM
-
2026-06-09days on market $339,900 Active 30 DOM
-
2026-06-08days on market $339,900 Active 29 DOM
-
2026-06-08remarks 693-char remark
-
2026-06-08$339,900 Active 28 DOM
ⓘ Source: listings_history table (triggers on properties + properties_extension) + one-shot
backfill from property_details.listing_events for pre-trigger history.
Tax reassessment forecast OH · Partial reset (capped growth)
- Current annual tax
- $6,959 · $580/mo
- Projected year-2 tax
- $6,959 · $580/mo
- Expected delta
- $0/yr ($0/mo · 0.0%)
ⓘ Screening estimate from a state-policy table — verify with the county assessor before closing.
Climate risk First Street
- Flood 1/10 Low FEMA zone X (unshaded) · 0% chance over 30 yrs
- Wildfire 2/10 Low
- Heat 3/10 Moderate 7 d/yr ≥97°F today · 17 d/yr by 30 yrs out
- Wind 1/10 Low
- Air quality 2/10 Low 0 unhealthy d/yr today · 1 by 30 yrs out
Nearby sold comps map
Loading sold comps map…
Walkable amenities ~0.75 mi
Loading nearby amenities…
Taxation est. · year 1
- Rental income
- $60,312
- − Mortgage interest
- −$19,040
- − Property taxes
- −$6,959
- − Insurance
- −$1,700
- − Repairs & maintenance
- −$4,825
- − Management
- −$4,825
- − Depreciation
- −$9,888
- Taxable income
- $13,076
- Est. tax owed @ 24.0%
- −$3,138
- After-tax cash flow
- $14,460/yr
For passive investors: Depreciation is non-cash, so a rental often shows a tax loss while cash-flowing — sheltering income. Rental losses are passive: they offset passive income freely, and up to $25,000/yr can offset ordinary (W-2) income if you actively participate and your MAGI is under $100k (phasing out to $0 by $150k); unused losses carry forward. On sale, claimed depreciation is recaptured at up to 25%, and gains may owe capital-gains tax (a 1031 exchange can defer both). Figures are a year-1 estimate at your 24.0% rate — not tax advice; consult a CPA.
Schools (NCES district)
- District
- Green Local
- NCES district ID
- 3905001
- Math proficiency
- 75% ▼ -9.00%
- Reading proficiency
- 74% ▼ -7.00%
- Median HH income
- $63,973
- Composite
- 64.45/100
- National rank
- #542
- State rank
- #90 of 656 in OH
Livability — Green
- Score
- 87/100
- State rank
- #31
- US rank
- #281
Category grades
Schools grade is shown separately in the Schools card above.
Census & demographics
- Census place
- Green, OH
- County
- Stark County · 272,865 people
- City population
- 50,124
- Metro
- Canton-Massillon, OH
- Population (ZIP)
- 39,851
- Household income
- $82,594
- Rent vs Own
- Severe rent burden
- 1068.0
Population outlook (Summit County) Hauer SSP2
- Today (2025)
- 546,583 people
- By 2030
- 544,028 · -0.5%
- By 2040
- 531,363 · -2.8%
- By 2050
- 514,923 · -5.8%
- By 2075
- 481,765 · -11.9%
- By 2100
- 432,265 · -20.9%
Race, ethnicity, and origin ACS 2023
- Neighborhood character
- Predominantly White (92%)
- Race & ethnicity
- White 92% Two or more races 3% Hispanic / Latino 2% Black 2% Asian 2%
- Common ancestry
- Romanian 5% Italian 4% Lithuanian 3%
- Foreign-born
- 3% · Canada, China
- Languages at home
- 97% English-only · Spanish 1% Other Indo-European 1%
Political lean MEDSL · Summit
- 2024 margin
- Lean D (+7.0) · D 53.0% · R 46.0%
- 2008→2024 swing
- -9.6pp toward R · 2008: 16.6pp · 2024: 7.0pp
- All cycles
- 2024: D+7.0 2020: D+9.6 2016: D+8.2 2012: D+14.8 2008: D+16.6
Not yet ingested
- Civics
- —
Market trends
- HPI YoY
- ▼ -218.69%
- Current HPI
- 215.4995
- Rent YoY
- ▲ 0.82%
- Metro
- Canton-Massillon, OH
- State GDP YoY
- ▲ 1.98%
- F500 in state
- 48
Industry mix (Fortune 500 HQ in OH)
| Industry | F500 HQs | Revenue |
|---|---|---|
| Insurance | 3 | $145B |
|
||
| Industrial Machinery | 3 | $49B |
|
||
| Financial Services | 3 | $24B |
|
||
| Consumer Goods | 2 | $93B |
|
||
| Aerospace / Defense | 2 | $47B |
|
||
| Utilities | 2 | $33B |
|
||
Price history
+151.8% since first listed15 events — show timeline
- 2026-05-19 Relisted — MLSNOW
- 2026-04-19 Pending — MLSNOW
- 2026-04-09 Listed $339,900 MLSNOW
- 2021-10-05 Pending — MLSNOW
- 2021-10-04 Relisted — MLSNOW
- 2021-10-03 Listing Removed — MLSNOW
- 2021-09-30 Listing Removed — MLSNOW
- 2021-09-14 Relisted — MLSNOW
- 2021-08-30 Pending — MLSNOW
- 2021-07-26 Price Changed $319,900 MLSNOW
- 2021-07-02 Relisted — MLSNOW
- 2021-06-26 Pending — MLSNOW
- 2021-06-23 Listed $329,900 MLSNOW
- 2006-04-27 Sold (Public Records) $200,000 Public Records
- 1995-06-30 Sold (Public Records) $135,000 Public Records
Property tax history
+7.1%/yrLatest (2025): $6,959 · +0.4% YoY. Source: county tax records.
Cash-flow waterfall
monthlySold comps — $/sqft
last 12 mo · ≤1 miLoading sold comps…