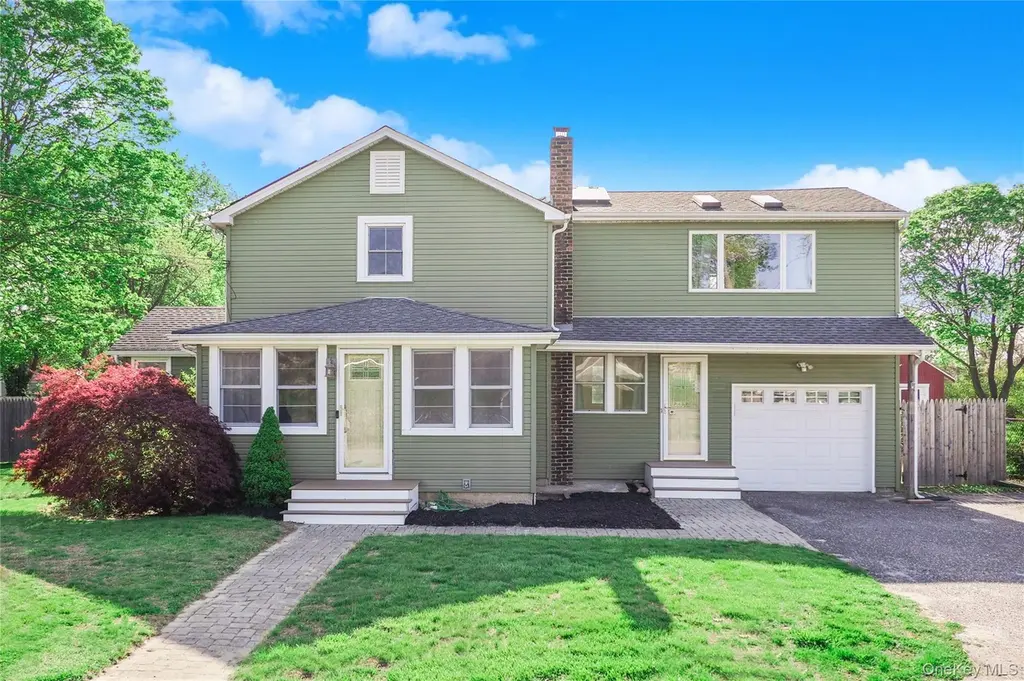
92 Fuoco Rd · North Bellport, NY
Flood risk 1/10 · Minimal
- FEMA flood zone
- X (unshaded)
- Chance of flooding over 30 yrs
- 0.0%
- Est. flood insurance / yr
- $473 – $860
Fire risk 2/10 · Minimal
- Est. fire insurance / yr
- $691 – $1,283
Heat risk 4/10 · Minor
- Hot days now (above 92°F)
- 7 days/yr
- Hot days in 30 yrs
- 18 days/yr
Wind risk 8/10 · Major
- Chance of severe wind over 30 yrs
- 80.0%
Air-quality risk 3/10 · Minor
- Unhealthy air days now
- 3 days/yr
- Unhealthy air days in 30 yrs
- 4 days/yr
Risk factors via First Street. Map © Google.
Why this score? — see what drove the B grade
The composite is a weighted blend of 9 inputs, each scored 0–100. Each bar is that input's sub-score; the figure is the points it added to the 100-point composite (weight × sub-score).
- Cash flow +30.0/30.0
- ARV discount +12.3/15.0
- 1% rule +10.0/10.0
- DSCR +10.0/10.0
- Schools +4.5/10.0
- Livability +3.1/5.0
- Rent growth +2.5/5.0
- Condition / age +2.5/5.0
- Appreciation +0.0/10.0
$549,000
🖨 Deal sheet 📄 Offer letter ✓ Due diligence
Listing remarks MLS
Farmhouse On Half Acre. New Siding Roofing, Windows. Low Low Taxes!! Great For First Time Buyers!, Additional information: Appearance:Good
Key facts
- Formal dining room
- Attached garage
- Large living room
Tags
Property features AI
Exterior
- Parking: Private parking; 1-car garage; No carport
- Utilities: Cesspool sewer; Cable available; Electricity connected; Water connected
- Home design: Single family residence; Living area per public records: 1542
- Construction: Frame construction
- Exterior features: Frame construction; Back yard fencing; Not waterfront
Interior
- Kitchen: Dishwasher; Electric oven; Refrigerator; Stainless steel appliances
- Bedrooms: 6 total rooms (bedroom count not specified)
- Bathrooms: 2 full bathrooms; 1 half bathroom
- Heating & cooling: Oil heating; Central air conditioning
- Interior features: Formal dining room; Washer/dryer hookup; Partial basement; Pull-down attic stairs; Solar energy generation
- Laundry & utility: Washer; Dryer; Washer/dryer hookup
Neighborhood map
What this means for you Summary
Snapshot
- This is a 3-bed/2.5-bath single-family listed at $549k.
Deal economics
- At list price, monthly cash flow is $10k ($118k/yr) — positive.
- The deal already cash-flows at list — no discount required.
- Meets the 1% rule at list price ($17k rent vs $549k).
- Cap rate 27.8% vs local median 4.9% in North Bellport — top-decile yield for the area; either an underpriced asset or a hidden risk that comps aren't pricing in. Stress-test before assuming the spread holds.
Location & tenants
- Location reads 62/100 on livability (#842 in NY) — a middle-class / working-renter tenant base. Strengths: employment A+, housing A+; Watch: crime C-, amenities F, commute F.
- South Country Central School District (suburban): math 50% / reading 44% proficiency, ranked #460 of 755 in NY (top 61%) — families likely to look elsewhere, expect single-tenant / working-renter base with shorter leases.
- Zoned schools: Kreamer Street Elementary School (math 24% / reading 24%, grade F, #1,846 of 2,108 statewide, top 91%, 290 students, 37% FRL); Bellport Middle School (math 64% / reading 54%, grade B, #161 of 729 statewide, top 24%, 838 students, 56% FRL); Bellport Senior High School (math 86% / reading 64%, grade A-, #630 of 1,100 statewide, top 57%, 1,392 students, 52% FRL).
- Market conditions: 57 active listings in the ZIP; 8 comparable units currently listed for rent nearby; rentals at typical pace (median 25d on market — plan ~3-4 weeks tenant-placement turnaround); 1,366 units permitted in Suffolk County in 2024 (216 in 5+ unit buildings).
Forward outlook
- Local home prices are declining (-3.0%/yr); year-one equity from $4k of loan paydown is wiped out by about $16k of value loss. Plan a longer hold.
- Suffolk County population projected to shrink 5% by 2050 — rents likely to lag national; underwrite the cash flow, not the appreciation.
- At projected returns (-3.0% appreciation + 3.0% rent growth), your $154k cash investment doubles in ~2 years — after that, you're playing with house money.
Negotiation context
- Only 12 days on market — expect competitive offers; lowballing is unlikely to land.
- 2 sale attempts since 9y ago with the ask held roughly flat each time — persistent listings suggest the price (not the market) is what's stuck; bring a comps-based counter.
- Current owner paid $280k; list at $549k implies a 96% gain — meaningful room to come down on a strong offer.
Risks & watch-outs
- Watch-outs: built in 1920 — expect roof / HVAC / electrical / plumbing capex.
- Climate carrying-cost: severe wind risk, 80% chance of damaging wind over 30y — expect insurance premiums to compound above CPI over the hold.
Questions for the listing agent
- Built in 1920 — when were the roof, HVAC, electrical panel, plumbing, and water heater last replaced?
- Is there a deadline driving the sale (1031 exchange, divorce, estate, relocation)? That informs how much negotiation room exists.
- Schools are F-rated, which usually means shorter tenancies and higher turnover. Who's the typical renter profile here, and what's been the actual vacancy rate?
- What's the average days-on-market for RENTAL listings here right now (not sales)? A rising rental-DOM trend means longer vacancies and softer asking-rent achievability than the comps imply.
- What's the recent tenant-quality profile in this submarket — average credit score on applications, eviction rate, late-payment / NSF rate, and stable-employment percentage? A property-management company in the area should have these aggregated.
- How much new for-sale + rental construction is in the pipeline within 1–3 miles? Heavy new supply typically softens prices + rents 12–24 months out; constrained supply supports both.
Investment metrics
- 1% rule
- 3.12% ✓
- Cap rate
- 27.80%
- Cash-on-cash
- 76.80%
- DSCR
- 4.42
- GRM
- 2.7
CMA / ARV
- ARV (median comp)
- $615,035
- List price
- $549,000
- Delta
- -10.74%
- Verdict
- UNDERPRICED
- Comps
- 20 within 1.0 mi
Show comp detail 12 sales within ~0.75 mi
| Address | Dist | Beds/Ba | Sqft | Sold | Price | $/sf | Match |
|---|---|---|---|---|---|---|---|
| 450 Munsell Rd | 0.27mi | 3/2.0 | 1,388 (-10%) | 1mo | $645,000 | $465 | 68 |
| 4 Danamarie Ln | 0.36mi | 3/1.5 | 1,722 (+12%) | 1mo | $770,000 | $447 | 59 |
| 805 Doane Ave | 0.72mi | 3/2.0 | 1,584 (+3%) | 3mo | $405,000 | $256 | 58 |
| 84 Country Club Rd | 0.64mi | 3/2.0 | 1,600 (+4%) | 6mo | $735,000 | $459 | 57 |
| 507 Scherger Ave | 0.35mi | 3/1.0 | 1,386 (-10%) | 9mo | $516,000 | $372 | 54 |
| 6 Danamarie Ln | 0.38mi | 3/2.5 | 1,765 (+14%) | 8mo | $796,000 | $451 | 52 |
| 522 Scherger Ave | 0.39mi | 4/2.5 (+1) | 1,756 (+14%) | 5mo | $550,000 | $313 | 50 |
| 641 (2122) Bourdois Ave | 0.35mi | 4/2.5 (+1) | 1,758 (+14%) | 10mo | $550,000 | $313 | 48 |
| 655 Bourdois Ave | 0.48mi | 4/2.5 (+1) | 1,758 (+14%) | 2mo | $499,000 | $284 | 47 |
| 661 Bourdois Ave | 0.49mi | 4/2.5 (+1) | 1,758 (+14%) | 8mo | $499,990 | $284 | 42 |
| 63 Beaver Dam Rd | 0.62mi | 3/2.0 | 1,719 (+12%) | 11mo | $555,000 | $323 | 41 |
| 83 Bieselin Rd | 0.58mi | 4/2.0 (+1) | 1,756 (+14%) | 8mo | $645,000 | $367 | 37 |
Match score weights: distance 35% · size 25% · config 20% · recency 20%. Top-matched comps best support the ARV.
Projected returns pro-forma
-3.0% appreciation · 3.0% rent growth · sell at horizon
- IRR
- 76.8%
- Equity multiple
- 4.50×
- Total profit
- $537,803
- Equity at exit
- $81,858
- IRR
- 80.4%
- Equity multiple
- 9.30×
- Total profit
- $1,275,925
- Equity at exit
- $47,467
Cash invested: $153,720 (down + closing). Projections, not guarantees.
Landlord ↔ Tenant lean methodology
- Overall (STATE)
- 15 Strongly Tenant-Friendly
- State New York
- 15 Strongly Tenant-Friendly · D+10
- County
- — inherits STATE
- City
- — inherits STATE
ZIP-level market 11713
- Home prices YoY
- -26.0%
- Active inventory
- 57
- Price-to-rent
- 2.7×
Monthly cashflow live
- Estimated rent
- $17,135 medium interval (Pro) →
- Mortgage (P&I)
- −$2,879
- Tax from tax record
- −$592 /mo · $7,100/yr
- Insurance
- −$229
- HOA
- −$0
- Vacancy / Maint / Mgmt
- −$3,598
- Net cashflow
- $9,838
Break-even live
UW: 25.0% down · 7.5% · 30yr · 1.5% tax · 5.0% vac · 8.0% maint · 8.0% mgmt
Financing live
Cash to close
- Down payment
- $137,250
- Closing costs
- $16,470
- Reserves months
- —
- Total cash needed
- —
Loan-product check · same deal, 3 products live
Conventional
25% down · 7.5% · 30yr
- Down + closing
- —
- Monthly P&I
- —
- Monthly cashflow
- —
- DSCR
- —
- Eligible?
- —
Personal DTI + credit; lowest rate.
DSCR
20% down · 8.5% · 30yr
- Down + closing
- —
- Monthly P&I
- —
- Monthly cashflow
- —
- DSCR
- —
- Eligible?
- —
No personal income docs; deal must DSCR.
Hard money
10% down · 12.0% · 12mo
- Down + closing
- —
- Monthly P&I
- —
- Monthly cashflow
- —
- DSCR
- —
- Eligible?
- —
Short-term bridge; refi at stabilization.
Rent comps 8 comps
| Address | Beds | Baths | Sqft | Rent | $/sqft | DOM | Units | Dist |
|---|---|---|---|---|---|---|---|---|
| 718 Provost Ave Bellport, NY | 4.0 | 1.0 | 1100 | $4,000 | $3.64 | 43d | 1 | 0.54mi |
| 91 Circuit Rd Bellport, NY | 3.0 | 1.5 | 1154 | $4,500 | $3.90 | 24d | 1 | 0.57mi |
| 262 N Dunton Ave East Patchogue, NY | 3.0 | 1.0 | 1778 | $3,900 | $2.19 | 13d | 1 | 0.77mi |
| 58 N Howells Point Rd Bellport, NY | 3.0 | 2.0 | 1404 | $15,000 | $10.68 | 19d | 1 | 0.84mi |
| 47 Station Rd Bellport, NY | 2.0 | 1.0 | 1104 | $3,500 | $3.17 | 43d | 1 | 0.99mi |
| 21 N Howells Point Rd Bellport, NY | 3.0 | 3.5 | 2148 | $20,000 | $9.31 | 1d | 1 | 1.09mi |
| 13 Colonial Ln Bellport, NY | 3.0 | 2.0 | 1872 | $20,000 | $10.68 | 19d | 1 | 1.15mi |
| 11 Bieselin Rd Bellport, NY | 4.0 | 2.0 | 1722 | $15,000 | $8.71 | 43d | 1 | 1.17mi |
Listing history 6 events
-
2026-05-06$549,000 Active
-
2017-08-08soldstatus $280,000
-
2017-07-31soldstatus $270,000 Closed 139-char remark
Show marketing remark (139 chars)
Farmhouse On Half Acre. New Siding Roofing, Windows. Low Low Taxes!! Great For First Time Buyers!, Additional information: Appearance:Good
-
2017-05-11status Under Contract 139-char remark
Show marketing remark (139 chars)
Farmhouse On Half Acre. New Siding Roofing, Windows. Low Low Taxes!! Great For First Time Buyers!, Additional information: Appearance:Good
-
2017-05-08$299,000 New 139-char remark
Show marketing remark (139 chars)
Farmhouse On Half Acre. New Siding Roofing, Windows. Low Low Taxes!! Great For First Time Buyers!, Additional information: Appearance:Good
-
2006-09-18soldstatus $350,000
ⓘ Source: listings_history table (triggers on properties + properties_extension) + one-shot
backfill from property_details.listing_events for pre-trigger history.
Tax reassessment forecast NY · Partial reset (capped growth)
- Current annual tax
- $7,100 · $592/mo
- Projected year-2 tax
- $8,189 · $682/mo
- Expected delta
- +$1,089/yr (+$91/mo · 15.3%)
ⓘ Screening estimate from a state-policy table — verify with the county assessor before closing.
Climate risk First Street
- Flood 1/10 Low FEMA zone X (unshaded) · 0% chance over 30 yrs
- Wildfire 2/10 Low
- Heat 4/10 Moderate 7 d/yr ≥92°F today · 18 d/yr by 30 yrs out
- Wind 8/10 Severe 80% chance of damaging wind over 30 yrs
- Air quality 3/10 Moderate 3 unhealthy d/yr today · 4 by 30 yrs out
Nearby sold comps map
Loading sold comps map…
Walkable amenities ~0.75 mi
Loading nearby amenities…
Taxation est. · year 1
- Rental income
- $205,626
- − Mortgage interest
- −$30,753
- − Property taxes
- −$7,100
- − Insurance
- −$2,745
- − Repairs & maintenance
- −$16,450
- − Management
- −$16,450
- − Depreciation
- −$15,971
- Taxable income
- $116,158
- Est. tax owed @ 24.0%
- −$27,878
- After-tax cash flow
- $90,174/yr
For passive investors: Depreciation is non-cash, so a rental often shows a tax loss while cash-flowing — sheltering income. Rental losses are passive: they offset passive income freely, and up to $25,000/yr can offset ordinary (W-2) income if you actively participate and your MAGI is under $100k (phasing out to $0 by $150k); unused losses carry forward. On sale, claimed depreciation is recaptured at up to 25%, and gains may owe capital-gains tax (a 1031 exchange can defer both). Figures are a year-1 estimate at your 24.0% rate — not tax advice; consult a CPA.
Schools (NCES district)
- District
- South Country Central School District
- NCES district ID
- 3600008
- Math proficiency
- 50% ▲ 4.00%
- Reading proficiency
- 44% ▲ 4.00%
- Median HH income
- $74,049
- Composite
- 44.75/100
- National rank
- #5960
- State rank
- #460 of 755 in NY
Livability — North Bellport
- Score
- 62/100
- State rank
- #842
- US rank
- #16345
Category grades
Schools grade is shown separately in the Schools card above.
Census & demographics
- Census place
- North Bellport, NY
- City population
- 9,236
- Population (ZIP)
- 9,236
Population outlook (Suffolk County) Hauer SSP2
- Today (2025)
- 1,505,262 people
- By 2030
- 1,498,318 · -0.5%
- By 2040
- 1,471,101 · -2.3%
- By 2050
- 1,424,848 · -5.3%
- By 2075
- 1,337,157 · -11.2%
- By 2100
- 1,217,720 · -19.1%
Race, ethnicity, and origin ACS 2023
- Neighborhood character
- Diverse neighborhood (Simpson 0.64)
- Race & ethnicity
- White 50% Hispanic / Latino 30% Black 14% Two or more races 10% Asian 2%
- Hispanic origin (detail)
- Mexican 2% Puerto Rican 3% Dominican 1%
- Common ancestry
- Romanian 4% Italian 1% Lithuanian 1%
- Foreign-born
- 23% · Canada, Jamaica, China
- Languages at home
- 72% English-only · Spanish 23% Other Indo-European 3%
Political lean MEDSL · Suffolk
- 2024 margin
- Lean R (+10.0) · D 45.0% · R 55.0%
- 2008→2024 swing
- -16.0pp toward R · 2008: 6.0pp · 2024: -10.0pp
- All cycles
- 2024: R+10.0 2020: R+0.0 2016: R+8.2 2012: D+2.9 2008: D+6.0
Not yet ingested
- Civics
- —
Market trends
- HPI YoY
- ▼ -148.23%
- Current HPI
- 421.2165
- Rent YoY
- —
- Metro
- —
- State GDP YoY
- ▲ 2.60%
- F500 in state
- 92
Industry mix (Fortune 500 HQ in NY)
| Industry | F500 HQs | Revenue |
|---|---|---|
| Financial Services | 10 | $950B |
|
||
| Consumer Goods | 9 | $162B |
|
||
| Insurance | 4 | $225B |
|
||
| Telecommunications | 2 | $144B |
|
||
| Pharmaceuticals | 2 | $112B |
|
||
| Media / Entertainment | 2 | $69B |
|
||
Price history
+56.9% since first listed7 events — show timeline
- 2026-05-20 Pending — OneKey® MLS as Distributed by MLS Grid
- 2026-05-06 Listed $549,000 OneKey® MLS as Distributed by MLS Grid
- 2017-08-08 Sold (Public Records) $280,000 Public Records
- 2017-07-31 Sold (MLS) $270,000 OneKey® MLS as Distributed by MLS Grid
- 2017-05-11 Pending — OneKey® MLS as Distributed by MLS Grid
- 2017-05-08 Listed $299,000 OneKey® MLS as Distributed by MLS Grid
- 2006-09-18 Sold (Public Records) $350,000 Public Records
Property tax history
+3.3%/yrLatest (2025): $7,100 · +0.0% YoY. Source: county tax records.
Cash-flow waterfall
monthlySold comps — $/sqft
last 12 mo · ≤1 miLoading sold comps…