2143 270th Ave · Nashville, MN
Flood risk 1/10 · Minimal
- FEMA flood zone
- X
- Chance of flooding over 30 yrs
- 0.0%
- Est. flood insurance / yr
- $507 – $1,088
Fire risk 1/10 · Minimal
- Est. fire insurance / yr
- $888 – $1,650
Heat risk 2/10 · Minimal
- Hot days now (above 100°F)
- 7 days/yr
- Hot days in 30 yrs
- 15 days/yr
Wind risk 2/10 · Minimal
- Chance of severe wind over 30 yrs
- —
Air-quality risk 1/10 · Minimal
- Unhealthy air days now
- 0 days/yr
- Unhealthy air days in 30 yrs
- 0 days/yr
Risk factors via First Street. Map © Google.
Why this score? — see what drove the B+ grade
The composite is a weighted blend of 9 inputs, each scored 0–100. Each bar is that input's sub-score; the figure is the points it added to the 100-point composite (weight × sub-score).
- Cash flow +30.0/30.0
- 1% rule +10.0/10.0
- DSCR +10.0/10.0
- Appreciation +10.0/10.0
- ARV discount +7.5/15.0
- Schools +3.9/10.0
- Rent growth +2.5/5.0
- Livability +2.5/5.0
- Condition / age +2.5/5.0
$59,900
🖨 Deal sheet 📄 Offer letter ✓ Due diligence
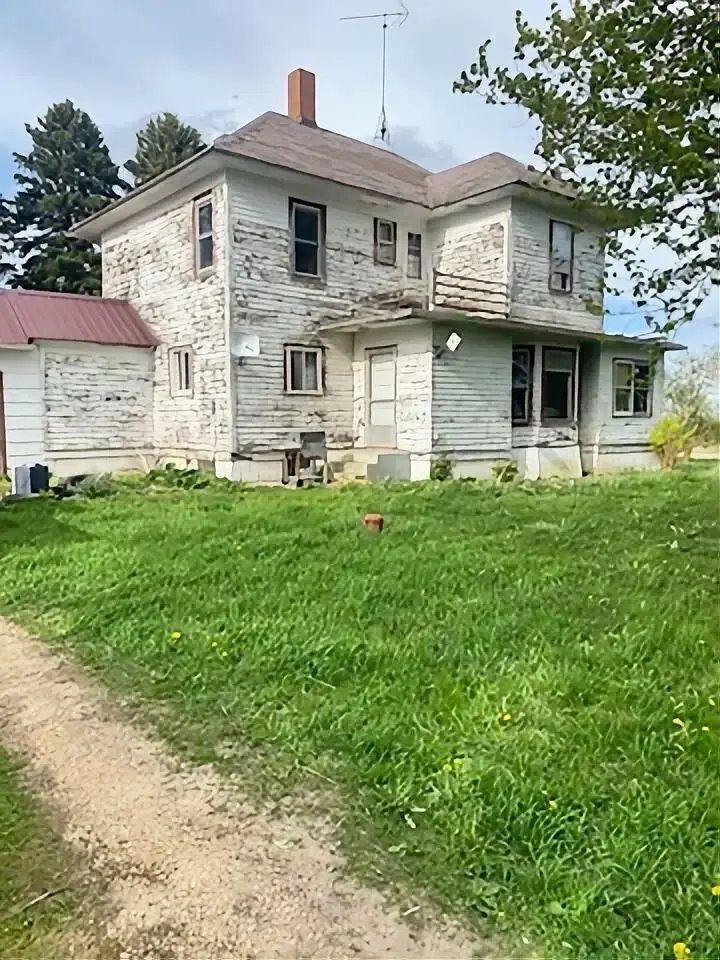
Listing remarks
Welcome to this charming home nestled on a spacious lot in Truman, MN. This property boasts a comfortable layout with multiple bedrooms and bathrooms, appropriate for various living arrangements. The interior features a living space, kitchen, and ample storage areas. Enjoy the serene outdoor environment with mature trees and room for gardening or recreation. A wonderful opportunity to own a piece of tranquility in a welcoming community. Don't miss the chance to see this inviting home!
Key facts
- Spacious lot
- Room for gardening
- Mature trees
Tags
Property features AI
Finance
- Other: Lot about 4.64 acres; Lot dimensions approximately 60 x 100; Total living area reported as 4,840 square feet; Main level finished area reported as 790
- Financial info: $1,130 annual tax (2025)
Exterior
- Parking: Open parking
- Utilities: Natural gas fuel; Water: other; Sewer: other
- Home design: Residential property; Two levels; Stone foundation
- Construction: Foundation area approximately 2,420; Above- and below-grade finished areas reported
- Exterior features: Wood exterior; No pool
Interior
- Kitchen: Kitchen on main level
- Bedrooms: 5 bedrooms (including multiple labeled bedrooms)
- Bathrooms: 1 full bathroom
- Heating & cooling: Forced air heating; Central air conditioning
- Interior features: Basement (other); Accessibility features (other)
Neighborhood map
What this means for you Summary
Snapshot
- This is a 5-bed/2.0-bath single-family listed at $60k.
Deal economics
- At list price, monthly cash flow is $733 ($9k/yr) — positive.
- The deal already cash-flows at list — no discount required.
- Meets the 1% rule at list price ($1k rent vs $60k).
- Recommended offer: $59k (1.5% below list) — sets the bar for market timing.
Location & tenants
- Location reads: area grade B — affects rentability + tenant quality, not the cash-flow math above.
- Truman Public School District (rural): math 30% / reading 55% proficiency, ranked #343 of 467 in MN (top 73%) — families likely to look elsewhere, expect single-tenant / working-renter base with shorter leases.
- Market conditions: 16 active listings in the ZIP; 19 units permitted in Martin County in 2024 (0 in 5+ unit buildings).
Forward outlook
- In year one you build about $6k of equity ($414 loan paydown + $6k appreciation (10.0% local appreciation)).
- Martin County population projected at -19% by 2050 — secular population decline; favor cash flow + early exit over multi-decade hold.
- At projected returns (10.0% appreciation + 3.0% rent growth), your $17k cash investment doubles in ~2 years — after that, you're playing with house money.
- By year 6, paydown + projected appreciation supports a ~$38k cash-out refi (75% LTV) — recoverable capital for the next deal without selling this one.
Negotiation context
- It's been on market 17 days — a 2% lower offer ($59k) is reasonable based on typical stale-listing flexibility.
Risks & watch-outs
- Watch-outs: built in 1911 — expect roof / HVAC / electrical / plumbing capex.
Questions for the listing agent
- Built in 1911 — when were the roof, HVAC, electrical panel, plumbing, and water heater last replaced?
- Is there a deadline driving the sale (1031 exchange, divorce, estate, relocation)? That informs how much negotiation room exists.
- What's the average days-on-market for RENTAL listings here right now (not sales)? A rising rental-DOM trend means longer vacancies and softer asking-rent achievability than the comps imply.
- What's the recent tenant-quality profile in this submarket — average credit score on applications, eviction rate, late-payment / NSF rate, and stable-employment percentage? A property-management company in the area should have these aggregated.
- How much new for-sale + rental construction is in the pipeline within 1–3 miles? Heavy new supply typically softens prices + rents 12–24 months out; constrained supply supports both.
Investment metrics
- 1% rule
- 2.46% ✓
- Cap rate
- 20.97%
- Cash-on-cash
- 52.43%
- DSCR
- 3.33
- GRM
- 3.4
CMA / ARV
No comps found within radius.
Projected returns pro-forma
10.0% appreciation · 3.0% rent growth · sell at horizon
- IRR
- 65.7%
- Equity multiple
- 5.73×
- Total profit
- $79,333
- Equity at exit
- $53,963
- IRR
- 59.3%
- Equity multiple
- 12.74×
- Total profit
- $196,984
- Equity at exit
- $116,373
Cash invested: $16,772 (down + closing). Projections, not guarantees.
Landlord ↔ Tenant lean methodology
- Overall (STATE)
- 46 Balanced
- State Minnesota
- 46 Balanced · D+2
- County
- — inherits STATE
- City
- — inherits STATE
ZIP-level market 56088
- Home prices YoY
- 6.4%
- Active inventory
- 16
- Price-to-rent
- 3.4×
Monthly cashflow live
- Estimated rent
- $1,476 medium interval (Pro) →
- Mortgage (P&I)
- −$314
- Tax from tax record
- −$94 /mo · $1,130/yr
- Insurance
- −$25
- HOA
- −$0
- Vacancy / Maint / Mgmt
- −$310
- Net cashflow
- $733
Break-even live
UW: 25.0% down · 7.5% · 30yr · 1.5% tax · 5.0% vac · 8.0% maint · 8.0% mgmt
Financing live
Cash to close
- Down payment
- $14,975
- Closing costs
- $1,797
- Reserves months
- —
- Total cash needed
- —
Loan-product check · same deal, 3 products live
Conventional
25% down · 7.5% · 30yr
- Down + closing
- —
- Monthly P&I
- —
- Monthly cashflow
- —
- DSCR
- —
- Eligible?
- —
Personal DTI + credit; lowest rate.
DSCR
20% down · 8.5% · 30yr
- Down + closing
- —
- Monthly P&I
- —
- Monthly cashflow
- —
- DSCR
- —
- Eligible?
- —
No personal income docs; deal must DSCR.
Hard money
10% down · 12.0% · 12mo
- Down + closing
- —
- Monthly P&I
- —
- Monthly cashflow
- —
- DSCR
- —
- Eligible?
- —
Short-term bridge; refi at stabilization.
Listing history 13 events
-
2026-06-18days on market $59,900 Active 17 DOM
-
2026-06-17days on market $59,900 Active 16 DOM
-
2026-06-16days on market $59,900 Active 15 DOM
-
2026-06-15days on market $59,900 Active 14 DOM
-
2026-06-13days on market $59,900 Active 12 DOM
-
2026-06-12days on market $59,900 Active 11 DOM
-
2026-06-09days on market $59,900 Active 8 DOM
-
2026-06-08days on market $59,900 Active 7 DOM
-
2026-06-07days on market $59,900 Active 6 DOM
-
2026-06-05days on market $59,900 Active 4 DOM
-
2026-06-04days on market $59,900 Active 2 DOM
-
2026-06-01remarks 489-char remark
-
2026-06-01$59,900 Active 1 DOM
ⓘ Source: listings_history table (triggers on properties + properties_extension) + one-shot
backfill from property_details.listing_events for pre-trigger history.
Tax reassessment forecast MN · Partial reset (capped growth)
- Current annual tax
- $1,130 · $94/mo
- Projected year-2 tax
- $1,130 · $94/mo
- Expected delta
- $0/yr ($0/mo · 0.0%)
ⓘ Screening estimate from a state-policy table — verify with the county assessor before closing.
Climate risk First Street
- Flood 1/10 Low FEMA zone X · 0% chance over 30 yrs
- Wildfire 1/10 Low
- Heat 2/10 Low 7 d/yr ≥100°F today · 15 d/yr by 30 yrs out
- Wind 2/10 Low
- Air quality 1/10 Low 0 unhealthy d/yr today · 0 by 30 yrs out
Nearby sold comps map
Loading sold comps map…
Walkable amenities ~0.75 mi
Loading nearby amenities…
Taxation est. · year 1
- Rental income
- $17,713
- − Mortgage interest
- −$3,355
- − Property taxes
- −$1,130
- − Insurance
- −$300
- − Repairs & maintenance
- −$1,417
- − Management
- −$1,417
- − Depreciation
- −$1,743
- Taxable income
- $8,351
- Est. tax owed @ 24.0%
- −$2,004
- After-tax cash flow
- $6,790/yr
For passive investors: Depreciation is non-cash, so a rental often shows a tax loss while cash-flowing — sheltering income. Rental losses are passive: they offset passive income freely, and up to $25,000/yr can offset ordinary (W-2) income if you actively participate and your MAGI is under $100k (phasing out to $0 by $150k); unused losses carry forward. On sale, claimed depreciation is recaptured at up to 25%, and gains may owe capital-gains tax (a 1031 exchange can defer both). Figures are a year-1 estimate at your 24.0% rate — not tax advice; consult a CPA.
Schools (NCES district)
- District
- Truman Public School District
- NCES district ID
- 2740680
- Math proficiency
- 30% ▼ -10.00%
- Reading proficiency
- 55% ▲ 10.00%
- Median HH income
- $51,077
- Composite
- 38.94/100
- National rank
- #8312
- State rank
- #343 of 467 in MN
Livability — Nashville
No livability data for this city. (Only ~50 U.S. cities are tracked.)
Census & demographics
- Population (ZIP)
- 2,063
Population outlook (Martin County) Hauer SSP2
- Today (2025)
- 18,583 people
- By 2030
- 17,814 · -4.1%
- By 2040
- 16,312 · -12.2%
- By 2050
- 15,021 · -19.2%
- By 2075
- 13,025 · -29.9%
- By 2100
- 11,311 · -39.1%
Race, ethnicity, and origin ACS 2023
- Neighborhood character
- Predominantly White (94%)
- Race & ethnicity
- White 94% Two or more races 4% Hispanic / Latino 4%
- Common ancestry
- Portuguese 9% Romanian 5% Scottish 3%
- Foreign-born
- 4% · Canada
- Languages at home
- 95% English-only · Other Indo-European 3% Spanish 1% Russian/Polish/Slavic 1%
Political lean MEDSL · Martin
- 2024 margin
- Solid R (+39.7) · D 29.5% · R 69.1% · Other 1.4%
- 2008→2024 swing
- -24.4pp toward R · 2008: -15.2pp · 2024: -39.7pp
- All cycles
- 2024: R+39.7 2020: R+37.9 2016: R+41.4 2012: R+23.8 2008: R+15.2
Not yet ingested
- Civics
- —
Market trends
- HPI YoY
- ▲ 16.26%
- Current HPI
- 271.5076
- Rent YoY
- —
- Metro
- —
- State GDP YoY
- ▲ 2.41%
- F500 in state
- 34
Industry mix (Fortune 500 HQ in MN)
| Industry | F500 HQs | Revenue |
|---|---|---|
| Healthcare | 2 | $407B |
|
||
| Retail | 2 | $150B |
|
||
| Consumer Goods | 2 | $32B |
|
||
| Industrial Machinery | 2 | $6B |
|
||
| Agriculture | 1 | $40B |
|
||
| Healthcare / Medical Devices | 1 | $32B |
|
||
Price history
-0.2% since first listed4 events — show timeline
- 2026-06-01 Listed $59,900 NORTHSTARMLS as Distributed by MLS Grid
- 2008-01-17 Sold (Public Records) $90,000 Public Records
- 2007-10-17 Sold (Public Records) $60,000 Public Records
- 2007-05-04 Sold (Public Records) $60,000 Public Records
Property tax history
+7.0%/yrLatest (2025): $1,130 · +9.3% YoY. Source: county tax records.
Cash-flow waterfall
monthlySold comps — $/sqft
last 12 mo · ≤1 miLoading sold comps…