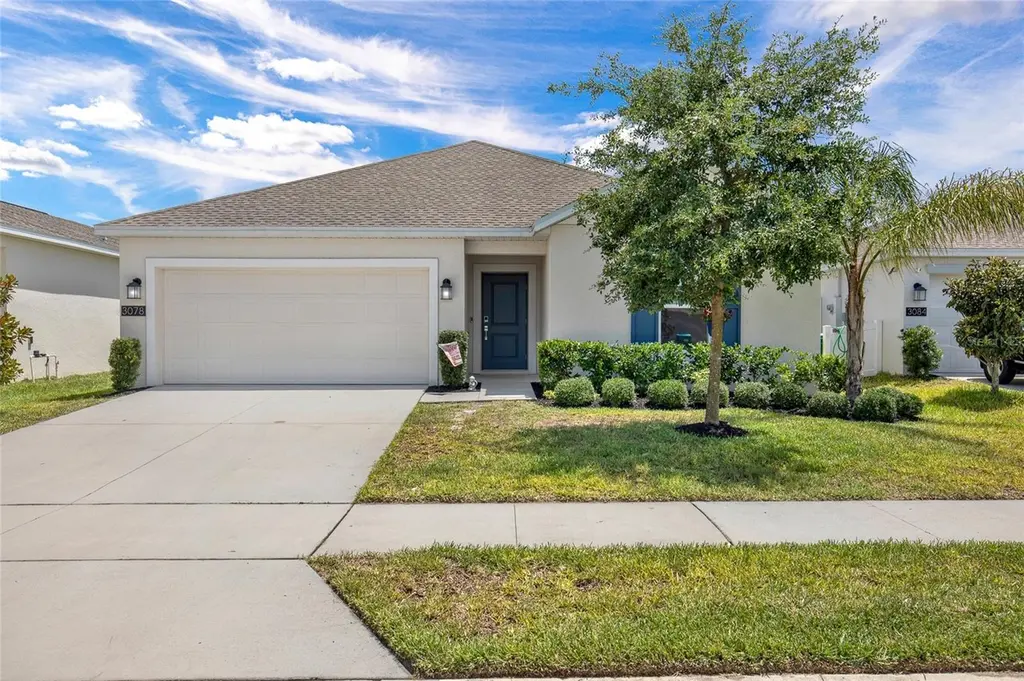
3078 Blue Bonnet Ln · Deltona, FL
Flood risk 1/10 · Minimal
- FEMA flood zone
- X (unshaded)
- Chance of flooding over 30 yrs
- 0.0%
- Est. flood insurance / yr
- $507 – $1,088
Fire risk 6/10 · Moderate
- Est. fire insurance / yr
- $947 – $1,759
Heat risk 9/10 · Severe
- Hot days now (above 107°F)
- 7 days/yr
- Hot days in 30 yrs
- 22 days/yr
Wind risk 10/10 · Severe
- Chance of severe wind over 30 yrs
- 99.0%
Air-quality risk 2/10 · Minimal
- Unhealthy air days now
- 1 days/yr
- Unhealthy air days in 30 yrs
- 1 days/yr
Risk factors via First Street. Map © Google.
Why this score? — see what drove the D- grade
The composite is a weighted blend of 9 inputs, each scored 0–100. Each bar is that input's sub-score; the figure is the points it added to the 100-point composite (weight × sub-score).
- Appreciation +10.0/10.0
- ARV discount +7.5/15.0
- Cash flow +6.6/30.0
- Schools +3.9/10.0
- Livability +3.6/5.0
- Rent growth +2.5/5.0
- Condition / age +2.5/5.0
- 1% rule +2.0/10.0
- DSCR +0.8/10.0
$330,000
🖨 Deal sheet (PDF) 📄 Offer letter ✓ Due diligence
Listing remarks MLS
Under Construction. The Dawn checks all your boxes! This single-level show-stopper features a generous open floorplan shared between the living room, dining room and kitchen. This allows for effortless transition between spaces and makes multitasking a breeze. With three bedrooms in total, this home is great for small and growing families. This home comes fully equipped with Everything Included Features like new appliances, solid surface countertops throughout and standard tile flooring in the wet areas. Welcome to the peace and tranquility of Vineland Reserve. Homeowners enjoy exclusive access to beautifully landscaped common areas, perfect for picnics. There will be a resort-style swimming pool with cabana area. For family-friendly living, the community is less than two miles from local schools. The warm waters of Blue Spring State Park are close by. There are numerous preserves and conservation areas. This provides endless recreational opportunities, including horseback riding, hiking, fishing and boating.
Key facts
- Large center island
- Split bedroom layout
- Walk in closet
Tags
Property features AI
Finance
- Other: Living area reported as 1,330 (public records); Building area reported as 1,750 (public records); Direction faces north; Association fees required
- Financial info: Total annual fees $1,320; No lease restrictions indicated
- HOA & community: Monthly HOA fee of $110 (Gyneen Goodwin LCA); Community pool; Playground; Pets allowed; Development: Vineyards
Exterior
- Parking: Attached 2-car garage
- Security: Security system; Smoke detectors
- Utilities: Public water; Public sewer; Electricity connected; Cable connected; Water connected; Sewer connected
- Home design: Single family residence; One story; Faces north; Residential zoning (PD); Homestead exempt
- Construction: Block construction; Shingle roof; Slab foundation; Built on 0.13-acre lot
- Exterior features: Sidewalk; Sliding doors; Paved road access
Interior
- Kitchen: Cooktop; Range; Microwave; Dishwasher; Disposal; Refrigerator; Freezer; Ice maker; Electric water heater
- Bedrooms: 3 bedrooms
- Flooring: Carpet; Ceramic tile
- Bathrooms: 2 full bathrooms
- Heating & cooling: Central heating (electric); Central air conditioning
- Interior features: Ceiling fans; Eat-in kitchen; High ceilings; Kitchen/family room combo; Solid wood cabinets; Stone counters; Thermostat; Window treatments; ENERGY STAR qualified windows; Inside utility
- Laundry & utility: Inside laundry
Neighborhood map
What this means for you Summary
Snapshot
- This is a 3-bed/2.0-bath single-family listed at $330k.
Deal economics
- At list price, monthly cash flow is $-547 ($-7k/yr) — negative.
- To cash-flow at today's rent, offer at most $233k (29.3% below list).
- To meet the 1% rule (rent ≥ 1% of price), the offer needs to be $230k (30.3% below list).
- Recommended offer: $230k (30.3% below list) — sets the bar for 1% rule.
Location & tenants
- Location reads 71/100 on livability (#381 in FL) — a middle-class / working-renter tenant base. Strengths: cost of living A+, housing A+, health & safety A+; Watch: amenities F, commute F.
- Volusia (suburban): math 44% / reading 49% proficiency, ranked #47 of 73 in FL (top 64%) — families likely to look elsewhere, expect single-tenant / working-renter base with shorter leases.
- Zoned schools: Osteen Elementary School (math 54% / reading 56%, grade C, #872 of 2,144 statewide, top 42%, 469 students, 60% FRL); Heritage Middle School (math 38% / reading 41%, grade F, #373 of 571 statewide, top 66%, 993 students, 61% FRL); Pine Ridge High School (math 19% / reading 38%, grade F, #458 of 667 statewide, top 69%, 1,636 students, 54% FRL).
- Market conditions: 87 active listings in the ZIP; 2 comparable units currently listed for rent nearby; 3,402 units permitted in Volusia County in 2024 (681 in 5+ unit buildings).
Forward outlook
- In year one you build about $35k of equity ($2k loan paydown + $33k appreciation (10.0% local appreciation)).
- Volusia County population projected at +19% by 2050 — long-run rental-demand tailwind backs the buy-and-hold thesis.
- By year 2, paydown + projected appreciation supports a ~$57k cash-out refi (75% LTV) — recoverable capital for the next deal without selling this one.
Negotiation context
- Only 10 days on market — expect competitive offers; lowballing is unlikely to land.
- 3 sale attempts since 4y ago with the ask held roughly flat each time — persistent listings suggest the price (not the market) is what's stuck; bring a comps-based counter.
Risks & watch-outs
- Climate carrying-cost: severe wind risk, 99% chance of damaging wind over 30y; major wildfire risk; extreme-heat days projected 7→22/yr by 2055 (HVAC capex compounding) — expect insurance premiums to compound above CPI over the hold.
Questions for the listing agent
- What do current leases actually rent for vs. the listed asking? Can we see a recent rent roll and the last 12 months of T-12 income?
- What does the HOA fee cover, when was the last increase, and are there any pending special assessments or reserve-fund shortfalls?
- Is there a deadline driving the sale (1031 exchange, divorce, estate, relocation)? That informs how much negotiation room exists.
- Schools are D-rated, which usually means shorter tenancies and higher turnover. Who's the typical renter profile here, and what's been the actual vacancy rate?
- The area grade is low — what's the realistic commute time and amenity access for the typical tenant pool here? Any planned neighborhood developments (good or bad) we should know about?
- What's the average days-on-market for RENTAL listings here right now (not sales)? A rising rental-DOM trend means longer vacancies and softer asking-rent achievability than the comps imply.
- What's the recent tenant-quality profile in this submarket — average credit score on applications, eviction rate, late-payment / NSF rate, and stable-employment percentage? A property-management company in the area should have these aggregated.
- How much new for-sale + rental construction is in the pipeline within 1–3 miles? Heavy new supply typically softens prices + rents 12–24 months out; constrained supply supports both.
Investment metrics
- 1% rule
- 0.70% ✗
- Cap rate
- 4.30%
- Cash-on-cash
- -7.10%
- DSCR
- 0.68
- GRM
- 12.0
CMA / ARV
No comps found within radius.
Projected returns pro-forma
10.0% appreciation · 3.0% rent growth · sell at horizon
- IRR
- 19.3%
- Equity multiple
- 2.57×
- Total profit
- $144,989
- Equity at exit
- $297,290
- IRR
- 17.8%
- Equity multiple
- 5.92×
- Total profit
- $454,522
- Equity at exit
- $641,117
Cash invested: $92,400 (down + closing). Projections, not guarantees.
Landlord ↔ Tenant lean methodology
- Overall (STATE)
- 87 Strongly Landlord-Friendly
- State Florida
- 87 Strongly Landlord-Friendly · R+3
- County
- — inherits STATE
- City
- — inherits STATE
ZIP-level market 32764
- Home prices YoY
- 11.7%
- Active inventory
- 87
- Price-to-rent
- 12.0×
Monthly cashflow live
- Estimated rent
- $2,299 medium interval (Pro) →
- Mortgage (P&I)
- −$1,731
- Tax from tax record
- −$385 /mo · $4,619/yr
- Insurance
- −$138
- HOA
- −$110
- Vacancy / Maint / Mgmt
- −$483
- Net cashflow
- $-547
Break-even live
Sensitivity live
| Price | -10% $-360 | -5% $-453 | +0% $-547 | +5% $-640 | +10% $-734 |
|---|---|---|---|---|---|
| Rent | -10% $-728 | -5% $-638 | +0% $-547 | +5% $-456 | +10% $-365 |
| Rate | -1.0pp $-381 | -0.5pp $-463 | base $-547 | +0.5pp $-632 | +1.0pp $-719 |
UW: 25.0% down · 7.5% · 30yr · 1.5% tax · 5.0% vac · 8.0% maint · 8.0% mgmt
Financing live
Cash to close
- Down payment
- $82,500
- Closing costs
- $9,900
- Reserves months
- —
- Total cash needed
- —
Loan-product check · same deal, 3 products live
Conventional
25% down · 7.5% · 30yr
- Down + closing
- —
- Monthly P&I
- —
- Monthly cashflow
- —
- DSCR
- —
- Eligible?
- —
Personal DTI + credit; lowest rate.
DSCR
20% down · 8.5% · 30yr
- Down + closing
- —
- Monthly P&I
- —
- Monthly cashflow
- —
- DSCR
- —
- Eligible?
- —
No personal income docs; deal must DSCR.
Hard money
10% down · 12.0% · 12mo
- Down + closing
- —
- Monthly P&I
- —
- Monthly cashflow
- —
- DSCR
- —
- Eligible?
- —
Short-term bridge; refi at stabilization.
Rent comps 2 comps
| Address | Beds | Baths | Sqft | Rent | $/sqft | DOM | Units | Dist |
|---|---|---|---|---|---|---|---|---|
| 3031 Staten Dr Deltona, FL | 3.0 | 2.0 | 1706 | $2,299 | $1.35 | 6d | 1 | 0.78mi |
| 3031 Staten Dr Deltona, FL | 3.0 | 2.0 | 1706 | $2,299 | $1.35 | 0d | 1 | 0.78mi |
HOA detail
- Monthly dues
- $110 · $1,320/yr
- Likely covers
- waterpool
Listing history 7 events
-
2026-06-22days on market $330,000 Active 10 DOM
-
2026-06-18days on market $330,000 Active 7 DOM
-
2026-06-17days on market $330,000 Active 6 DOM
-
2026-06-16days on market $330,000 Active 5 DOM
-
2026-06-15days on market $330,000 Active 4 DOM
-
2026-06-14remarks 699-char remark
-
2026-06-14$330,000 Active 2 DOM
ⓘ Source: listings_history table (triggers on properties + properties_extension) + one-shot
backfill from property_details.listing_events for pre-trigger history.
Tax reassessment forecast FL · Resets to sale price
- Current annual tax
- $4,619 · $385/mo
- Projected year-2 tax
- $4,619 · $385/mo
- Expected delta
- $0/yr ($0/mo · 0.0%)
ⓘ Screening estimate from a state-policy table — verify with the county assessor before closing.
Climate risk First Street
- Flood 1/10 Low FEMA zone X (unshaded) · 0% chance over 30 yrs
- Wildfire 6/10 Major
- Heat 9/10 Extreme 7 d/yr ≥107°F today · 22 d/yr by 30 yrs out
- Wind 10/10 Extreme 99% chance of damaging wind over 30 yrs
- Air quality 2/10 Low 1 unhealthy d/yr today · 1 by 30 yrs out
Nearby sold comps map
Loading sold comps map…
Walkable amenities ~0.75 mi
Loading nearby amenities…
Taxation est. · year 1
- Rental income
- $27,588
- − Mortgage interest
- −$18,485
- − Property taxes
- −$4,619
- − Insurance
- −$1,650
- − Repairs & maintenance
- −$2,207
- − Management
- −$2,207
- − HOA
- −$1,320
- − Depreciation
- −$9,600
- Taxable loss
- −$12,500
- Est. tax savings @ 24.0%
- +$3,000
- After-tax cash flow
- $-3,561/yr
For passive investors: Depreciation is non-cash, so a rental often shows a tax loss while cash-flowing — sheltering income. Rental losses are passive: they offset passive income freely, and up to $25,000/yr can offset ordinary (W-2) income if you actively participate and your MAGI is under $100k (phasing out to $0 by $150k); unused losses carry forward. On sale, claimed depreciation is recaptured at up to 25%, and gains may owe capital-gains tax (a 1031 exchange can defer both). Figures are a year-1 estimate at your 24.0% rate — not tax advice; consult a CPA.
Schools (NCES district)
- District
- Volusia
- NCES district ID
- 1201920
- Math proficiency
- 44% ▼ -9.00%
- Reading proficiency
- 49% ▼ -3.00%
- Median HH income
- $42,946
- Composite
- 39.2/100
- National rank
- #4019
- State rank
- #47 of 73 in FL
Livability — Deltona
- Score
- 71/100
- State rank
- #381
- US rank
- #6749
Category grades
Schools grade is shown separately in the Schools card above.
Census & demographics
- Census place
- Deltona, FL
- City population
- 101,355
- Population (ZIP)
- 2,744
Population outlook (Volusia County) Hauer SSP2
- Today (2025)
- 572,749 people
- By 2030
- 598,695 · +4.5%
- By 2040
- 644,880 · +12.6%
- By 2050
- 681,451 · +19.0%
- By 2075
- 759,957 · +32.7%
- By 2100
- 778,902 · +36.0%
Race, ethnicity, and origin ACS 2023
- Neighborhood character
- Predominantly White (87%)
- Race & ethnicity
- White 87% Hispanic / Latino 7% Two or more races 6% Black 2%
- Hispanic origin (detail)
- Puerto Rican 2% Cuban 3%
- Common ancestry
- Slovak 5% Lithuanian 3% Italian 3%
- Foreign-born
- 5% · Canada, Jamaica
- Languages at home
- 94% English-only · Spanish 4% French/Haitian/Cajun 1%
Political lean MEDSL · Volusia
- 2024 margin
- Strong R (+21.8) · D 38.7% · R 60.5%
- 2008→2024 swing
- -27.4pp toward R · 2008: 5.7pp · 2024: -21.8pp
- All cycles
- 2024: R+21.8 2020: R+14.1 2016: R+13.1 2012: R+1.2 2008: D+5.7
Not yet ingested
- Civics
- —
Market trends
- HPI YoY
- ▲ 55.42%
- Current HPI
- 531.22
- Rent YoY
- —
- Metro
- —
- State GDP YoY
- ▲ 3.28%
- F500 in state
- 36
Industry mix (Fortune 500 HQ in FL)
| Industry | F500 HQs | Revenue |
|---|---|---|
| Industrial Technology | 2 | $29B |
|
||
| Insurance | 2 | $17B |
|
||
| Retail | 1 | $60B |
|
||
| Technology Distribution | 1 | $58B |
|
||
| Homebuilding | 1 | $35B |
|
||
| Technology Manufacturing | 1 | $35B |
|
||
Price history
+4.5% since first listed9 events — show timeline
- 2026-06-11 Listed $330,000 Stellar MLS as Distributed by MLS Grid
- 2023-05-19 Sold (MLS) $310,805 Stellar MLS as Distributed by MLS Grid
- 2023-03-06 Pending — Stellar MLS as Distributed by MLS Grid
- 2023-02-21 Price Changed $310,805 Stellar MLS as Distributed by MLS Grid
- 2023-01-13 Relisted — Stellar MLS as Distributed by MLS Grid
- 2023-01-13 Price Changed $308,305 Stellar MLS as Distributed by MLS Grid
- 2022-09-02 Pending — Stellar MLS as Distributed by MLS Grid
- 2022-08-23 Price Changed $297,805 Stellar MLS as Distributed by MLS Grid
- 2022-08-08 Listed $315,805 Stellar MLS as Distributed by MLS Grid
Property tax history
+120.4%/yrLatest (2025): $4,619 · +2.1% YoY. Source: county tax records.
Cash-flow waterfall
monthlySold comps — $/sqft
last 12 mo · ≤1 miLoading sold comps…