 🌊 Lakefront
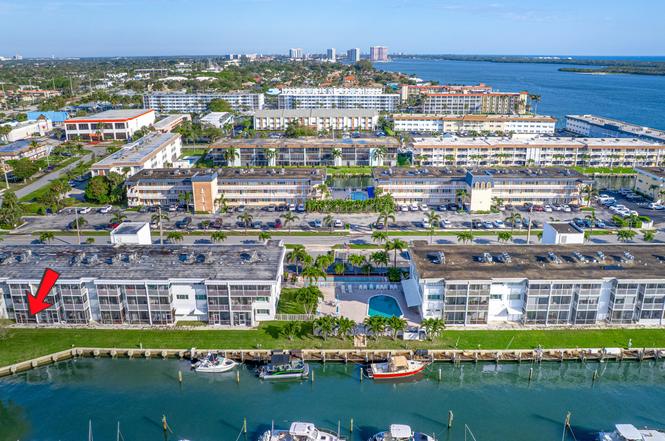
130 Doolen Ct #108 · North Palm Beach, FL
Flood risk 6/10 · Moderate
- FEMA flood zone
- X (shaded)
- Chance of flooding over 30 yrs
- 0.71%
- Est. flood insurance / yr
- $507 – $1,088
Fire risk 3/10 · Minor
- Est. fire insurance / yr
- $947 – $1,759
Heat risk 10/10 · Severe
- Hot days now (above 105°F)
- 7 days/yr
- Hot days in 30 yrs
- 25 days/yr
Wind risk 10/10 · Severe
- Chance of severe wind over 30 yrs
- 99.0%
Air-quality risk 2/10 · Minimal
- Unhealthy air days now
- 0 days/yr
- Unhealthy air days in 30 yrs
- 1 days/yr
Risk factors via First Street. Map © Google.
Why this score? — see what drove the B grade
The composite is a weighted blend of 9 inputs, each scored 0–100. Each bar is that input's sub-score; the figure is the points it added to the 100-point composite (weight × sub-score).
- Cash flow +30.0/30.0
- 1% rule +10.0/10.0
- DSCR +10.0/10.0
- ARV discount +7.5/15.0
- Schools +4.3/10.0
- Livability +3.9/5.0
- Rent growth +2.6/5.0
- Condition / age +2.5/5.0
- Appreciation +0.0/10.0
$185,000
🖨 Deal sheet 📄 Offer letter ✓ Due diligence
Listing remarks
Motivated Seller! BOATERS DREAM for only $2/foot!! Intracoastal Views from this 2 bedroom, 1 bath, 1st floor combines comfort and coastal charm, featuring complete Hurricane Impact Windows and Doors with a spectacular water view from your bedroom patio! A rare opportunity in this 55+ waterfront community to lease a boat, upon availability!! Features include; beautiful white tile flooring throughout, 2022 A/C, ceiling fans, crown molding, updated kitchen, double oven, granite countertops, partial soft-touch cabinetry, updated bathroom, and beautiful Plantation Shutters throughout. Relax and enjoy the breathtaking morning sunrises and evening skyline of Singer Island while watching the boats
Key facts
- $743 HOA
- Parking
- Community pool
Property features AI
Finance
- Other: Senior community
- Financial info: Not a land lease; Community has 60 units; Pets not allowed
- HOA & community: Has association (Lake Colony Apartments Two, Inc.); Association amenities: heated pool, pool, boating access, elevator(s), laundry, parking, shuffleboard court, storage, community room, kitchen facilities, sidewalks, street lights; Monthly association fee (includes cable TV, insurance, grounds maintenance, pest control, sewer, trash, water, common areas, common real estate tax, elevator, reserve funds, pool service)
Exterior
- Parking: Assigned parking; Guest parking; 1 parking space total
- Security: Smoke detector(s)
- Utilities: Public water; Public sewer; Cable available; Water available; Sewer available
- Home design: Stock cooperative; One level; Faces north; Resale property
- Construction: Built with block, concrete, CBS and wood frame; Concrete/composition/pre-stressed roof; Slab foundation; 3-story building (unit in a multi-story building)
- Exterior features: Screened patio; Patio; Chain link fencing; Fenced lot; Sidewalks; East of US-1 road frontage; Intracoastal waterfront (no fixed bridge)
Interior
- Kitchen: Dishwasher; Electric range; Microwave; Refrigerator; Garbage disposal; Electric water heater
- Bedrooms: 2 bedrooms on the main level
- Flooring: Ceramic tile
- Bathrooms: 1 full bathroom on the main level
- Heating & cooling: Central heating (electric); Central air conditioning (electric); Ceiling fan(s)
- Interior features: Unfurnished; Plantation shutters; Storm windows; Sliding windows; Smoke detector(s)
- Laundry & utility: Common area laundry; Laundry tub
Neighborhood map
What this means for you Summary
Snapshot
- This is a 2-bed/1.0-bath condo listed at $185k.
Deal economics
- At list price, monthly cash flow is $957 ($11k/yr) — positive.
- The deal already cash-flows at list — no discount required.
- Meets the 1% rule at list price ($4k rent vs $185k).
- Recommended offer: $168k (9.0% below list) — sets the bar for market timing.
Location & tenants
- Location reads 77/100 on livability (#184 in FL, #2,894 nationally) — a middle-class / working-renter tenant base. Strengths: crime A+, employment A+, housing A+; Watch: amenities F, commute F, cost of living D-.
- Palm Beach (suburban): math 46% / reading 53% proficiency, ranked #34 of 73 in FL (top 47%) — families likely to look elsewhere, expect single-tenant / working-renter base with shorter leases.
- Zoned schools: Lake Park Elementary School (math 57% / reading 62%, grade B-, #690 of 2,144 statewide, top 34%, 389 students, 83% FRL); Howell L. Watkins Middle School (math 18% / reading 33%, grade F, #512 of 571 statewide, top 90%, 794 students, 76% FRL); Palm Beach Gardens High School (math 19% / reading 40%, grade F, #447 of 667 statewide, top 68%, 2,570 students, 61% FRL) — zoned schools average 74% FRL vs 52% district-wide (22 pts higher); higher-poverty schools than district average — tighter screening recommended.
- Market conditions: Rents flat; 400 active listings in the ZIP; 13 comparable units currently listed for rent nearby; rentals at typical pace (median 25d on market — plan ~3-4 weeks tenant-placement turnaround); solid renter incomes; 3,974 units permitted in Palm Beach County in 2024 (1,012 in 5+ unit buildings).
- At $3,743/mo this rent would consume 49% of the median local household income ($92k/yr) (locally 835% of renters already pay >50% of income on rent) — very limited rent-growth headroom before tenants either downsize or default.
Forward outlook
- Local home prices are declining (-3.0%/yr); year-one equity from $1k of loan paydown is wiped out by about $6k of value loss. Plan a longer hold.
- Palm Beach County population projected at +30% by 2050 — long-run rental-demand tailwind backs the buy-and-hold thesis.
- At projected returns (-3.0% appreciation + 0.3% rent growth), your $52k cash investment doubles in ~8 years — after that, you're playing with house money.
Negotiation context
- It's been on market 94 days — a 9% lower offer ($168k) is reasonable based on typical stale-listing flexibility.
- 2 sale attempts since 20y ago; this cycle's ask has dropped $40k (18%) from the opening price — seller is motivated, your offer sets the floor, not the list.
Risks & watch-outs
- Climate carrying-cost: major flood risk; severe wind risk, 99% chance of damaging wind over 30y; extreme-heat days projected 7→25/yr by 2055 (HVAC capex compounding) — expect insurance premiums to compound above CPI over the hold.
Questions for the listing agent
- It's been on market 94 days. Have you received any prior offers? Is the seller open to a 9% concession, seller financing, or rate buy-down credit?
- Built in 1965 — when were the roof, HVAC, electrical panel, plumbing, and water heater last replaced?
- What does the HOA fee cover, when was the last increase, and are there any pending special assessments or reserve-fund shortfalls?
- Any open or pending special assessments — roof, HVAC, plumbing, elevator, façade? What's the per-unit balance and payoff schedule, and is the seller paying it off at close or rolling it to the buyer?
- Why hasn't it sold? Are there any deal-killer items the seller is aware of (foundation, flood, title, zoning, code violations)?
- Is there a deadline driving the sale (1031 exchange, divorce, estate, relocation)? That informs how much negotiation room exists.
- Schools are A-rated — typically a magnet for longer-tenancy family renters. What's the average tenant stay here, and is there a school-zone premium baked into asking?
- This sits on a lake — are riparian / water-frontage rights deeded with the parcel? Any dock permits, shoreline easements, or HOA water-use restrictions?
- What's the documented flood / surge / shoreline-erosion history here (FEMA AND non-FEMA — e.g., storm surge, creek backup, septic-field saturation)?
- Any water-quality or seasonal algae-bloom issues that affect tenant satisfaction or short-term-rental demand?
- What's the average days-on-market for RENTAL listings here right now (not sales)? A rising rental-DOM trend means longer vacancies and softer asking-rent achievability than the comps imply.
- What's the recent tenant-quality profile in this submarket — average credit score on applications, eviction rate, late-payment / NSF rate, and stable-employment percentage? A property-management company in the area should have these aggregated.
- How much new apartment / multifamily construction is in the pipeline within 1–3 miles? Heavy new supply (>2% of stock underway) typically softens rents 12–24 months out; light construction supports rent growth.
Investment metrics
- 1% rule
- 2.02% ✓
- Cap rate
- 12.50%
- Cash-on-cash
- 22.16%
- DSCR
- 1.99
- GRM
- 4.1
CMA / ARV
No comps found within radius.
Projected returns pro-forma
-3.0% appreciation · 0.27% rent growth · sell at horizon
- IRR
- 10.9%
- Equity multiple
- 1.41×
- Total profit
- $21,438
- Equity at exit
- $27,584
- IRR
- 16.9%
- Equity multiple
- 2.16×
- Total profit
- $60,265
- Equity at exit
- $15,995
Cash invested: $51,800 (down + closing). Projections, not guarantees.
Landlord ↔ Tenant lean methodology
- Overall (STATE)
- 87 Strongly Landlord-Friendly
- State Florida
- 87 Strongly Landlord-Friendly · R+3
- County
- — inherits STATE
- City
- — inherits STATE
ZIP-level market 33408
- Rents YoY
- 0.3%
- Active inventory
- 400
- Price-to-rent
- 4.1×
Monthly cashflow live
- Estimated rent
- $3,743 high interval (Pro) →
- Mortgage (P&I)
- −$970
- Tax from tax record
- −$210 /mo · $2,519/yr
- Insurance
- −$77
- HOA
- −$743
- Vacancy / Maint / Mgmt
- −$786
- Net cashflow
- $957
Break-even live
UW: 25.0% down · 7.5% · 30yr · 1.5% tax · 5.0% vac · 8.0% maint · 8.0% mgmt
Financing live
Cash to close
- Down payment
- $46,250
- Closing costs
- $5,550
- Reserves months
- —
- Total cash needed
- —
Loan-product check · same deal, 3 products live
Conventional
25% down · 7.5% · 30yr
- Down + closing
- —
- Monthly P&I
- —
- Monthly cashflow
- —
- DSCR
- —
- Eligible?
- —
Personal DTI + credit; lowest rate.
DSCR
20% down · 8.5% · 30yr
- Down + closing
- —
- Monthly P&I
- —
- Monthly cashflow
- —
- DSCR
- —
- Eligible?
- —
No personal income docs; deal must DSCR.
Hard money
10% down · 12.0% · 12mo
- Down + closing
- —
- Monthly P&I
- —
- Monthly cashflow
- —
- DSCR
- —
- Eligible?
- —
Short-term bridge; refi at stabilization.
Rent comps 13 comps
| Address | Beds | Baths | Sqft | Rent | $/sqft | DOM | Units | Dist |
|---|---|---|---|---|---|---|---|---|
| 913 Lake Shore Dr Lake Park, FL | 1.0–2.0 | 1.0–2.0 | 1066 | $3,731 | $3.50 | 2d | 9 | 0.40mi |
| 524 Eastwind Dr Unit 524 North Palm Beach, FL | 2.0 | 1.0 | 774 | $3,995 | $5.16 | 24d | 1 | 0.47mi |
| 522 Eastwind Dr North Palm Beach, FL | 2.0 | 2.0 | 948 | $3,995 | $4.21 | 24d | 1 | 0.47mi |
| 526 Eastwind Dr Unit 526 North Palm Beach, FL | 2.0 | 1.0 | 840 | $3,995 | $4.76 | 24d | 1 | 0.47mi |
| 308 Southwind Ct Unit 8 North Palm Beach, FL | 2.0 | 2.0 | 1100 | $2,900 | $2.64 | 24d | 1 | 0.81mi |
| 220 Lake Shore Dr Lake Park, FL | 1.0–3.0 | 1.5–3.5 | 1575 | $14,498 | $9.20 | 5d | 18 | 0.88mi |
| 624 Southwind Cir #2 North Palm Beach, FL | 2.0 | 2.0 | 718 | $3,750 | $5.22 | 24d | 1 | 0.90mi |
| 5400 N Ocean Dr Riviera Beach, FL | 1.0–2.0 | 1.0–2.0 | 1300 | $6,500 | $5.00 | 22d | 3 | 1.14mi |
| 2545 Conroy Dr West Palm Beach, FL | 3.0 | 2.0 | 1066 | $3,295 | $3.09 | 24d | 1 | 1.36mi |
| 1025 Sugar Sands Blvd #159 Riviera Beach, FL | 1.0 | 1.0 | 987 | $4,200 | $4.26 | 24d | 1 | 1.39mi |
| 901 W 37th St Riviera Beach, FL | 3.0 | 1.0 | 900 | $2,895 | $3.22 | 24d | 1 | 1.40mi |
| 410 Wilma Cir #103 Riviera Beach, FL | 2.0 | 2.0 | 1056 | $4,000 | $3.79 | 15d | 1 | 1.42mi |
| 400 Wilma Cir #309 Riviera Beach, FL | 1.0 | 1.0 | 818 | $4,000 | $4.89 | 5d | 1 | 1.43mi |
HOA detail condo
- Monthly dues
- $743 · $8,916/yr
- Likely covers
- water
- Assessments
- None detected in remarks — confirm with the listing agent.
Listing history 18 events
-
2026-06-18days on market $185,000 Active 94 DOM
-
2026-06-17days on market $185,000 Active 93 DOM
-
2026-06-16days on market $185,000 Active 92 DOM
-
2026-06-15pricedays on market $185,000 Active 91 DOM
-
2026-06-13days on market $210,000 Active 89 DOM
-
2026-06-09days on market $210,000 Active 85 DOM
-
2026-06-08days on market $210,000 Active 84 DOM
-
2026-06-07days on market $210,000 Active 83 DOM
-
2026-06-04days on market $210,000 Active 80 DOM
-
2026-06-03days on market $210,000 Active 79 DOM
-
2026-06-02days on market $210,000 Active 78 DOM
-
2026-06-01days on market $210,000 Active 77 DOM
-
2026-05-31days on market $210,000 Active 76 DOM
-
2026-05-10price $210,000
-
2026-03-16$225,000 Active
-
2026-03-03historical $225,000
-
2014-10-17historical
-
2006-05-12$99,900
ⓘ Source: listings_history table (triggers on properties + properties_extension) + one-shot
backfill from property_details.listing_events for pre-trigger history.
Tax reassessment forecast FL · Resets to sale price
- Current annual tax
- $2,519 · $210/mo
- Projected year-2 tax
- $2,519 · $210/mo
- Expected delta
- $0/yr ($0/mo · 0.0%)
ⓘ Screening estimate from a state-policy table — verify with the county assessor before closing.
Climate risk First Street
- Flood 6/10 Major FEMA zone X (shaded) · 71% chance over 30 yrs
- Wildfire 3/10 Moderate
- Heat 10/10 Extreme 7 d/yr ≥105°F today · 25 d/yr by 30 yrs out
- Wind 10/10 Extreme 99% chance of damaging wind over 30 yrs
- Air quality 2/10 Low 0 unhealthy d/yr today · 1 by 30 yrs out
Nearby sold comps map
Loading sold comps map…
Walkable amenities ~0.75 mi
Loading nearby amenities…
Taxation est. · year 1
- Rental income
- $44,912
- − Mortgage interest
- −$10,363
- − Property taxes
- −$2,519
- − Insurance
- −$925
- − Repairs & maintenance
- −$3,593
- − Management
- −$3,593
- − HOA
- −$8,916
- − Depreciation
- −$5,382
- Taxable income
- $9,621
- Est. tax owed @ 24.0%
- −$2,309
- After-tax cash flow
- $9,170/yr
For passive investors: Depreciation is non-cash, so a rental often shows a tax loss while cash-flowing — sheltering income. Rental losses are passive: they offset passive income freely, and up to $25,000/yr can offset ordinary (W-2) income if you actively participate and your MAGI is under $100k (phasing out to $0 by $150k); unused losses carry forward. On sale, claimed depreciation is recaptured at up to 25%, and gains may owe capital-gains tax (a 1031 exchange can defer both). Figures are a year-1 estimate at your 24.0% rate — not tax advice; consult a CPA.
Schools (NCES district)
- District
- Palm Beach
- NCES district ID
- 1201500
- Math proficiency
- 46% ▼ -16.00%
- Reading proficiency
- 53% ▼ -4.00%
- Median HH income
- $53,943
- Composite
- 42.72/100
- National rank
- #3160
- State rank
- #34 of 73 in FL
Livability — North Palm Beach
- Score
- 77/100
- State rank
- #184
- US rank
- #2894
Category grades
Schools grade is shown separately in the Schools card above.
Census & demographics
- Census place
- North Palm Beach, FL
- County
- Palm Beach County · 1,438,312 people
- City population
- 18,817
- Metro
- Miami-Fort Lauderdale-Pompano Beach, FL
- Population (ZIP)
- 18,817
- Household income
- $92,216
- Rent vs Own
- Severe rent burden
- 835.0
Population outlook (Palm Beach County) Hauer SSP2
- Today (2025)
- 1,637,487 people
- By 2030
- 1,743,255 · +6.5%
- By 2040
- 1,948,712 · +19.0%
- By 2050
- 2,132,979 · +30.3%
- By 2075
- 2,530,027 · +54.5%
- By 2100
- 2,706,979 · +65.3%
Race, ethnicity, and origin ACS 2023
- Neighborhood character
- Predominantly White (86%)
- Race & ethnicity
- White 86% Hispanic / Latino 9% Two or more races 7% Black 1% Asian 1%
- Hispanic origin (detail)
- Puerto Rican 2% Cuban 2%
- Common ancestry
- Lithuanian 4% Slovak 3% Romanian 3%
- Foreign-born
- 11% · Canada, Jamaica, Guatemala
- Languages at home
- 89% English-only · Spanish 7% Other Indo-European 1% French/Haitian/Cajun 1%
Political lean MEDSL · Palm Beach
- 2024 margin
- Toss-up / Even · D 50.0% · R 49.2%
- 2008→2024 swing
- -22.1pp toward R · 2008: 22.9pp · 2024: 0.8pp
- All cycles
- 2024: D+0.8 2020: D+12.8 2016: D+15.3 2012: D+17.0 2008: D+22.9
Not yet ingested
- Civics
- —
Market trends
- HPI YoY
- ▼ -223.14%
- Current HPI
- 365.2913
- Rent YoY
- ▲ 0.27%
- Metro
- Miami-Fort Lauderdale-Pompano Beach, FL
- State GDP YoY
- ▲ 3.28%
- F500 in state
- 36
Industry mix (Fortune 500 HQ in FL)
| Industry | F500 HQs | Revenue |
|---|---|---|
| Industrial Technology | 2 | $29B |
|
||
| Insurance | 2 | $17B |
|
||
| Retail | 1 | $60B |
|
||
| Technology Distribution | 1 | $58B |
|
||
| Homebuilding | 1 | $35B |
|
||
| Technology Manufacturing | 1 | $35B |
|
||
Price history
+110.2% since first listed5 events — show timeline
- 2026-05-10 Price Changed $210,000 Beaches MLS
- 2026-03-16 Listed $225,000 Beaches MLS
- 2026-03-03 Coming Soon $225,000 Beaches MLS
- 2014-10-17 Listing Removed — Beaches MLS
- 2006-05-12 Listed $99,900 Beaches MLS
Property tax history
+6.0%/yrLatest (2025): $2,519 · +3.8% YoY. Source: county tax records.
Cash-flow waterfall
monthlySold comps — $/sqft
last 12 mo · ≤1 miLoading sold comps…