 Duplex
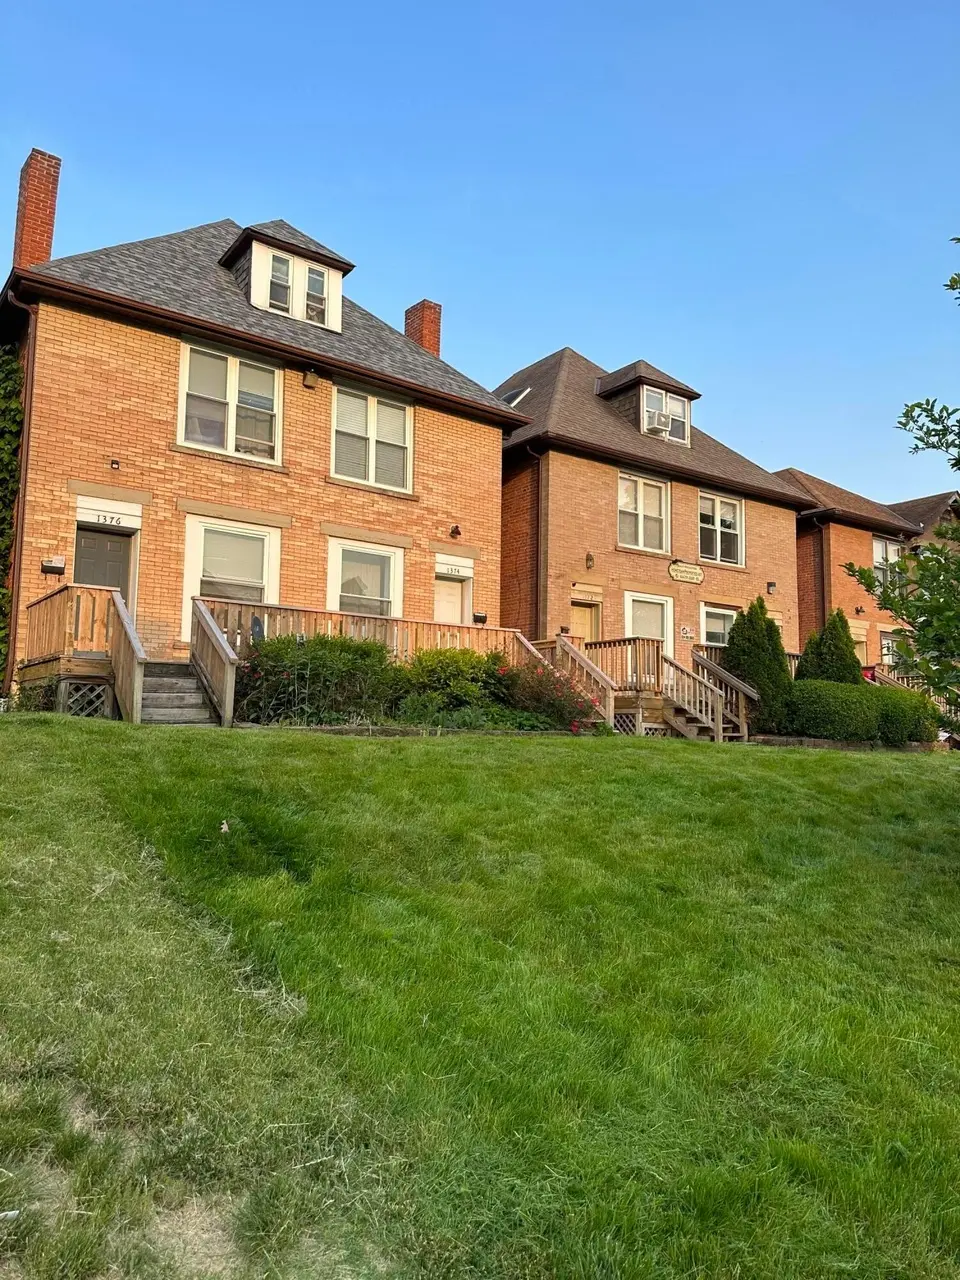
1374-1376 Indianola Ave · Columbus, OH
Flood risk 1/10 · Minimal
- FEMA flood zone
- X (unshaded)
- Chance of flooding over 30 yrs
- 0.0%
- Est. flood insurance / yr
- $473 – $860
Fire risk 1/10 · Minimal
- Est. fire insurance / yr
- $713 – $1,323
Heat risk 4/10 · Minor
- Hot days now (above 100°F)
- 7 days/yr
- Hot days in 30 yrs
- 18 days/yr
Wind risk 2/10 · Minimal
- Chance of severe wind over 30 yrs
- 1.0%
Air-quality risk 3/10 · Minor
- Unhealthy air days now
- 2 days/yr
- Unhealthy air days in 30 yrs
- 4 days/yr
Risk factors via First Street. Map © Google.
Why this score? — see what drove the D grade
The composite is a weighted blend of 9 inputs, each scored 0–100. Each bar is that input's sub-score; the figure is the points it added to the 100-point composite (weight × sub-score).
- ARV discount +13.1/15.0
- Cash flow +11.2/30.0
- Livability +4.0/5.0
- DSCR +3.3/10.0
- Rent growth +3.0/5.0
- 1% rule +2.8/10.0
- Condition / age +2.5/5.0
- Schools +1.7/10.0
- Appreciation +0.0/10.0
$499,900
🖨 Deal sheet (PDF) 📄 Offer letter ✓ Due diligence
Multi-family units
County records classify this as Multi-Family (2-4 Unit). Listing-text estimate: 2 units. confirmed
Listing remarks MLS
Gorgeous brick duplex in the Weinland Park neighborhood. This is the perfect opportunity for someone to live in one unit and have the other unit pay your mortgage! Minutes away from Short North, Downtown, Ohio State University, and more. One unit is currently owner-occupied and the other unit is leased at $1,650 through 7/31/2023, as of now the tenants don't have plans of moving. Each unit has three bedrooms and one bathroom. * * * * multiple offers received, highest and best by Saturday 6/25 @8PM * * * *
Key facts
- Utility room
- Brick duplex
- Basement for storage
Tags
Property features AI
Finance
- Other: Annual property tax (2025) reported: $5,492.96
- Financial info: Net operating income reported: $3,197.25; Operating expenses reported: $1,017
Exterior
- Parking: 6 total parking spaces
- Utilities: Public water; Public sewer; Natural gas available; Electricity available
- Home design: Duplex; Built in 1918
- Exterior features: Located in Weinland Park neighborhood; Zoned residential
Interior
- Heating & cooling: Central air conditioning; Forced air heating
- Interior features: Central air conditioning; Forced air heating; Property contains two dwelling units
Neighborhood map
What this means for you Summary
Snapshot
- This is a 2 × 3-bed/1-bath units multifamily listed at $500k.
Deal economics
- At list price, monthly cash flow is $-191 ($-2k/yr) — negative. Per door: $-95/mo.
- To cash-flow at today's rent, offer at most $466k (6.7% below list).
- To meet the 1% rule (rent ≥ 1% of price), the offer needs to be $392k (21.6% below list).
- Recommended offer: $392k (21.6% below list) — sets the bar for 1% rule.
- Cap rate 5.8% vs local median 3.8% in Columbus — top-decile yield for the area; either an underpriced asset or a hidden risk that comps aren't pricing in. Stress-test before assuming the spread holds.
Location & tenants
- Location reads 81/100 on livability (#97 in OH, #1,491 nationally) — a professional / high-income tenant draw. Strengths: commute A+, cost of living A+, housing A+; Watch: employment C-, crime F.
- Columbus City School District (urban): math 15% / reading 26% proficiency, ranked #626 of 656 in OH (top 95%) — low school quality limits family demand, transient renter base, plan for 1-2y turnover; 72% free/reduced lunch — lower-income household profile, screen leases tightly.
- Zoned schools: Indianola Informal K-8 School (math 43% / reading 58%, grade D+, #896 of 1,584 statewide, top 57%, 684 students, 0% FRL); Dominion Middle School (math 39% / reading 50%, grade D, #477 of 654 statewide, top 74%, 717 students, 0% FRL); Whetstone High School (math 17% / reading 44%, grade F, #615 of 781 statewide, top 79%, 976 students, 0% FRL) — zoned schools average 0% FRL vs 72% district-wide (72 pts lower); this property's tenant base skews higher-income than the district average.
- Zoned-school proficiency averages 42% at this address vs 20% district-wide (+21 pts) — the actual schools serving this property are materially stronger than the Columbus City School District average implies; a family-tenant draw the district grade alone would hide.
- Market conditions: Rents rising (+2.1%/yr); 136 active listings in the ZIP; 8 comparable units currently listed for rent nearby; rentals lingering (median 46d on market — plan ~5-8 weeks vacancy on turnover, expect pricing pressure); 62% of comp listings sitting > 30 days — soft ceiling on asking rent; lower-income renter base — watch delinquency; 8,139 units permitted in Franklin County in 2024 (5,940 in 5+ unit buildings).
- At $3,918/mo this rent would consume 108% of the median local household income ($44k/yr) (locally 4913% of renters already pay >50% of income on rent) — very limited rent-growth headroom before tenants either downsize or default.
Forward outlook
- Local home prices are declining (-3.0%/yr); year-one equity from $3k of loan paydown is wiped out by about $15k of value loss. Plan a longer hold.
- Franklin County population projected at +34% by 2050 — long-run rental-demand tailwind backs the buy-and-hold thesis.
Negotiation context
- It's been on market 38 days — a 3% lower offer ($485k) is reasonable based on typical stale-listing flexibility.
- 3 sale attempts since 4y ago with the ask held roughly flat each time — persistent listings suggest the price (not the market) is what's stuck; bring a comps-based counter.
Risks & watch-outs
- Watch-outs: built in 1918 — expect roof / HVAC / electrical / plumbing capex.
Questions for the listing agent
- What do current leases actually rent for vs. the listed asking? Can we see a recent rent roll and the last 12 months of T-12 income?
- It's been on market 38 days. Have you received any prior offers? Is the seller open to a 22% concession, seller financing, or rate buy-down credit?
- Can we see the unit-by-unit rent roll, current vacancy, and any below-market leases? What's the average tenancy length?
- What capital expenditures (roof, boiler, parking lot, exteriors) have been made in the last 5 years, and what's planned in the next 2?
- Built in 1918 — when were the roof, HVAC, electrical panel, plumbing, and water heater last replaced?
- Is there a deadline driving the sale (1031 exchange, divorce, estate, relocation)? That informs how much negotiation room exists.
- Crime grade is F in this area — have there been break-ins, vandalism, or insurance claims at this property in the last 3 years? What carrier currently insures it and at what premium?
- The area grade is low — what's the realistic commute time and amenity access for the typical tenant pool here? Any planned neighborhood developments (good or bad) we should know about?
- What's the average days-on-market for RENTAL listings here right now (not sales)? A rising rental-DOM trend means longer vacancies and softer asking-rent achievability than the comps imply.
- What's the recent tenant-quality profile in this submarket — average credit score on applications, eviction rate, late-payment / NSF rate, and stable-employment percentage? A property-management company in the area should have these aggregated.
- How much new apartment / multifamily construction is in the pipeline within 1–3 miles? Heavy new supply (>2% of stock underway) typically softens rents 12–24 months out; light construction supports rent growth.
Investment metrics
- 1% rule
- 0.78% ✗
- Cap rate
- 5.83%
- Cash-on-cash
- -1.64%
- DSCR
- 0.93
- GRM
- 10.6
CMA / ARV
- ARV (median comp)
- $571,329
- List price
- $499,900
- Delta
- -12.50%
- Verdict
- UNDERPRICED
- Comps
- 20 within 1.0 mi
Show comp detail 7 sales within ~0.75 mi
| Address | Dist | Beds/Ba | Sqft | Sold | Price | $/sf | Match |
|---|---|---|---|---|---|---|---|
| 1357-59 N 6th St | 0.30mi | 6/— | 2,621 (+4%) | 1mo | $435,000 | $166 | 78 |
| 154-156 W 6th Ave | 0.40mi | 6/— | 2,520 (-0%) | 6mo | $498,000 | $198 | 76 |
| 1268-1270 Courtland Ave | 0.18mi | 6/— | 2,504 (-1%) | 20mo | $537,000 | $214 | 74 |
| 33 Clark Pl #35 | 0.25mi | 5/— (-1) | 2,650 (+5%) | 5mo | $360,000 | $136 | 70 |
| 1243 N 5th St | 0.27mi | 5/— (-1) | 2,632 (+4%) | 8mo | $368,100 | $140 | 68 |
| 1214 Summit St #1212 | 0.23mi | 5/— (-1) | 2,657 (+5%) | 16mo | $440,000 | $166 | 62 |
| 1271-1273 N 6th St | 0.31mi | 6/— | 2,240 (-11%) | 8mo | $405,000 | $181 | 60 |
Match score weights: distance 35% · size 25% · config 20% · recency 20%. Top-matched comps best support the ARV.
Projected returns pro-forma
-3.0% appreciation · 2.14% rent growth · sell at horizon
- IRR
- -19.9%
- Equity multiple
- 0.31×
- Total profit
- $-96,572
- Equity at exit
- $74,537
- IRR
- -14.7%
- Equity multiple
- 0.19×
- Total profit
- $-113,490
- Equity at exit
- $43,222
Cash invested: $139,972 (down + closing). Projections, not guarantees.
Landlord ↔ Tenant lean methodology
- Overall (STATE)
- 73 Landlord-Friendly
- State Ohio
- 73 Landlord-Friendly · R+6
- County
- — inherits STATE
- City
- — inherits STATE
ZIP-level market 43201
- Rents YoY
- 2.1%
- Active inventory
- 136
- Price-to-rent
- 21.3×
Monthly cashflow live
- Estimated rent
- $3,918 high interval (Pro) →
- Mortgage (P&I)
- −$2,622
- Tax from tax record
- −$456 /mo · $5,476/yr
- Insurance
- −$208
- HOA
- −$0
- Vacancy / Maint / Mgmt
- −$823
- Net cashflow
- $-191
Break-even live
Sensitivity live
| Price | -10% $92 | -5% $-49 | +0% $-191 | +5% $-332 | +10% $-474 |
|---|---|---|---|---|---|
| Rent | -10% $-500 | -5% $-346 | +0% $-191 | +5% $-36 | +10% $119 |
| Rate | -1.0pp $61 | -0.5pp $-64 | base $-191 | +0.5pp $-320 | +1.0pp $-452 |
2-unit breakdown (identical units grouped — click to expand)
| Units | Beds | Baths | Est. rent |
|---|---|---|---|
| 2× units | 3 | 1 | $3,918 |
| #1 | 3 | 1 | $1,959 |
| #2 | 3 | 1 | $1,959 |
| Total (2 units) | $3,918 | ||
UW: 25.0% down · 7.5% · 30yr · 1.5% tax · 5.0% vac · 8.0% maint · 8.0% mgmt
Financing live
Cash to close
- Down payment
- $124,975
- Closing costs
- $14,997
- Reserves months
- —
- Total cash needed
- —
Loan-product check · same deal, 3 products live
Conventional
25% down · 7.5% · 30yr
- Down + closing
- —
- Monthly P&I
- —
- Monthly cashflow
- —
- DSCR
- —
- Eligible?
- —
Personal DTI + credit; lowest rate.
DSCR
20% down · 8.5% · 30yr
- Down + closing
- —
- Monthly P&I
- —
- Monthly cashflow
- —
- DSCR
- —
- Eligible?
- —
No personal income docs; deal must DSCR.
Hard money
10% down · 12.0% · 12mo
- Down + closing
- —
- Monthly P&I
- —
- Monthly cashflow
- —
- DSCR
- —
- Eligible?
- —
Short-term bridge; refi at stabilization.
Rent comps 8 comps
| Address | Beds | Baths | Sqft | Rent | $/sqft | DOM | Units | Dist |
|---|---|---|---|---|---|---|---|---|
| 1329 Indianola Ave Unit 1407025P Columbus, OH | 5.0 | 2.5 | 3498 | $8,624 | $2.47 | 25d | 1 | 0.09mi |
| 1329 Indianola Ave Unit 1407030P Columbus, OH | 6.0 | 2.5 | 3498 | $8,656 | $2.47 | 23d | 1 | 0.09mi |
| 41 King Ave Unit D Columbus, OH | 5.0 | 2.0 | 1750 | $2,500 | $1.43 | 45d | 1 | 0.24mi |
| 1438 Hunter Ave #1440 Columbus, OH | 5.0 | 2.5 | 2050 | $2,500 | $1.22 | 45d | 1 | 0.36mi |
| 294 King Ave Columbus, OH | 5.0 | 3.0 | 2500 | $2,395 | $0.96 | 45d | 1 | 0.60mi |
| 321 E 17th Ave Columbus, OH | 6.0 | 3.0 | 2300 | $3,200 | $1.39 | 45d | 1 | 0.73mi |
| 2040 Iuka Ave Columbus, OH | 1.0–5.0 | 1.0–2.5 | 3000 | $3,250 | $1.08 | 16d | 3 | 0.94mi |
| 356 E 20th Ave Columbus, OH | 5.0 | 3.0 | 2547 | $3,000 | $1.18 | 45d | 1 | 0.95mi |
Listing history 26 events
-
2026-06-21days on market $499,900 Active 38 DOM
-
2026-06-18days on market $499,900 Active 35 DOM
-
2026-06-17days on market $499,900 Active 34 DOM
-
2026-06-16days on market $499,900 Active 33 DOM
-
2026-06-15days on market $499,900 Active 32 DOM
-
2026-06-13days on market $499,900 Active 30 DOM
-
2026-06-13pricedays on market $499,900 Active 29 DOM
-
2026-06-09days on market $510,000 Active 27 DOM
-
2026-06-08days on market $510,000 Active 26 DOM
-
2026-06-07days on market $510,000 Active 25 DOM
-
2026-06-05days on market $510,000 Active 22 DOM
-
2026-06-03days on market $510,000 Active 21 DOM
-
2026-06-02days on market $510,000 Active 20 DOM
-
2026-06-01days on market $510,000 Active 19 DOM
-
2026-05-31days on market $510,000 Active 18 DOM
-
2026-05-13$510,000 Active 1166-char remark
-
2022-08-11soldstatus $840,000
-
2022-08-08historical 516-char remark
Show marketing remark (516 chars)
Gorgeous brick duplex in the Weinland Park neighborhood. This is the perfect opportunity for someone to live in one unit and have the other unit pay your mortgage! Minutes away from Short North, Downtown, Ohio State University, and more. One unit is currently owner-occupied and the other unit is leased at $1,650 through 7/31/2023, as of now the tenants don't have plans of moving. Each unit has three bedrooms and one bathroom. * * * * multiple offers received, highest and best by Saturday 6/25 @8PM * * * *
-
2022-08-05soldstatus $420,000 Closed 516-char remark
Show marketing remark (516 chars)
Gorgeous brick duplex in the Weinland Park neighborhood. This is the perfect opportunity for someone to live in one unit and have the other unit pay your mortgage! Minutes away from Short North, Downtown, Ohio State University, and more. One unit is currently owner-occupied and the other unit is leased at $1,650 through 7/31/2023, as of now the tenants don't have plans of moving. Each unit has three bedrooms and one bathroom. * * * * multiple offers received, highest and best by Saturday 6/25 @8PM * * * *
-
2022-06-27historical Contingent Finance and Inspection 516-char remark
Show marketing remark (516 chars)
Gorgeous brick duplex in the Weinland Park neighborhood. This is the perfect opportunity for someone to live in one unit and have the other unit pay your mortgage! Minutes away from Short North, Downtown, Ohio State University, and more. One unit is currently owner-occupied and the other unit is leased at $1,650 through 7/31/2023, as of now the tenants don't have plans of moving. Each unit has three bedrooms and one bathroom. * * * * multiple offers received, highest and best by Saturday 6/25 @8PM * * * *
-
2022-06-21$400,000 Active 516-char remark
Show marketing remark (516 chars)
Gorgeous brick duplex in the Weinland Park neighborhood. This is the perfect opportunity for someone to live in one unit and have the other unit pay your mortgage! Minutes away from Short North, Downtown, Ohio State University, and more. One unit is currently owner-occupied and the other unit is leased at $1,650 through 7/31/2023, as of now the tenants don't have plans of moving. Each unit has three bedrooms and one bathroom. * * * * multiple offers received, highest and best by Saturday 6/25 @8PM * * * *
-
2020-09-22soldstatus $715,000
-
2013-04-16soldstatus $275,000
-
2005-05-11soldstatus $160,000
-
1994-03-30soldstatus $246,500
-
1986-04-01soldstatus $31,500
ⓘ Source: listings_history table (triggers on properties + properties_extension) + one-shot
backfill from property_details.listing_events for pre-trigger history.
Tax reassessment forecast OH · Partial reset (capped growth)
- Current annual tax
- $5,476 · $456/mo
- Projected year-2 tax
- $6,637 · $553/mo
- Expected delta
- +$1,161/yr (+$97/mo · 21.2%)
ⓘ Screening estimate from a state-policy table — verify with the county assessor before closing.
Climate risk First Street
- Flood 1/10 Low FEMA zone X (unshaded) · 0% chance over 30 yrs
- Wildfire 1/10 Low
- Heat 4/10 Moderate 7 d/yr ≥100°F today · 18 d/yr by 30 yrs out
- Wind 2/10 Low 100% chance of damaging wind over 30 yrs
- Air quality 3/10 Moderate 2 unhealthy d/yr today · 4 by 30 yrs out
Nearby sold comps map
Loading sold comps map…
Walkable amenities ~0.75 mi
Loading nearby amenities…
Taxation est. · year 1
- Rental income
- $47,016
- − Mortgage interest
- −$28,002
- − Property taxes
- −$5,476
- − Insurance
- −$2,500
- − Repairs & maintenance
- −$3,761
- − Management
- −$3,761
- − Depreciation
- −$14,543
- Taxable loss
- −$11,027
- Est. tax savings @ 24.0%
- +$2,646
- After-tax cash flow
- $355/yr
For passive investors: Depreciation is non-cash, so a rental often shows a tax loss while cash-flowing — sheltering income. Rental losses are passive: they offset passive income freely, and up to $25,000/yr can offset ordinary (W-2) income if you actively participate and your MAGI is under $100k (phasing out to $0 by $150k); unused losses carry forward. On sale, claimed depreciation is recaptured at up to 25%, and gains may owe capital-gains tax (a 1031 exchange can defer both). Figures are a year-1 estimate at your 24.0% rate — not tax advice; consult a CPA.
Schools (NCES district)
- District
- Columbus City School District
- NCES district ID
- 3904380
- Math proficiency
- 15% ▼ -17.00%
- Reading proficiency
- 26% ▼ -12.00%
- Median HH income
- $38,483
- Composite
- 17.19/100
- National rank
- #9105
- State rank
- #626 of 656 in OH
Livability — Columbus
- Score
- 81/100
- State rank
- #97
- US rank
- #1491
Category grades
Schools grade is shown separately in the Schools card above.
Census & demographics
- Census place
- Columbus, OH
- County
- Franklin County · 1,351,780 people
- City population
- 612,189
- Metro
- Columbus, OH
- Population (ZIP)
- 34,322
- Household income
- $43,731
- Rent vs Own
- Severe rent burden
- 4913.0
Population outlook (Franklin County) Hauer SSP2
- Today (2025)
- 1,456,139 people
- By 2030
- 1,556,890 · +6.9%
- By 2040
- 1,757,349 · +20.7%
- By 2050
- 1,950,539 · +34.0%
- By 2075
- 2,376,171 · +63.2%
- By 2100
- 2,636,796 · +81.1%
Race, ethnicity, and origin ACS 2023
- Neighborhood character
- Predominantly White (68%)
- Race & ethnicity
- White 68% Black 14% Two or more races 8% Asian 7% Hispanic / Latino 5%
- Hispanic origin (detail)
- Mexican 1% Puerto Rican 1%
- Common ancestry
- Romanian 4% Lithuanian 2% Italian 2%
- Foreign-born
- 8% · Canada, China, Jamaica
- Languages at home
- 90% English-only · Chinese 3% Spanish 2% Other Indo-European 2%
Political lean MEDSL · Franklin
- 2024 margin
- Strong D (+28.4) · D 63.7% · R 35.3% · Other 1.0%
- 2008→2024 swing
- +7.7pp toward D · 2008: 20.7pp · 2024: 28.4pp
- All cycles
- 2024: D+28.4 2020: D+31.4 2016: D+25.9 2012: D+21.7 2008: D+20.7
Not yet ingested
- Civics
- —
Market trends
- HPI YoY
- ▼ -207.90%
- Current HPI
- 321.7282
- Rent YoY
- ▲ 2.14%
- Metro
- Columbus, OH
- State GDP YoY
- ▲ 1.98%
- F500 in state
- 48
Industry mix (Fortune 500 HQ in OH)
| Industry | F500 HQs | Revenue |
|---|---|---|
| Insurance | 3 | $145B |
|
||
| Industrial Machinery | 3 | $49B |
|
||
| Financial Services | 3 | $24B |
|
||
| Consumer Goods | 2 | $93B |
|
||
| Aerospace / Defense | 2 | $47B |
|
||
| Utilities | 2 | $33B |
|
||
Price history
+1487.0% since first listed14 events — show timeline
- 2026-06-10 Relisted — CBRMLS
- 2026-06-10 Price Changed $499,900 CBRMLS
- 2026-06-09 Listing Removed — CBRMLS
- 2026-05-13 Listed $510,000 CBRMLS
- 2022-08-11 Sold (Public Records) $840,000 Public Records
- 2022-08-08 Listing Removed — CBRMLS
- 2022-08-05 Sold (MLS) $420,000 CBRMLS
- 2022-06-27 Contingent — CBRMLS
- 2022-06-21 Listed $400,000 CBRMLS
- 2020-09-22 Sold (Public Records) $715,000 Public Records
- 2013-04-16 Sold (Public Records) $275,000 Public Records
- 2005-05-11 Sold (Public Records) $160,000 Public Records
- 1994-03-30 Sold (Public Records) $246,500 Public Records
- 1986-04-01 Sold (Public Records) $31,500 Public Records
Property tax history
+0.2%/yrLatest (2024): $5,476 · +1.3% YoY. Source: county tax records.
Cash-flow waterfall
monthlySold comps — $/sqft
last 12 mo · ≤1 miLoading sold comps…