 Multi-family
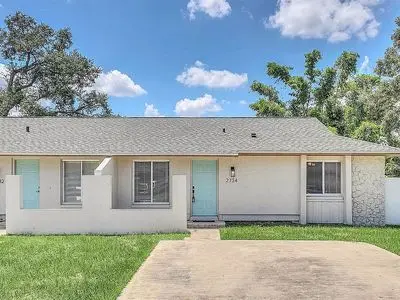
2734 Coral Reef Dr · University, FL
Flood risk 1/10 · Minimal
- FEMA flood zone
- X (unshaded)
- Chance of flooding over 30 yrs
- 0.0%
- Est. flood insurance / yr
- $507 – $1,088
Fire risk 3/10 · Minor
- Est. fire insurance / yr
- $947 – $1,759
Heat risk 9/10 · Severe
- Hot days now (above 108°F)
- 7 days/yr
- Hot days in 30 yrs
- 23 days/yr
Wind risk 9/10 · Severe
- Chance of severe wind over 30 yrs
- 99.0%
Air-quality risk 2/10 · Minimal
- Unhealthy air days now
- 2 days/yr
- Unhealthy air days in 30 yrs
- 2 days/yr
Risk factors via First Street. Map © Google.
Why this score? — see what drove the C+ grade
The composite is a weighted blend of 9 inputs, each scored 0–100. Each bar is that input's sub-score; the figure is the points it added to the 100-point composite (weight × sub-score).
- Cash flow +25.4/30.0
- DSCR +8.4/10.0
- ARV discount +7.5/15.0
- 1% rule +6.6/10.0
- Livability +4.2/5.0
- Schools +4.1/10.0
- Condition / age +2.5/5.0
- Rent growth +1.5/5.0
- Appreciation +0.0/10.0
$250,000
🖨 Deal sheet 📄 Offer letter ✓ Due diligence
Multi-family units
County records classify this as Multi-Family (2-4 Unit). Listing-text estimate: 1 unit. estimate disagrees with records
Listing remarks
Enjoy this wonderful quaint 2 bedroom home near UCF! The kitchen comes complete with gorgeous hardwood cabinets and granite countertops! The kitchen and baths are tiled while rooms are finished with beautiful hardwood floors. Master bedrooms complete with en-suite bathroom. Great location just minutes from UCF and major roads 408, 417, Downtown Orlando and East Colonial.
Key facts
- Hardwood cabinets
- Tiled kitchen
- Tiled baths
Tags
Neighborhood map
What this means for you Summary
Snapshot
- This is a 2-bed/2.0-bath multifamily listed at $250k.
Deal economics
- At list price, monthly cash flow is $578 ($7k/yr) — positive.
- The deal already cash-flows at list — no discount required.
- Meets the 1% rule at list price ($3k rent vs $250k).
- Recommended offer: $242k (3.0% below list) — sets the bar for market timing.
- Cap rate 9.1% vs local median 3.9% in University — top-decile yield for the area; either an underpriced asset or a hidden risk that comps aren't pricing in. Stress-test before assuming the spread holds.
Location & tenants
- Location reads 85/100 on livability (#28 in FL, #603 nationally) — a professional / high-income tenant draw. Strengths: amenities A+, commute A+, cost of living A+.
- Orange (suburban): math 46% / reading 51% proficiency, ranked #43 of 73 in FL (top 59%) — families likely to look elsewhere, expect single-tenant / working-renter base with shorter leases.
- Market conditions: Rents falling (-4.0%/yr); 101 active listings in the ZIP; 40 comparable units currently listed for rent nearby; rentals at typical pace (median 22d on market — plan ~3-4 weeks tenant-placement turnaround); 8,053 units permitted in Orange County in 2024 (3,133 in 5+ unit buildings).
- At $2,903/mo this rent would consume 54% of the median local household income ($65k/yr) (locally 1705% of renters already pay >50% of income on rent) — very limited rent-growth headroom before tenants either downsize or default.
Forward outlook
- Local home prices are declining (-3.0%/yr); year-one equity from $2k of loan paydown is wiped out by about $8k of value loss. Plan a longer hold.
- Orange County population projected at +52% by 2050 — long-run rental-demand tailwind backs the buy-and-hold thesis.
Negotiation context
- It's been on market 37 days — a 3% lower offer ($242k) is reasonable based on typical stale-listing flexibility.
- Current owner paid $142k; list at $250k implies a 75% gain — meaningful room to come down on a strong offer.
Risks & watch-outs
- Climate carrying-cost: severe wind risk, 99% chance of damaging wind over 30y; extreme-heat days projected 7→23/yr by 2055 (HVAC capex compounding) — expect insurance premiums to compound above CPI over the hold.
Questions for the listing agent
- It's been on market 37 days. Have you received any prior offers? Is the seller open to a 3% concession, seller financing, or rate buy-down credit?
- Is there a deadline driving the sale (1031 exchange, divorce, estate, relocation)? That informs how much negotiation room exists.
- What's the average days-on-market for RENTAL listings here right now (not sales)? A rising rental-DOM trend means longer vacancies and softer asking-rent achievability than the comps imply.
- What's the recent tenant-quality profile in this submarket — average credit score on applications, eviction rate, late-payment / NSF rate, and stable-employment percentage? A property-management company in the area should have these aggregated.
- How much new apartment / multifamily construction is in the pipeline within 1–3 miles? Heavy new supply (>2% of stock underway) typically softens rents 12–24 months out; light construction supports rent growth.
Investment metrics
- 1% rule
- 1.16% ✓
- Cap rate
- 9.07%
- Cash-on-cash
- 9.91%
- DSCR
- 1.44
- GRM
- 7.2
CMA / ARV
No comps found within radius.
Projected returns pro-forma
-3.0% appreciation · 0.0% rent growth · sell at horizon
- IRR
- -4.8%
- Equity multiple
- 0.83×
- Total profit
- $-12,164
- Equity at exit
- $37,276
- IRR
- 1.0%
- Equity multiple
- 1.06×
- Total profit
- $4,086
- Equity at exit
- $21,615
Cash invested: $70,000 (down + closing). Projections, not guarantees.
Landlord ↔ Tenant lean methodology
- Overall (STATE)
- 87 Strongly Landlord-Friendly
- State Florida
- 87 Strongly Landlord-Friendly · R+3
- County
- — inherits STATE
- City
- — inherits STATE
ZIP-level market 32826
- Home prices YoY
- -17.0%
- Rents YoY
- -4.0%
- Active inventory
- 101
- Price-to-rent
- 14.4×
Monthly cashflow live
- Estimated rent
- $2,903 medium interval (Pro) →
- Mortgage (P&I)
- −$1,311
- Tax from tax record
- −$300 /mo · $3,601/yr
- Insurance
- −$104
- HOA
- −$0
- Vacancy / Maint / Mgmt
- −$610
- Net cashflow
- $578
Break-even live
2-unit breakdown (identical units grouped — click to expand)
| Units | Beds | Baths | Est. rent |
|---|---|---|---|
| 2× units | 2 | 2 | $2,904 |
| #1 | 2 | 2 | $1,452 |
| #2 | 2 | 2 | $1,452 |
| Total (2 units) | $2,903 | ||
UW: 25.0% down · 7.5% · 30yr · 1.5% tax · 5.0% vac · 8.0% maint · 8.0% mgmt
Financing live
Cash to close
- Down payment
- $62,500
- Closing costs
- $7,500
- Reserves months
- —
- Total cash needed
- —
Loan-product check · same deal, 3 products live
Conventional
25% down · 7.5% · 30yr
- Down + closing
- —
- Monthly P&I
- —
- Monthly cashflow
- —
- DSCR
- —
- Eligible?
- —
Personal DTI + credit; lowest rate.
DSCR
20% down · 8.5% · 30yr
- Down + closing
- —
- Monthly P&I
- —
- Monthly cashflow
- —
- DSCR
- —
- Eligible?
- —
No personal income docs; deal must DSCR.
Hard money
10% down · 12.0% · 12mo
- Down + closing
- —
- Monthly P&I
- —
- Monthly cashflow
- —
- DSCR
- —
- Eligible?
- —
Short-term bridge; refi at stabilization.
Rent comps 40 comps
| Address | Beds | Baths | Sqft | Rent | $/sqft | DOM | Units | Dist |
|---|---|---|---|---|---|---|---|---|
| 2714 Adela Ave Orlando, FL | 2.0 | 2.0 | 880 | $1,525 | $1.73 | 22d | 1 | 0.04mi |
| 2612 Adela Ave Unit 2612 Orlando, FL | 2.0 | 2.0 | 880 | $1,550 | $1.76 | 4d | 1 | 0.11mi |
| 12352 Fox Hound Ct Orlando, FL | 2.0 | 1.5 | 1006 | $1,600 | $1.59 | 8d | 1 | 0.17mi |
| 2724 Gray Fox Ln Orlando, FL | 2.0 | 1.5 | 992 | $1,500 | $1.51 | 24d | 1 | 0.20mi |
| 2720 Gray Fox Ln Orlando, FL | 2.0 | 1.5 | 992 | $1,500 | $1.51 | 22d | 1 | 0.20mi |
| 12240 Eastcove Dr Orlando, FL | 2.0 | 2.0 | 837 | $1,599 | $1.91 | 20d | 1 | 0.21mi |
| 12216 Fox Hound Ln Orlando, FL | 2.0 | 2.0 | 1048 | $1,650 | $1.57 | 22d | 1 | 0.23mi |
| 12222 Fox Hound Ln Orlando, FL | 2.0 | 2.0 | 1060 | $1,900 | $1.79 | 3d | 1 | 0.23mi |
| 2547 N Alafaya Trl #92 Orlando, FL | 2.0 | 1.0 | 850 | $1,380 | $1.62 | 8d | 1 | 0.24mi |
| 2533 N Alafaya Trl #62 Orlando, FL | 2.0 | 1.0 | 850 | $1,295 | $1.52 | 18d | 1 | 0.24mi |
| 2521 N Alafaya Trl #37 Orlando, FL | 2.0 | 1.0 | 850 | $1,420 | $1.67 | 24d | 1 | 0.25mi |
| 2519 N Alafaya Trl #34 Orlando, FL | 2.0 | 1.0 | 850 | $1,450 | $1.71 | 24d | 1 | 0.25mi |
| 2549 N Alafaya Trl Orlando, FL | 2.0 | 1.0 | 850 | $1,200 | $1.41 | 4d | 1 | 0.26mi |
| 2557 N Alafaya Trl #110 Orlando, FL | 2.0 | 1.0 | 900 | $1,295 | $1.44 | 18d | 1 | 0.28mi |
| 2515 N Alafaya Trl Orlando, FL | 2.0 | 1.0 | 850 | $1,295 | $1.52 | 22d | 1 | 0.28mi |
| 2565 N Alafaya Trl Orlando, FL | 2.0 | 1.0 | 850 | $1,495 | $1.76 | 24d | 1 | 0.29mi |
| 2507 N Alafaya Trl #12 Orlando, FL | 2.0 | 1.0 | 850 | $1,300 | $1.53 | 20d | 1 | 0.30mi |
| 12164 Pepperdine Pl Orlando, FL | 2.0 | 2.0 | 960 | $1,525 | $1.59 | 24d | 1 | 0.30mi |
| 2509 N Alafaya Trl #16 Orlando, FL | 2.0 | 1.0 | 850 | $1,495 | $1.76 | 24d | 1 | 0.31mi |
| 2505 N Alafaya Trl #8 Orlando, FL | 2.0 | 1.0 | 850 | $1,395 | $1.64 | 24d | 1 | 0.31mi |
| 2505 N Alafaya Trl Orlando, FL | 2.0 | 1.0 | 850 | $1,395 | $1.64 | 24d | 1 | 0.31mi |
| 2643 Laser Ct Orlando, FL | 2.0 | 2.0 | 1033 | $1,550 | $1.50 | 2d | 1 | 0.32mi |
| 12165 Pepperdine Pl Orlando, FL | 2.0 | 2.0 | 960 | $1,900 | $1.98 | 24d | 1 | 0.33mi |
| 2550 N Alafaya Trl Orlando, FL | 1.0–3.0 | 1.0–2.0 | 870 | $1,512 | $1.74 | 8d | 4 | 0.37mi |
| 12078 Tift Cir Orlando, FL | 2.0 | 2.5 | 935 | $1,550 | $1.66 | 24d | 1 | 0.37mi |
| 12062 Tift Cir Orlando, FL | 2.0 | 2.5 | 960 | $1,800 | $1.88 | 24d | 1 | 0.41mi |
| 12058 Tift Cir Orlando, FL | 2.0 | 2.5 | 935 | $1,650 | $1.76 | 24d | 1 | 0.41mi |
| 12034 Tift Cir Unit 12038TIF Orlando, FL | 2.0 | 2.0 | 960 | $1,549 | $1.61 | 24d | 1 | 0.47mi |
| 11640 Anjali Ct Unit 1 Orlando, FL | 2.0 | 2.0 | 982 | $1,649 | $1.68 | 22d | 1 | 0.61mi |
| 12221 E Colonial Dr Orlando, FL | 2.0 | 1.0–2.0 | 817 | $2,015 | $2.47 | 3d | 10 | 0.82mi |
| 1421 Sophie Blvd Orlando, FL | 2.0 | 2.0 | 1087 | $1,795 | $1.65 | 18d | 1 | 1.00mi |
| 2708 Geoffrey Dr Orlando, FL | 3.0 | 1.0 | 1043 | $1,700 | $1.63 | 4d | 1 | 1.03mi |
| 1928 Bonneville Dr Orlando, FL | 2.0 | 2.0 | 1000 | $1,590 | $1.59 | 8d | 1 | 1.08mi |
| 3544 Khayyam Ave Orlando, FL | 2.0 | 2.5 | 950 | $1,490 | $1.57 | 8d | 1 | 1.09mi |
| 3564 Aristotle Ave Unit 3564 Orlando, FL | 2.0 | 2.0 | 1013 | $1,320 | $1.30 | 24d | 1 | 1.10mi |
| 3566 Aristotle Ave Orlando, FL | 2.0 | 2.0 | 1014 | $1,320 | $1.30 | 18d | 1 | 1.10mi |
| 12137 Ashton Manor Way Orlando, FL | 1.0–3.0 | 1.0–2.0 | 1051 | $1,693 | $1.61 | 3d | 8 | 1.11mi |
| 1820 Bonneville Dr Unit 1820 Orlando, FL | 3.0 | 2.5 | 850 | $1,595 | $1.88 | 24d | 1 | 1.11mi |
| 3569 Khayyam Ave Unit 5 Orlando, FL | 1.0 | 1.0 | 550 | $1,050 | $1.91 | 24d | 1 | 1.14mi |
| 10207 N Alafaya Trl Unit 10207 Orlando, FL | 1.0 | 1.0 | 583 | $1,225 | $2.10 | 24d | 1 | 1.17mi |
Listing history 17 events
-
2026-06-18days on market $250,000 Active 37 DOM
-
2026-06-17days on market $250,000 Active 36 DOM
-
2026-06-16days on market $250,000 Active 35 DOM
-
2026-06-15days on market $250,000 Active 34 DOM
-
2026-06-13days on market $250,000 Active 32 DOM
-
2026-06-13days on market $250,000 Active 31 DOM
-
2026-06-09days on market $250,000 Active 28 DOM
-
2026-06-08days on market $250,000 Active 27 DOM
-
2026-06-07days on market $250,000 Active 26 DOM
-
2026-06-04days on market $250,000 Active 23 DOM
-
2026-06-03days on market $250,000 Active 22 DOM
-
2026-06-02days on market $250,000 Active 21 DOM
-
2026-06-02days on market $250,000 Active 20 DOM
-
2026-05-31days on market $250,000 Active 19 DOM
-
2026-05-12$250,000 Active
-
2019-08-06soldstatus $142,500
-
2014-03-05soldstatus $37,000
ⓘ Source: listings_history table (triggers on properties + properties_extension) + one-shot
backfill from property_details.listing_events for pre-trigger history.
Tax reassessment forecast FL · Resets to sale price
- Current annual tax
- $3,601 · $300/mo
- Projected year-2 tax
- $3,601 · $300/mo
- Expected delta
- $0/yr ($0/mo · 0.0%)
ⓘ Screening estimate from a state-policy table — verify with the county assessor before closing.
Climate risk First Street
- Flood 1/10 Low FEMA zone X (unshaded) · 0% chance over 30 yrs
- Wildfire 3/10 Moderate
- Heat 9/10 Extreme 7 d/yr ≥108°F today · 23 d/yr by 30 yrs out
- Wind 9/10 Extreme 99% chance of damaging wind over 30 yrs
- Air quality 2/10 Low 2 unhealthy d/yr today · 2 by 30 yrs out
Nearby sold comps map
Loading sold comps map…
Walkable amenities ~0.75 mi
Loading nearby amenities…
Taxation est. · year 1
- Rental income
- $34,836
- − Mortgage interest
- −$14,004
- − Property taxes
- −$3,601
- − Insurance
- −$1,250
- − Repairs & maintenance
- −$2,787
- − Management
- −$2,787
- − Depreciation
- −$7,273
- Taxable income
- $3,134
- Est. tax owed @ 24.0%
- −$752
- After-tax cash flow
- $6,185/yr
For passive investors: Depreciation is non-cash, so a rental often shows a tax loss while cash-flowing — sheltering income. Rental losses are passive: they offset passive income freely, and up to $25,000/yr can offset ordinary (W-2) income if you actively participate and your MAGI is under $100k (phasing out to $0 by $150k); unused losses carry forward. On sale, claimed depreciation is recaptured at up to 25%, and gains may owe capital-gains tax (a 1031 exchange can defer both). Figures are a year-1 estimate at your 24.0% rate — not tax advice; consult a CPA.
Schools (NCES district)
- District
- Orange
- NCES district ID
- 1201440
- Math proficiency
- 46% ▼ -9.00%
- Reading proficiency
- 51% ▼ -2.00%
- Median HH income
- $49,350
- Composite
- 41.47/100
- National rank
- #3461
- State rank
- #43 of 73 in FL
Livability — University
- Score
- 85/100
- State rank
- #28
- US rank
- #603
Category grades
Schools grade is shown separately in the Schools card above.
Census & demographics
- Census place
- University, FL
- County
- Orange County · 1,471,359 people
- City population
- 41,570
- Metro
- Orlando-Kissimmee-Sanford, FL
- Population (ZIP)
- 29,006
- Household income
- $64,755
- Rent vs Own
- Severe rent burden
- 1705.0
Population outlook (Orange County) Hauer SSP2
- Today (2025)
- 1,618,226 people
- By 2030
- 1,787,404 · +10.5%
- By 2040
- 2,125,621 · +31.4%
- By 2050
- 2,454,016 · +51.6%
- By 2075
- 3,173,711 · +96.1%
- By 2100
- 3,607,781 · +122.9%
Race, ethnicity, and origin ACS 2023
- Neighborhood character
- Diverse neighborhood (Simpson 0.64)
- Race & ethnicity
- White 48% Hispanic / Latino 34% Two or more races 19% Black 9% Asian 4%
- Hispanic origin (detail)
- Mexican 3% Puerto Rican 16% Cuban 6% Dominican 1%
- Common ancestry
- Romanian 2% Slovak 1% Serbian 1%
- Foreign-born
- 15% · Canada
- Languages at home
- 70% English-only · Spanish 22% Other Indo-European 3% Other Asian/Pacific 1%
Political lean MEDSL · Orange
- 2024 margin
- D (+13.6) · D 56.1% · R 42.5% · Other 1.3%
- 2008→2024 swing
- -5.0pp toward R · 2008: 18.6pp · 2024: 13.6pp
- All cycles
- 2024: D+13.6 2020: D+23.1 2016: D+24.6 2012: D+18.2 2008: D+18.6
Not yet ingested
- Civics
- —
Market trends
- HPI YoY
- ▼ -65.30%
- Current HPI
- 318.563
- Rent YoY
- ▼ -4.05%
- Metro
- Orlando-Kissimmee-Sanford, FL
- State GDP YoY
- ▲ 3.28%
- F500 in state
- 36
Industry mix (Fortune 500 HQ in FL)
| Industry | F500 HQs | Revenue |
|---|---|---|
| Industrial Technology | 2 | $29B |
|
||
| Insurance | 2 | $17B |
|
||
| Retail | 1 | $60B |
|
||
| Technology Distribution | 1 | $58B |
|
||
| Homebuilding | 1 | $35B |
|
||
| Technology Manufacturing | 1 | $35B |
|
||
Price history
+575.7% since first listed3 events — show timeline
- 2026-05-12 Listed $250,000 FSBO.com
- 2019-08-06 Sold (Public Records) $142,500 Public Records
- 2014-03-05 Sold (Public Records) $37,000 Public Records
Property tax history
+10.3%/yrLatest (2025): $3,601 · +12.7% YoY. Source: county tax records.
Cash-flow waterfall
monthlySold comps — $/sqft
last 12 mo · ≤1 miLoading sold comps…