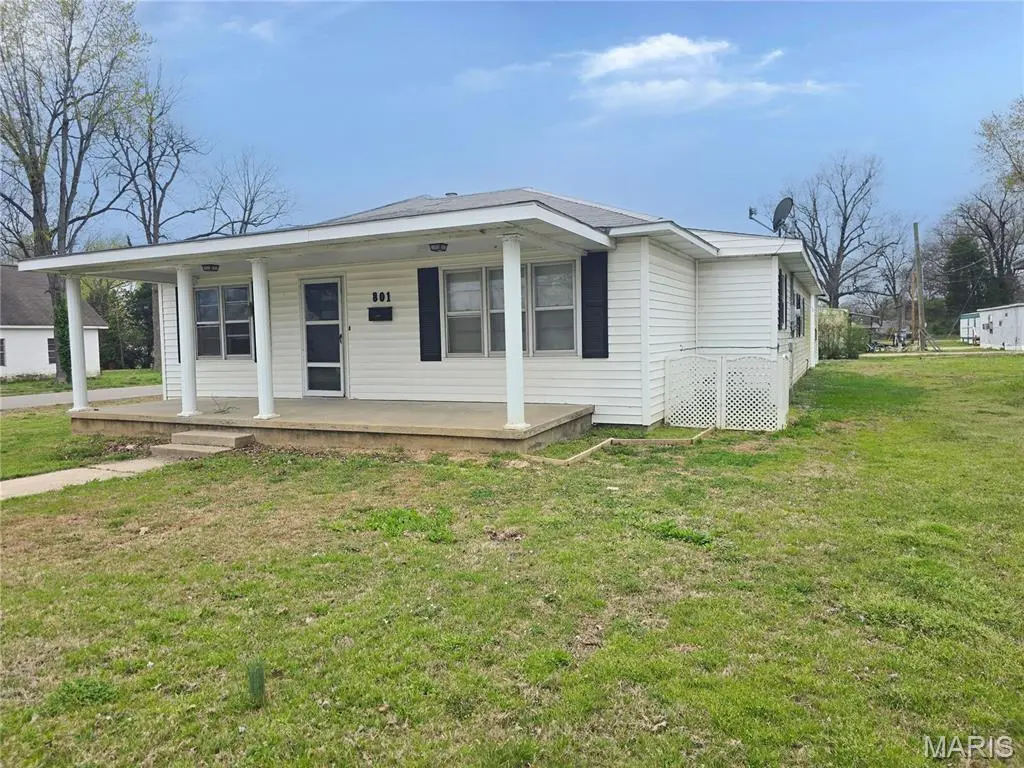
801 N Poplar St · Dexter, MO
Flood risk 1/10 · Minimal
- FEMA flood zone
- —
- Chance of flooding over 30 yrs
- 0.0%
- Est. flood insurance / yr
- —
Fire risk 1/10 · Minimal
- Est. fire insurance / yr
- $1,054 – $1,958
Heat risk 5/10 · Moderate
- Hot days now (above 110°F)
- 7 days/yr
- Hot days in 30 yrs
- 21 days/yr
Wind risk 3/10 · Minor
- Chance of severe wind over 30 yrs
- 5.0%
Air-quality risk 1/10 · Minimal
- Unhealthy air days now
- 0 days/yr
- Unhealthy air days in 30 yrs
- 0 days/yr
Risk factors via First Street. Map © Google.
Why this score? — see what drove the D- grade
The composite is a weighted blend of 9 inputs, each scored 0–100. Each bar is that input's sub-score; the figure is the points it added to the 100-point composite (weight × sub-score).
- Cash flow +11.8/30.0
- ARV discount +8.6/15.0
- Schools +3.6/10.0
- DSCR +3.5/10.0
- Livability +3.4/5.0
- 1% rule +2.7/10.0
- Rent growth +2.5/5.0
- Condition / age +2.5/5.0
- Appreciation +0.0/10.0
$99,900
🖨 Deal sheet 📄 Offer letter ✓ Due diligence
Listing remarks MLS
Lots of Storage!! This remodeled three bedroom home sits on large corner lot. Laminate flooring in living and dining room which covers the original hardwood that is throughout the rest of the house . Carpet in large Family room or could be a 4th bedroom with fireplace. New countertops in both bathrooms ,just installed! All new electrical . Added bonus is a 25x36 detached garage/Shop.
Key facts
- Dump station
- Electric hookup
- Covered area
Tags
Property features AI
Finance
- Other: Living area: 1,400 (per assessor); Lot dimensions: 50'x150' (approx. 0.1702 acres); No pool; Home warranty not provided; Seller may consider concessions; Directions: From Bus Hwy 60 turn onto N Poplar Street; house is the third block on the corner.
Exterior
- Parking: Driveway; 2-car garage
- Utilities: Public water; Public sewer; Electric service (Ameren); Electricity connected; Natural gas connected
- Home design: Single-family residence; One story; House
- Construction: Vinyl siding; Architectural shingle roof
- Exterior features: Covered patio/porch; Corner lot; Asphalt road frontage; City street frontage
Interior
- Kitchen: Dishwasher; Electric range; Refrigerator
- Bedrooms: 4 bedrooms (all on the main level)
- Bathrooms: 2 full bathrooms (on the main level)
- Heating & cooling: Natural gas heating; Central air; Ceiling fans
- Interior features: Dishwasher; Electric range; Refrigerator; Water heater; Ceiling fan(s); Central air; Natural gas heating
- Laundry & utility: Water heater
Neighborhood map
What this means for you Summary
Snapshot
- This is a 3-bed/2.0-bath other listed at $100k.
Deal economics
- At list price, monthly cash flow is $-27 ($-323/yr) — negative.
- To cash-flow at today's rent, offer at most $95k (4.8% below list).
- To meet the 1% rule (rent ≥ 1% of price), the offer needs to be $77k (22.6% below list).
- Recommended offer: $77k (22.6% below list) — sets the bar for 1% rule.
- Cap rate 6.0% vs local median 3.8% in Dexter — top-decile yield for the area; either an underpriced asset or a hidden risk that comps aren't pricing in. Stress-test before assuming the spread holds.
Location & tenants
- Location reads 67/100 on livability (#221 in MO) — a middle-class / working-renter tenant base. Strengths: cost of living A+, housing A; Watch: health & safety C-, crime D+, employment D.
- Dexter R-XI (town): math 41% / reading 45% proficiency, ranked #120 of 324 in MO (top 37%) — families likely to look elsewhere, expect single-tenant / working-renter base with shorter leases.
- Zoned schools: Dexter High (math 32% / reading 62%, grade D-, #155 of 521 statewide, top 32%, 587 students, 44% FRL) — zoned schools at 44% FRL track the district average.
- Market conditions: 86 active listings in the ZIP; 2 comparable units currently listed for rent nearby; 17 units permitted in Stoddard County in 2024 (0 in 5+ unit buildings).
Forward outlook
- Local home prices are declining (-3.0%/yr); year-one equity from $691 of loan paydown is wiped out by about $3k of value loss. Plan a longer hold.
- Stoddard County population projected at -12% by 2050 — secular population decline; favor cash flow + early exit over multi-decade hold.
Negotiation context
- It's been on market 55 days — a 3% lower offer ($97k) is reasonable based on typical stale-listing flexibility.
- 2 sale attempts; this cycle's ask has dropped $11.39M (99%) from the opening price — seller is motivated, your offer sets the floor, not the list.
Risks & watch-outs
- Watch-outs: built in 1954 — expect roof / HVAC / electrical / plumbing capex.
- Climate carrying-cost: extreme-heat days projected 7→21/yr by 2055 (HVAC capex compounding) — expect insurance premiums to compound above CPI over the hold.
Questions for the listing agent
- What do current leases actually rent for vs. the listed asking? Can we see a recent rent roll and the last 12 months of T-12 income?
- It's been on market 55 days. Have you received any prior offers? Is the seller open to a 23% concession, seller financing, or rate buy-down credit?
- Built in 1954 — when were the roof, HVAC, electrical panel, plumbing, and water heater last replaced?
- Is there a deadline driving the sale (1031 exchange, divorce, estate, relocation)? That informs how much negotiation room exists.
- Schools are D-rated, which usually means shorter tenancies and higher turnover. Who's the typical renter profile here, and what's been the actual vacancy rate?
- Crime grade is D in this area — have there been break-ins, vandalism, or insurance claims at this property in the last 3 years? What carrier currently insures it and at what premium?
- The area grade is low — what's the realistic commute time and amenity access for the typical tenant pool here? Any planned neighborhood developments (good or bad) we should know about?
- What's the average days-on-market for RENTAL listings here right now (not sales)? A rising rental-DOM trend means longer vacancies and softer asking-rent achievability than the comps imply.
- What's the recent tenant-quality profile in this submarket — average credit score on applications, eviction rate, late-payment / NSF rate, and stable-employment percentage? A property-management company in the area should have these aggregated.
- How much new for-sale + rental construction is in the pipeline within 1–3 miles? Heavy new supply typically softens prices + rents 12–24 months out; constrained supply supports both.
Investment metrics
- 1% rule
- 0.77% ✗
- Cap rate
- 5.97%
- Cash-on-cash
- -1.15%
- DSCR
- 0.95
- GRM
- 10.8
CMA / ARV
- ARV (median comp)
- $102,450
- List price
- $99,900
- Delta
- -2.49%
- Verdict
- FAIR
- Comps
- 20 within 1.0 mi
Projected returns pro-forma
-3.0% appreciation · 3.0% rent growth · sell at horizon
- IRR
- -18.2%
- Equity multiple
- 0.36×
- Total profit
- $-17,922
- Equity at exit
- $14,895
- IRR
- -10.6%
- Equity multiple
- 0.36×
- Total profit
- $-17,895
- Equity at exit
- $8,638
Cash invested: $27,972 (down + closing). Projections, not guarantees.
Landlord ↔ Tenant lean methodology
- Overall (STATE)
- 81 Strongly Landlord-Friendly
- State Missouri
- 81 Strongly Landlord-Friendly · R+10
- County
- — inherits STATE
- City
- — inherits STATE
ZIP-level market 63841
- Home prices YoY
- -25.6%
- Active inventory
- 86
- Price-to-rent
- 10.8×
Monthly cashflow live
- Estimated rent
- $773 medium interval (Pro) →
- Mortgage (P&I)
- −$524
- Tax from tax record
- −$72 /mo · $869/yr
- Insurance
- −$42
- HOA
- −$0
- Vacancy / Maint / Mgmt
- −$162
- Net cashflow
- $-27
Break-even live
UW: 25.0% down · 7.5% · 30yr · 1.5% tax · 5.0% vac · 8.0% maint · 8.0% mgmt
Financing live
Cash to close
- Down payment
- $24,975
- Closing costs
- $2,997
- Reserves months
- —
- Total cash needed
- —
Loan-product check · same deal, 3 products live
Conventional
25% down · 7.5% · 30yr
- Down + closing
- —
- Monthly P&I
- —
- Monthly cashflow
- —
- DSCR
- —
- Eligible?
- —
Personal DTI + credit; lowest rate.
DSCR
20% down · 8.5% · 30yr
- Down + closing
- —
- Monthly P&I
- —
- Monthly cashflow
- —
- DSCR
- —
- Eligible?
- —
No personal income docs; deal must DSCR.
Hard money
10% down · 12.0% · 12mo
- Down + closing
- —
- Monthly P&I
- —
- Monthly cashflow
- —
- DSCR
- —
- Eligible?
- —
Short-term bridge; refi at stabilization.
Rent comps 2 comps
| Address | Beds | Baths | Sqft | Rent | $/sqft | DOM | Units | Dist |
|---|---|---|---|---|---|---|---|---|
| 102 N 1st St Dexter, MO | 2.0 | 1.0 | 1000 | $760 | $0.76 | 43d | 2 | 0.67mi |
| 501 W Fannetta St Apt 12 Dexter, MO | 2.0 | 1.5 | 950 | $795 | $0.84 | 43d | 1 | 1.02mi |
Listing history 21 events
-
2026-06-18days on market $99,900 Active 55 DOM
-
2026-06-17days on market $99,900 Active 54 DOM
-
2026-06-16days on market $99,900 Active 53 DOM
-
2026-06-15days on market $99,900 Active 52 DOM
-
2026-06-13days on market $99,900 Active 50 DOM
-
2026-06-12days on market $99,900 Active 49 DOM
-
2026-06-09days on market $99,900 Active 46 DOM
-
2026-06-08days on market $99,900 Active 45 DOM
-
2026-06-07days on market $99,900 Active 44 DOM
-
2026-06-07days on market $99,900 Active 43 DOM
-
2026-06-04days on market $99,900 Active 40 DOM
-
2026-06-02days on market $99,900 Active 39 DOM
-
2026-06-01days on market $99,900 Active 38 DOM
-
2026-05-31days on market $99,900 Active 37 DOM
-
2026-04-24price $114,900 1471-char remark
-
2026-04-24$11,490,000 Active 1471-char remark
-
2025-11-11price $109,500
-
2025-08-07$115,000 Active
-
2021-03-02soldstatus
Show marketing remark (386 chars)
Lots of Storage!! This remodeled three bedroom home sits on large corner lot. Laminate flooring in living and dining room which covers the original hardwood that is throughout the rest of the house . Carpet in large Family room or could be a 4th bedroom with fireplace. New countertops in both bathrooms ,just installed! All new electrical . Added bonus is a 25x36 detached garage/Shop.
-
2017-12-12soldstatus
ⓘ Source: listings_history table (triggers on properties + properties_extension) + one-shot
backfill from property_details.listing_events for pre-trigger history.
Tax reassessment forecast MO · Resets to sale price
- Current annual tax
- $869 · $72/mo
- Projected year-2 tax
- $969 · $81/mo
- Expected delta
- +$100/yr (+$8/mo · 11.5%)
ⓘ Screening estimate from a state-policy table — verify with the county assessor before closing.
Climate risk First Street
- Flood 1/10 Low 0% chance over 30 yrs
- Wildfire 1/10 Low
- Heat 5/10 Major 7 d/yr ≥110°F today · 21 d/yr by 30 yrs out
- Wind 3/10 Moderate 5% chance of damaging wind over 30 yrs
- Air quality 1/10 Low 0 unhealthy d/yr today · 0 by 30 yrs out
Nearby sold comps map
Loading sold comps map…
Walkable amenities ~0.75 mi
Loading nearby amenities…
Taxation est. · year 1
- Rental income
- $9,282
- − Mortgage interest
- −$5,596
- − Property taxes
- −$869
- − Insurance
- −$500
- − Repairs & maintenance
- −$743
- − Management
- −$743
- − Depreciation
- −$2,906
- Taxable loss
- −$2,074
- Est. tax savings @ 24.0%
- +$498
- After-tax cash flow
- $175/yr
For passive investors: Depreciation is non-cash, so a rental often shows a tax loss while cash-flowing — sheltering income. Rental losses are passive: they offset passive income freely, and up to $25,000/yr can offset ordinary (W-2) income if you actively participate and your MAGI is under $100k (phasing out to $0 by $150k); unused losses carry forward. On sale, claimed depreciation is recaptured at up to 25%, and gains may owe capital-gains tax (a 1031 exchange can defer both). Figures are a year-1 estimate at your 24.0% rate — not tax advice; consult a CPA.
Schools (NCES district)
- District
- Dexter R-XI
- NCES district ID
- 2910770
- Math proficiency
- 41% ▲ 5.00%
- Reading proficiency
- 45% ▼ -3.00%
- Median HH income
- $37,349
- Composite
- 35.76/100
- National rank
- #4846
- State rank
- #120 of 324 in MO
Livability — Dexter
- Score
- 67/100
- State rank
- #221
- US rank
- #10879
Category grades
Schools grade is shown separately in the Schools card above.
Census & demographics
- Census place
- Dexter, MO
- Population (ZIP)
- 13,319
Population outlook (Stoddard County) Hauer SSP2
- Today (2025)
- 29,096 people
- By 2030
- 28,478 · -2.1%
- By 2040
- 27,073 · -7.0%
- By 2050
- 25,512 · -12.3%
- By 2075
- 21,740 · -25.3%
- By 2100
- 17,841 · -38.7%
Race, ethnicity, and origin ACS 2023
- Neighborhood character
- Predominantly White (92%)
- Race & ethnicity
- White 92% Two or more races 4% Hispanic / Latino 3%
- Common ancestry
- Iranian 5% Serbian 1% Slovak 1%
- Foreign-born
- 1% · China
- Languages at home
- 99% English-only · Spanish 1%
Political lean MEDSL · Stoddard
- 2024 margin
- Solid R (+73.9) · D 12.8% · R 86.7%
- 2008→2024 swing
- -34.1pp toward R · 2008: -39.8pp · 2024: -73.9pp
- All cycles
- 2024: R+73.9 2020: R+72.0 2016: R+69.3 2012: R+49.3 2008: R+39.8
Not yet ingested
- Civics
- —
Market trends
- HPI YoY
- ▼ -49.94%
- Current HPI
- 145.4225
- Rent YoY
- —
- Metro
- —
- State GDP YoY
- ▲ 1.84%
- F500 in state
- 20
Industry mix (Fortune 500 HQ in MO)
| Industry | F500 HQs | Revenue |
|---|---|---|
| Healthcare | 1 | $163B |
|
||
| Insurance | 1 | $21B |
|
||
| Industrial Technology | 1 | $17B |
|
||
| Retail | 1 | $16B |
|
||
| Industrial Distribution | 1 | $10B |
|
||
| Utilities | 1 | $9B |
|
||
Price history
-13.1% since first listed8 events — show timeline
- 2026-05-27 Price Changed $99,900 MARIS as Distributed by MLS Grid
- 2026-04-24 Price Changed $114,900 MARIS as Distributed by MLS Grid
- 2026-04-24 Listed $11,490,000 MARIS as Distributed by MLS Grid
- 2025-11-11 Price Changed $109,500 MARIS as Distributed by MLS Grid
- 2025-08-07 Listed $115,000 MARIS as Distributed by MLS Grid
- 2021-03-02 Sold (Public Records) — Public Records
- 2021-03-02 Sold (MLS) — MARIS as Distributed by MLS Grid
- 2017-12-12 Sold (Public Records) — Public Records
Property tax history
+5.5%/yrLatest (2025): $869 · +24.5% YoY. Source: county tax records.
Cash-flow waterfall
monthlySold comps — $/sqft
last 12 mo · ≤1 miLoading sold comps…