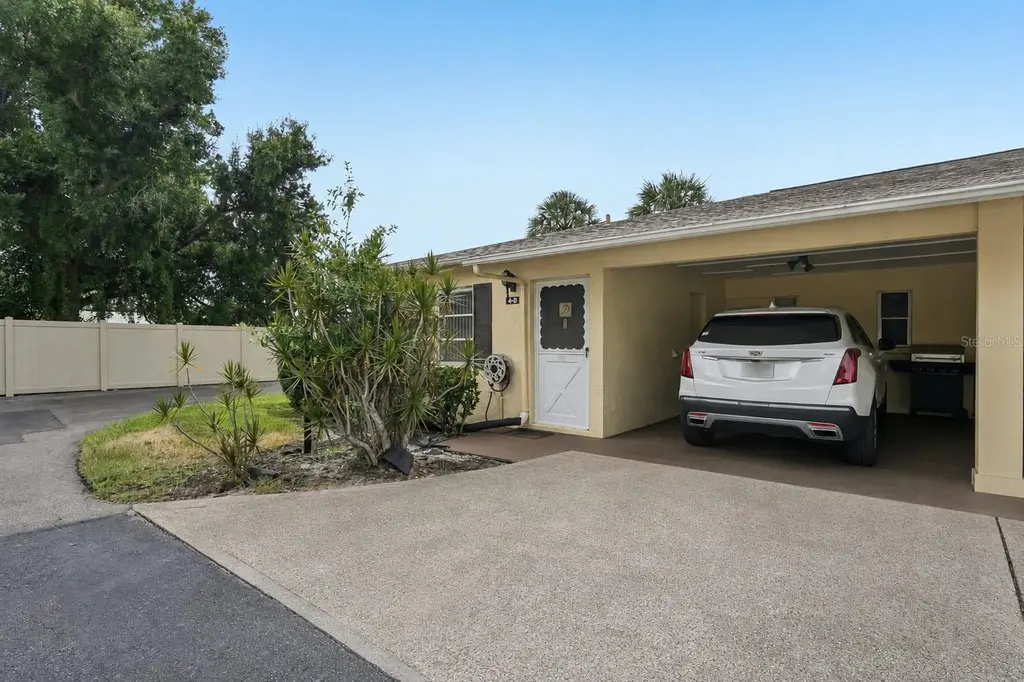
390 301 Blvd W Unit 4D · South Bradenton, FL
Flood risk 1/10 · Minimal
- FEMA flood zone
- X (unshaded)
- Chance of flooding over 30 yrs
- 0.0%
- Est. flood insurance / yr
- $507 – $1,088
Fire risk 1/10 · Minimal
- Est. fire insurance / yr
- $947 – $1,759
Heat risk 10/10 · Severe
- Hot days now (above 107°F)
- 7 days/yr
- Hot days in 30 yrs
- 30 days/yr
Wind risk 10/10 · Severe
- Chance of severe wind over 30 yrs
- 99.0%
Air-quality risk 3/10 · Minor
- Unhealthy air days now
- 2 days/yr
- Unhealthy air days in 30 yrs
- 2 days/yr
Risk factors via First Street. Map © Google.
Why this score? — see what drove the D grade
The composite is a weighted blend of 9 inputs, each scored 0–100. Each bar is that input's sub-score; the figure is the points it added to the 100-point composite (weight × sub-score).
- Cash flow +10.6/30.0
- 1% rule +8.8/10.0
- ARV discount +7.5/15.0
- Schools +4.4/10.0
- Livability +3.9/5.0
- DSCR +3.1/10.0
- Condition / age +2.5/5.0
- Rent growth +1.9/5.0
- Appreciation +0.0/10.0
$110,000
🖨 Deal sheet (PDF) 📄 Offer letter ✓ Due diligence
Listing remarks MLS
Lovely end unit Villa tucked away in a tranquil corner of Desoto Square Villas, which is a harmonious, friendly and well-run over-55 gated community. This is a spacious unit, with 2 bedrooms and 1 bathroom, plenty of storage, large open plan lounge and dining area, modern kitchen with door to the covered carport. There is a separate laundry room with stack-able washer dryer. The unit is very well presented, and comes turnkey furnished for the convenience of the buyer. There are excellent community facilities, including a large community pool, clubhouse, with lots of activities going on, billiards and fitness room, tennis court, shuffleboard courts, barbecue area with grill. Situated just a short drive from the world-famous Gulf beaches and close to all the facilities you could wish for. Just move right in and start enjoying all that Florida living has to offer.
Key facts
- Gated community
- Covered carport
- Updated kitchen
Tags
Property features AI
Finance
- Other: Unfurnished; Living area reported as 900 sq ft (public records); Building area reported as 1,114 sq ft
- Financial info: Total monthly fees: $561; Total annual fees: $6,732; Lease restrictions apply
- HOA & community: Condominium association (Condominium Associates/Landon Johnson); Monthly condo fee $561 (includes cable TV, common area taxes, pool, fidelity bond, internet, management, pest control, recreational facilities, sewer, trash, water); Association amenities: gated, pool, clubhouse, fitness center, tennis courts; Association approval required; Association recreation owned; buyer approval required; pets not allowed
Exterior
- Parking: Carport (1 space)
- Security: Gated community
- Utilities: Public water; Public sewer; Electricity connected; Natural gas connected; Sewer connected
- Home design: Residential condominium; One story; Unit on 4th floor; Faces southwest; Completed condition; Homestead exempt
- Construction: Block and stucco construction; Shingle roof; Slab foundation; Building number 390
- Exterior features: Corner lot; Asphalt road surface; Community pool (gunite, heated)
Interior
- Kitchen: Dishwasher; Range; Microwave; Refrigerator
- Bedrooms: 2 bedrooms
- Flooring: Tile; Wood
- Bathrooms: 1 full bathroom
- Heating & cooling: Central heating; Central air conditioning
- Interior features: Living room and dining room combined; Walk-in closet(s); Elevator in the building
- Laundry & utility: Washer; Dryer; Laundry closet
Neighborhood map
What this means for you Summary
Snapshot
- This is a 2-bed/1.0-bath condo listed at $110k.
Deal economics
- At list price, monthly cash flow is $-54 ($-642/yr) — negative.
- To cash-flow at today's rent, offer at most $101k (8.6% below list).
- Meets the 1% rule at list price ($2k rent vs $110k).
- Recommended offer: $101k (8.6% below list) — sets the bar for cash-flow.
- Cap rate 5.7% vs local median 4.1% in South Bradenton — top-decile yield for the area; either an underpriced asset or a hidden risk that comps aren't pricing in. Stress-test before assuming the spread holds.
Location & tenants
- Location reads 77/100 on livability (#195 in FL, #3,092 nationally) — a middle-class / working-renter tenant base. Strengths: cost of living A+, housing A+, health & safety A+; Watch: amenities C-, crime D+, commute F.
- Manatee (suburban): math 54% / reading 50% proficiency, ranked #26 of 73 in FL (top 36%) — acceptable for families but not a draw, mixed tenant base, ~2y average lease.
- Zoned schools: G D Rogers Garden- Bullock Elementary (math 28% / reading 25%, grade F, #2,009 of 2,144 statewide, top 94%, 504 students, 78% FRL); Martha B. King Middle School (math 48% / reading 39%, grade D, #329 of 571 statewide, top 58%, 848 students, 63% FRL); Southeast High School (math 25% / reading 34%, grade F, #447 of 667 statewide, top 68%, 1,716 students, 66% FRL) — zoned schools average 69% FRL vs 51% district-wide (19 pts higher); higher-poverty schools than district average — tighter screening recommended.
- Zoned-school proficiency averages 33% at this address vs 52% district-wide (-19 pts) — the specific schools serving this property underperform the Manatee average; the district grade overstates school quality for this exact location.
- Market conditions: Rents soft (-2.4%/yr); 321 active listings in the ZIP; 40 comparable units currently listed for rent nearby; rentals at typical pace (median 26d on market — plan ~3-4 weeks tenant-placement turnaround); 7,472 units permitted in Manatee County in 2024 (1,782 in 5+ unit buildings).
Forward outlook
- Local home prices are declining (-3.0%/yr); year-one equity from $761 of loan paydown is wiped out by about $3k of value loss. Plan a longer hold.
- Manatee County population projected at +43% by 2050 — long-run rental-demand tailwind backs the buy-and-hold thesis.
Negotiation context
- Only 9 days on market — expect competitive offers; lowballing is unlikely to land.
- 8 sale attempts since 21y ago with the ask held roughly flat each time — persistent listings suggest the price (not the market) is what's stuck; bring a comps-based counter.
- Current owner paid $70k; list at $110k implies a 57% gain — meaningful room to come down on a strong offer.
Risks & watch-outs
- Watch-outs: HOA is 37% of rent.
- Climate carrying-cost: severe wind risk, 99% chance of damaging wind over 30y; extreme-heat days projected 7→30/yr by 2055 (HVAC capex compounding) — expect insurance premiums to compound above CPI over the hold.
Questions for the listing agent
- What do current leases actually rent for vs. the listed asking? Can we see a recent rent roll and the last 12 months of T-12 income?
- Built in 1978 — when were the roof, HVAC, electrical panel, plumbing, and water heater last replaced?
- What does the HOA fee cover, when was the last increase, and are there any pending special assessments or reserve-fund shortfalls?
- Any open or pending special assessments — roof, HVAC, plumbing, elevator, façade? What's the per-unit balance and payoff schedule, and is the seller paying it off at close or rolling it to the buyer?
- Is there a deadline driving the sale (1031 exchange, divorce, estate, relocation)? That informs how much negotiation room exists.
- Schools are B-rated — typically a magnet for longer-tenancy family renters. What's the average tenant stay here, and is there a school-zone premium baked into asking?
- Crime grade is D in this area — have there been break-ins, vandalism, or insurance claims at this property in the last 3 years? What carrier currently insures it and at what premium?
- The area grade is low — what's the realistic commute time and amenity access for the typical tenant pool here? Any planned neighborhood developments (good or bad) we should know about?
- What's the average days-on-market for RENTAL listings here right now (not sales)? A rising rental-DOM trend means longer vacancies and softer asking-rent achievability than the comps imply.
- What's the recent tenant-quality profile in this submarket — average credit score on applications, eviction rate, late-payment / NSF rate, and stable-employment percentage? A property-management company in the area should have these aggregated.
- How much new apartment / multifamily construction is in the pipeline within 1–3 miles? Heavy new supply (>2% of stock underway) typically softens rents 12–24 months out; light construction supports rent growth.
Investment metrics
- 1% rule
- 1.38% ✓
- Cap rate
- 5.71%
- Cash-on-cash
- -2.09%
- DSCR
- 0.91
- GRM
- 6.1
CMA / ARV
No comps found within radius.
Projected returns pro-forma
-3.0% appreciation · 0.0% rent growth · sell at horizon
- IRR
- -25.3%
- Equity multiple
- 0.18×
- Total profit
- $-25,344
- Equity at exit
- $16,401
- IRR
- -52.6%
- Equity multiple
- -0.37×
- Total profit
- $-42,279
- Equity at exit
- $9,511
Cash invested: $30,800 (down + closing). Projections, not guarantees.
Landlord ↔ Tenant lean methodology
- Overall (STATE)
- 87 Strongly Landlord-Friendly
- State Florida
- 87 Strongly Landlord-Friendly · R+3
- County
- — inherits STATE
- City
- — inherits STATE
ZIP-level market 34205
- Rents YoY
- -2.4%
- Active inventory
- 321
- Price-to-rent
- 6.1×
Monthly cashflow live
- Estimated rent
- $1,513 high interval (Pro) →
- Mortgage (P&I)
- −$577
- Tax from tax record
- −$65 /mo · $777/yr
- Insurance
- −$46
- HOA
- −$561
- Vacancy / Maint / Mgmt
- −$318
- Net cashflow
- $-54
Break-even live
Sensitivity live
| Price | -10% $9 | -5% $-22 | +0% $-54 | +5% $-85 | +10% $-116 |
|---|---|---|---|---|---|
| Rent | -10% $-173 | -5% $-113 | +0% $-54 | +5% $6 | +10% $66 |
| Rate | -1.0pp $2 | -0.5pp $-26 | base $-54 | +0.5pp $-82 | +1.0pp $-111 |
UW: 25.0% down · 7.5% · 30yr · 1.5% tax · 5.0% vac · 8.0% maint · 8.0% mgmt
Financing live
Cash to close
- Down payment
- $27,500
- Closing costs
- $3,300
- Reserves months
- —
- Total cash needed
- —
Loan-product check · same deal, 3 products live
Conventional
25% down · 7.5% · 30yr
- Down + closing
- —
- Monthly P&I
- —
- Monthly cashflow
- —
- DSCR
- —
- Eligible?
- —
Personal DTI + credit; lowest rate.
DSCR
20% down · 8.5% · 30yr
- Down + closing
- —
- Monthly P&I
- —
- Monthly cashflow
- —
- DSCR
- —
- Eligible?
- —
No personal income docs; deal must DSCR.
Hard money
10% down · 12.0% · 12mo
- Down + closing
- —
- Monthly P&I
- —
- Monthly cashflow
- —
- DSCR
- —
- Eligible?
- —
Short-term bridge; refi at stabilization.
Rent comps 40 comps
| Address | Beds | Baths | Sqft | Rent | $/sqft | DOM | Units | Dist |
|---|---|---|---|---|---|---|---|---|
| 390 301 Blvd W Bradenton, FL | 2.0 | 2.0 | 1125 | $1,495 | $1.33 | 25d | 1 | 0.02mi |
| 505 30th Ave W Unit E406 Bradenton, FL | 2.0 | 2.0 | 1001 | $1,450 | $1.45 | 25d | 1 | 0.09mi |
| 515 30th Ave W Bradenton, FL | 2.0 | 2.0 | 1001 | $1,375 | $1.37 | 17d | 2 | 0.14mi |
| 425 30th Ave W Unit C308 Bradenton, FL | 2.0 | 2.0 | 924 | $1,590 | $1.72 | 25d | 1 | 0.14mi |
| 305 30th Ave W Bradenton, FL | 1.0–2.0 | 1.5–2.0 | 987 | $1,400 | $1.42 | 25d | 2 | 0.17mi |
| 305 30th Ave W Unit A207 Bradenton, FL | 2.0 | 2.0 | 1050 | $1,400 | $1.33 | 16d | 1 | 0.17mi |
| 907 34th Ave W Bradenton, FL | 3.0 | 1.0 | 985 | $1,599 | $1.62 | 21d | 1 | 0.29mi |
| 907 34th Ave W Unit B Bradenton, FL | 3.0 | 1.0 | 1000 | $1,795 | $1.79 | 25d | 1 | 0.29mi |
| 919 34th Ave W Bradenton, FL | 3.0 | 1.0 | 950 | $1,599 | $1.68 | 13d | 1 | 0.31mi |
| 350 34th Avenue Dr E Bradenton, FL | 1.0–3.0 | 1.0–2.0 | 893 | $1,335 | $1.49 | 3d | 6 | 0.42mi |
| 302 26th Ave W Bradenton, FL | 2.0–3.0 | 2.0 | 1043 | $1,575 | $1.51 | 3d | 23 | 0.49mi |
| 1308 36th Ave W Bradenton, FL | 1.0 | 1.0 | 715 | $1,199 | $1.68 | 25d | 1 | 0.50mi |
| 616 33rd Ave E Bradenton, FL | 2.0 | 2.0 | 750 | $1,600 | $2.13 | 25d | 1 | 0.60mi |
| 2422 11th St W Bradenton, FL | 2.0 | 1.0 | 900 | $1,445 | $1.61 | 25d | 1 | 0.61mi |
| 2244 9th St W Bradenton, FL | 1.0–2.0 | 1.0–2.0 | 768 | $1,323 | $1.72 | 25d | 4 | 0.62mi |
| 805 22nd Ave W Bradenton, FL | 1.0 | 1.0 | 790 | $1,200 | $1.52 | 25d | 1 | 0.64mi |
| 3506 14th St W Bradenton, FL | 3.0 | 1.0–2.0 | 874 | $1,725 | $1.97 | 25d | 5 | 0.64mi |
| 2409 13th St W Apt 2 Bradenton, FL | 2.0 | 1.0 | 770 | $1,175 | $1.53 | 25d | 1 | 0.67mi |
| 702 21st Ave W Unit C Bradenton, FL | 2.0 | 1.0 | 1000 | $1,350 | $1.35 | 5d | 1 | 0.71mi |
| 702 21st Ave W Unit B Bradenton, FL | 1.0 | 1.0 | 600 | $1,150 | $1.92 | 25d | 1 | 0.71mi |
| 2117 11th St W Bradenton, FL | 1.0 | 1.0 | 850 | $1,295 | $1.52 | 25d | 1 | 0.71mi |
| 2019 5th St W Bradenton, FL | 1.0–2.0 | 1.0–2.0 | 750 | $1,575 | $2.10 | 5d | 22 | 0.74mi |
| 718 26th Ave E Bradenton, FL | 2.0 | 1.0 | 750 | $1,600 | $2.13 | 25d | 1 | 0.74mi |
| 712 26th Ave E Bradenton, FL | 2.0 | 1.0 | 750 | $1,600 | $2.13 | 25d | 1 | 0.76mi |
| 2127 13th St W Unit B Bradenton, FL | 1.0 | 1.0 | 700 | $1,149 | $1.64 | 25d | 1 | 0.76mi |
| 2017 12th St W Bradenton, FL | 1.0 | 1.0 | 720 | $1,300 | $1.81 | 25d | 1 | 0.79mi |
| 4507 3rd Street Cir W #280 Bradenton, FL | 1.0 | 1.0 | 660 | $1,300 | $1.97 | 17d | 1 | 0.79mi |
| 505 22nd Ter E Bradenton, FL | 3.0 | 2.0 | 1039 | $1,989 | $1.91 | 4d | 1 | 0.82mi |
| 2315 17th Street Ln W Bradenton, FL | 1.0 | 1.0 | 528 | $1,200 | $2.27 | 25d | 1 | 0.89mi |
| 203 46th Avenue Ter W Bradenton, FL | 1.0 | 1.0 | 880 | $1,099 | $1.25 | 5d | 1 | 0.89mi |
| 4630 5th St W Ste 6 Bradenton, FL | 2.0 | 1.0 | 1000 | $1,600 | $1.60 | 13d | 1 | 0.90mi |
| 202 46th Avenue Ter W #409 Bradenton, FL | 2.0 | 2.0 | 1086 | $1,995 | $1.84 | 25d | 1 | 0.91mi |
| 304 47th Avenue Dr W #112 Bradenton, FL | 1.0 | 1.0 | 725 | $1,200 | $1.66 | 25d | 1 | 0.95mi |
| 3808 11th St E Bradenton, FL | 2.0 | 1.0 | 850 | $1,600 | $1.88 | 25d | 1 | 0.97mi |
| 655 Park Cir Bradenton, FL | 1.0 | 1.5 | 816 | $1,100 | $1.35 | 25d | 1 | 0.99mi |
| 1418 18th Avenue Dr W Unit 1418 Bradenton, FL | 3.0 | 2.0 | 1000 | $1,900 | $1.90 | 25d | 1 | 1.00mi |
| 1701 13th St W Apt A Bradenton, FL | 2.0 | 1.0 | 850 | $1,395 | $1.64 | 4d | 1 | 1.01mi |
| 4444 17th St W Unit B Bradenton, FL | 2.0 | 1.0 | 850 | $2,200 | $2.59 | 25d | 1 | 1.02mi |
| 1505 18th Avenue Dr W Bradenton, FL | 3.0 | 1.0 | 886 | $1,875 | $2.12 | 17d | 1 | 1.04mi |
| 2205 20th St W Bradenton, FL | 2.0 | 1.0 | 810 | $1,850 | $2.28 | 13d | 1 | 1.04mi |
HOA detail condo
- Monthly dues
- $561 · $6,732/yr
- Likely covers
- poolsecurity
- Assessments
- None detected in remarks — confirm with the listing agent.
Listing history 7 events
-
2026-06-22days on market $110,000 Active 9 DOM
-
2026-06-18days on market $110,000 Active 6 DOM
-
2026-06-17days on market $110,000 Active 5 DOM
-
2026-06-16days on market $110,000 Active 4 DOM
-
2026-06-15days on market $110,000 Active 3 DOM
-
2026-06-13remarks 699-char remark
-
2026-06-13$110,000 Active 1 DOM
ⓘ Source: listings_history table (triggers on properties + properties_extension) + one-shot
backfill from property_details.listing_events for pre-trigger history.
Tax reassessment forecast FL · Resets to sale price
- Current annual tax
- $777 · $65/mo
- Projected year-2 tax
- $913 · $76/mo
- Expected delta
- +$136/yr (+$11/mo · 17.5%)
ⓘ Screening estimate from a state-policy table — verify with the county assessor before closing.
Climate risk First Street
- Flood 1/10 Low FEMA zone X (unshaded) · 0% chance over 30 yrs
- Wildfire 1/10 Low
- Heat 10/10 Extreme 7 d/yr ≥107°F today · 30 d/yr by 30 yrs out
- Wind 10/10 Extreme 99% chance of damaging wind over 30 yrs
- Air quality 3/10 Moderate 2 unhealthy d/yr today · 2 by 30 yrs out
Nearby sold comps map
Loading sold comps map…
Walkable amenities ~0.75 mi
Loading nearby amenities…
Taxation est. · year 1
- Rental income
- $18,150
- − Mortgage interest
- −$6,162
- − Property taxes
- −$777
- − Insurance
- −$550
- − Repairs & maintenance
- −$1,452
- − Management
- −$1,452
- − HOA
- −$6,732
- − Depreciation
- −$3,200
- Taxable loss
- −$2,174
- Est. tax savings @ 24.0%
- +$522
- After-tax cash flow
- $-121/yr
For passive investors: Depreciation is non-cash, so a rental often shows a tax loss while cash-flowing — sheltering income. Rental losses are passive: they offset passive income freely, and up to $25,000/yr can offset ordinary (W-2) income if you actively participate and your MAGI is under $100k (phasing out to $0 by $150k); unused losses carry forward. On sale, claimed depreciation is recaptured at up to 25%, and gains may owe capital-gains tax (a 1031 exchange can defer both). Figures are a year-1 estimate at your 24.0% rate — not tax advice; consult a CPA.
Schools (NCES district)
- District
- Manatee
- NCES district ID
- 1201230
- Math proficiency
- 54% ▼ -6.00%
- Reading proficiency
- 50% ▼ -2.00%
- Median HH income
- $49,607
- Composite
- 44.43/100
- National rank
- #2806
- State rank
- #26 of 73 in FL
Livability — South Bradenton
- Score
- 77/100
- State rank
- #195
- US rank
- #3092
Category grades
Schools grade is shown separately in the Schools card above.
Census & demographics
- Census place
- South Bradenton, FL
- County
- Manatee County · 416,364 people
- Metro
- North Port-Sarasota-Bradenton, FL
- Population (ZIP)
- 31,946
- Household income
- $52,525
- Rent vs Own
- Severe rent burden
- 1736.0
Population outlook (Manatee County) Hauer SSP2
- Today (2025)
- 447,342 people
- By 2030
- 488,911 · +9.3%
- By 2040
- 567,934 · +27.0%
- By 2050
- 637,995 · +42.6%
- By 2075
- 781,970 · +74.8%
- By 2100
- 848,272 · +89.6%
Race, ethnicity, and origin ACS 2023
- Neighborhood character
- Predominantly White (65%)
- Race & ethnicity
- White 65% Hispanic / Latino 18% Black 10% Two or more races 9% Asian 2% Native American 1%
- Hispanic origin (detail)
- Mexican 7% Puerto Rican 4% Cuban 1%
- Common ancestry
- Hispanic 2% Romanian 2% Lithuanian 2%
- Foreign-born
- 15% · Canada, Vietnam
- Languages at home
- 78% English-only · Spanish 14% French/Haitian/Cajun 2% German/W. Germanic 1%
Political lean MEDSL · Manatee
- 2024 margin
- Strong R (+23.5) · D 37.9% · R 61.4%
- 2008→2024 swing
- -16.5pp toward R · 2008: -7.0pp · 2024: -23.5pp
- All cycles
- 2024: R+23.5 2020: R+16.1 2016: R+17.1 2012: R+12.5 2008: R+7.0
Not yet ingested
- Civics
- —
Market trends
- HPI YoY
- ▼ -310.18%
- Current HPI
- 369.8239
- Rent YoY
- ▼ -2.43%
- Metro
- North Port-Sarasota-Bradenton, FL
- State GDP YoY
- ▲ 3.28%
- F500 in state
- 36
Industry mix (Fortune 500 HQ in FL)
| Industry | F500 HQs | Revenue |
|---|---|---|
| Industrial Technology | 2 | $29B |
|
||
| Insurance | 2 | $17B |
|
||
| Retail | 1 | $60B |
|
||
| Technology Distribution | 1 | $58B |
|
||
| Homebuilding | 1 | $35B |
|
||
| Technology Manufacturing | 1 | $35B |
|
||
Price history
+233.3% since first listed25 events — show timeline
- 2026-06-12 Listed $110,000 Stellar MLS as Distributed by MLS Grid
- 2019-08-07 Sold (Public Records) $70,000 Public Records
- 2017-05-02 Sold (Public Records) $67,000 Public Records
- 2017-04-28 Sold (MLS) $67,000 Stellar MLS as Distributed by MLS Grid
- 2017-04-09 Pending — Stellar MLS as Distributed by MLS Grid
- 2017-04-06 Price Changed $69,995 Stellar MLS as Distributed by MLS Grid
- 2017-03-15 Listed $73,500 Stellar MLS as Distributed by MLS Grid
- 2016-11-21 Sold (Public Records) $64,900 Public Records
- 2016-11-16 Sold (MLS) $64,900 Stellar MLS as Distributed by MLS Grid
- 2016-10-04 Pending — Stellar MLS as Distributed by MLS Grid
- 2016-09-23 Listed $66,900 Stellar MLS as Distributed by MLS Grid
- 2016-07-22 Listing Removed — Stellar MLS as Distributed by MLS Grid
- 2016-02-17 Listed $69,000 Stellar MLS as Distributed by MLS Grid
- 2012-06-27 Sold (MLS) $26,000 Stellar MLS as Distributed by MLS Grid
- 2012-05-04 Listed $27,900 Stellar MLS as Distributed by MLS Grid
- 2012-05-03 Listing Removed — Stellar MLS as Distributed by MLS Grid
- 2011-12-27 Listed $32,900 Stellar MLS as Distributed by MLS Grid
- 2006-09-11 Sold (Public Records) $134,900 Public Records
- 2006-09-01 Sold (MLS) $134,900 Stellar MLS as Distributed by MLS Grid
- 2006-08-31 Sold (MLS) $134,900 Stellar MLS as Distributed by MLS Grid
- 2005-12-09 Listed $134,900 Stellar MLS as Distributed by MLS Grid
- 2005-12-04 Listed $134,900 Stellar MLS as Distributed by MLS Grid
- 1997-08-25 Sold (Public Records) $37,900 Public Records
- 1981-02-01 Sold (Public Records) $40,000 Public Records
- 1979-03-01 Sold (Public Records) $33,000 Public Records
Property tax history
-0.0%/yrLatest (2024): $777 · +2.8% YoY. Source: county tax records.
Cash-flow waterfall
monthlySold comps — $/sqft
last 12 mo · ≤1 miLoading sold comps…