 Multi-family
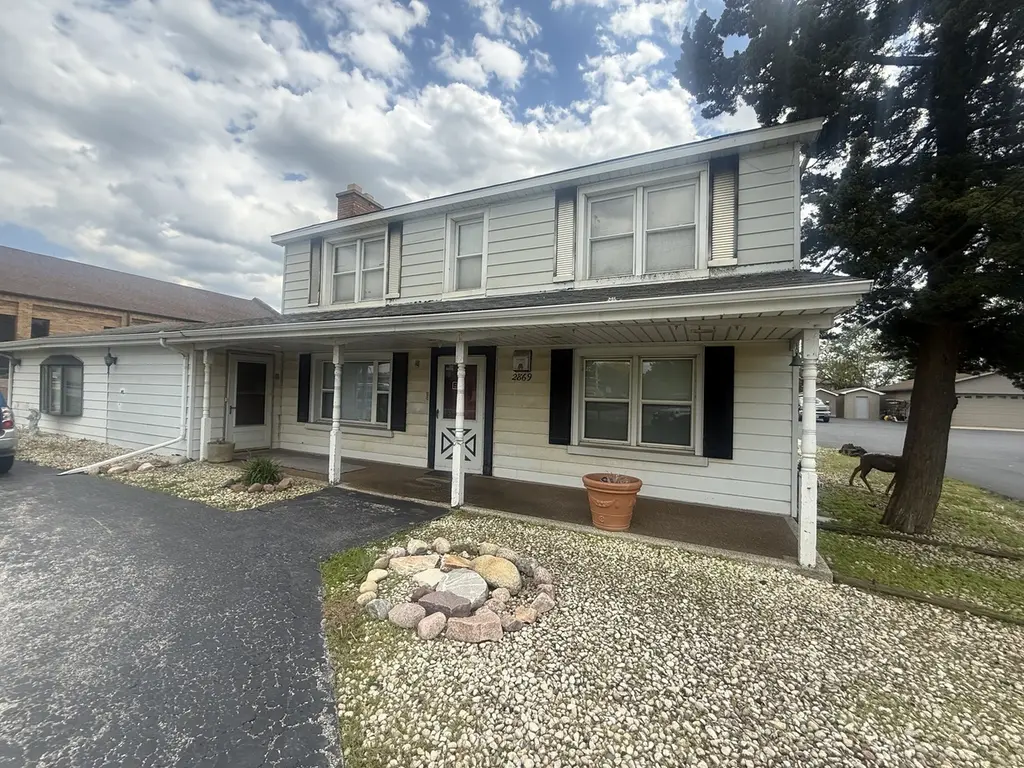
2869 Glenwood Lansing Rd · Lynwood, IL
Flood risk 4/10 · Minor
- FEMA flood zone
- X (unshaded)
- Chance of flooding over 30 yrs
- 0.22%
- Est. flood insurance / yr
- $473 – $860
Fire risk 3/10 · Minor
- Est. fire insurance / yr
- $804 – $1,492
Heat risk 3/10 · Minor
- Hot days now (above 102°F)
- 7 days/yr
- Hot days in 30 yrs
- 15 days/yr
Wind risk 2/10 · Minimal
- Chance of severe wind over 30 yrs
- 0.0%
Air-quality risk 2/10 · Minimal
- Unhealthy air days now
- 2 days/yr
- Unhealthy air days in 30 yrs
- 2 days/yr
Risk factors via First Street. Map © Google.
Why this score? — see what drove the B- grade
The composite is a weighted blend of 9 inputs, each scored 0–100. Each bar is that input's sub-score; the figure is the points it added to the 100-point composite (weight × sub-score).
- Cash flow +30.0/30.0
- 1% rule +10.0/10.0
- DSCR +10.0/10.0
- ARV discount +7.5/15.0
- Rent growth +4.1/5.0
- Livability +3.2/5.0
- Condition / age +2.5/5.0
- Schools +1.0/10.0
- Appreciation +0.0/10.0
$125,000
🖨 Deal sheet (PDF) 📄 Offer letter ✓ Due diligence
Multi-family units
County records classify this as Multi-Family (2-4 Unit). Listing-text estimate: 1 unit. estimate disagrees with records
Listing remarks
Cook County Zoning is Multi-Unit, Lynwood Zoning is Residential. and upstairs has a separate outside entrance. Upstairs has one bedroom, kitchen, living room and bath. Downstairs has two bedrooms. Property sits on over a half acre of land. This property presents an exceptional opportunity, though requires some work. Buyers will be responsible for full property clean-out and any necessary repairs. The property is being sold strictly "as is, " with no survey provided. All offers must include proof of funding and a pre-approval letter. All earnest money must be submitted in certified funds. Please note that the property details, including room count and lot size, are not guaranteed.
Key facts
- 0.61 acre lot
- 2 garage spots
- Built 1908
Property features AI
Finance
- Other: Possession at closing
- HOA & community: No master association fee required
Exterior
- Parking: Detached garage with 2 garage spaces (2 total parking spaces)
- Utilities: Water source: Lake Michigan; Natural gas heating
- Home design: Detached single-family home; 1.5-story layout; Fee simple ownership; Property age over 100 years; Vinyl siding
- Construction: Built before 1978; Vinyl siding exterior
- Exterior features: Lot dimensions approximately 100 x 265
Interior
- Kitchen: Main-level kitchen; Second-level kitchen (12 x 12)
- Bedrooms: Three bedrooms (master and another bedroom on main level; additional bedrooms on second level); Bedroom dimensions include 10 x 10 (master and one other) and 12 x 12
- Bathrooms: Two full bathrooms
- Interior features: Five total rooms; Crawl space basement
- Laundry & utility: Main-level laundry (4 x 6)
Neighborhood map
What this means for you Summary
Snapshot
- This is a 4-bed/2.0-bath multifamily listed at $125k.
Deal economics
- At list price, monthly cash flow is $1k ($13k/yr) — positive.
- The deal already cash-flows at list — no discount required.
- Meets the 1% rule at list price ($3k rent vs $125k).
- Recommended offer: $121k (3.0% below list) — sets the bar for market timing.
- Cap rate 17.1% vs local median 3.5% in Lynwood — top-decile yield for the area; either an underpriced asset or a hidden risk that comps aren't pricing in. Stress-test before assuming the spread holds.
Location & tenants
- Location reads 65/100 on livability (#635 in IL) — a middle-class / working-renter tenant base. Strengths: cost of living A+, housing A+, employment A; Watch: schools F, amenities F, commute F.
- Thornton Fractional Twp Hsd 215 (suburban): math 9% / reading 13% proficiency, ranked #563 of 620 in IL (top 91%) — low school quality limits family demand, transient renter base, plan for 1-2y turnover.
- Market conditions: Rents rising fast (+6.5%/yr); 224 active listings in the ZIP; 2 comparable units currently listed for rent nearby; 6,272 units permitted in Cook County in 2024 (4,658 in 5+ unit buildings).
- At $2,517/mo this rent would consume 49% of the median local household income ($62k/yr) (locally 1714% of renters already pay >50% of income on rent) — very limited rent-growth headroom before tenants either downsize or default.
Forward outlook
- Local home prices are declining (-3.0%/yr); year-one equity from $864 of loan paydown is wiped out by about $4k of value loss. Plan a longer hold.
- At projected returns (-3.0% appreciation + 6.5% rent growth), your $35k cash investment doubles in ~3 years — after that, you're playing with house money.
Negotiation context
- It's been on market 41 days — a 3% lower offer ($121k) is reasonable based on typical stale-listing flexibility.
- 3 sale attempts since 9y ago; this cycle's ask has dropped $50k (29%) from the opening price — seller is motivated, your offer sets the floor, not the list.
Risks & watch-outs
- Watch-outs: built in 1908 — expect roof / HVAC / electrical / plumbing capex.
Questions for the listing agent
- It's been on market 41 days. Have you received any prior offers? Is the seller open to a 3% concession, seller financing, or rate buy-down credit?
- Built in 1908 — when were the roof, HVAC, electrical panel, plumbing, and water heater last replaced?
- Is there a deadline driving the sale (1031 exchange, divorce, estate, relocation)? That informs how much negotiation room exists.
- Schools are F-rated, which usually means shorter tenancies and higher turnover. Who's the typical renter profile here, and what's been the actual vacancy rate?
- What's the average days-on-market for RENTAL listings here right now (not sales)? A rising rental-DOM trend means longer vacancies and softer asking-rent achievability than the comps imply.
- What's the recent tenant-quality profile in this submarket — average credit score on applications, eviction rate, late-payment / NSF rate, and stable-employment percentage? A property-management company in the area should have these aggregated.
- How much new apartment / multifamily construction is in the pipeline within 1–3 miles? Heavy new supply (>2% of stock underway) typically softens rents 12–24 months out; light construction supports rent growth.
Investment metrics
- 1% rule
- 2.01% ✓
- Cap rate
- 17.09%
- Cash-on-cash
- 38.57%
- DSCR
- 2.72
- GRM
- 4.1
CMA / ARV
No comps found within radius.
Projected returns pro-forma
-3.0% appreciation · 6.48% rent growth · sell at horizon
- IRR
- 38.6%
- Equity multiple
- 2.73×
- Total profit
- $60,547
- Equity at exit
- $18,638
- IRR
- 46.8%
- Equity multiple
- 6.30×
- Total profit
- $185,340
- Equity at exit
- $10,808
Cash invested: $35,000 (down + closing). Projections, not guarantees.
Landlord ↔ Tenant lean methodology
- Overall (STATE)
- 43 Moderately Tenant-Leaning
- State Illinois
- 43 Moderately Tenant-Leaning · D+7
- County
- — inherits STATE
- City
- — inherits STATE
ZIP-level market 60411
- Home prices YoY
- -33.9%
- Rents YoY
- 6.5%
- Active inventory
- 224
- Price-to-rent
- 4.1×
Monthly cashflow live
- Estimated rent
- $2,517 medium interval (Pro) →
- Mortgage (P&I)
- −$656
- Tax est. 1.5%
- −$156 /mo · $1,875/yr
- Insurance
- −$52
- HOA
- −$0
- Vacancy / Maint / Mgmt
- −$529
- Net cashflow
- $1,125
Break-even live
Sensitivity live
| Price | -10% $1,211 | -5% $1,168 | +0% $1,125 | +5% $1,082 | +10% $1,038 |
|---|---|---|---|---|---|
| Rent | -10% $926 | -5% $1,025 | +0% $1,125 | +5% $1,224 | +10% $1,324 |
| Rate | -1.0pp $1,188 | -0.5pp $1,157 | base $1,125 | +0.5pp $1,092 | +1.0pp $1,060 |
UW: 25.0% down · 7.5% · 30yr · 1.5% tax · 5.0% vac · 8.0% maint · 8.0% mgmt
Financing live
Cash to close
- Down payment
- $31,250
- Closing costs
- $3,750
- Reserves months
- —
- Total cash needed
- —
Loan-product check · same deal, 3 products live
Conventional
25% down · 7.5% · 30yr
- Down + closing
- —
- Monthly P&I
- —
- Monthly cashflow
- —
- DSCR
- —
- Eligible?
- —
Personal DTI + credit; lowest rate.
DSCR
20% down · 8.5% · 30yr
- Down + closing
- —
- Monthly P&I
- —
- Monthly cashflow
- —
- DSCR
- —
- Eligible?
- —
No personal income docs; deal must DSCR.
Hard money
10% down · 12.0% · 12mo
- Down + closing
- —
- Monthly P&I
- —
- Monthly cashflow
- —
- DSCR
- —
- Eligible?
- —
Short-term bridge; refi at stabilization.
Rent comps 2 comps
| Address | Beds | Baths | Sqft | Rent | $/sqft | DOM | Units | Dist |
|---|---|---|---|---|---|---|---|---|
| 2520 Cedar Glen Dr N Lynwood, IL | 3.0 | 2.5 | 1992 | $2,600 | $1.31 | 0d | 1 | 1.04mi |
| 18343 Oakwood Ave Lansing, IL | 4.0 | 2.0 | 1700 | $2,700 | $1.59 | 0d | 1 | 1.29mi |
Listing history 20 events
-
2026-06-21days on market $125,000 Active 41 DOM
-
2026-06-18days on market $125,000 Active 38 DOM
-
2026-06-17days on market $125,000 Active 37 DOM
-
2026-06-16days on market $125,000 Active 36 DOM
-
2026-06-15days on market $125,000 Active 35 DOM
-
2026-06-13pricedays on market $125,000 Active 33 DOM
-
2026-06-09days on market $175,000 Active 29 DOM
-
2026-06-08days on market $175,000 Active 28 DOM
-
2026-06-07days on market $175,000 Active 27 DOM
-
2026-06-04days on market $175,000 Active 24 DOM
-
2026-06-03days on market $175,000 Active 23 DOM
-
2026-06-02days on market $175,000 Active 22 DOM
-
2026-06-01days on market $175,000 Active 21 DOM
-
2026-05-31days on market $175,000 Active 20 DOM
-
2026-05-11$175,000 Active
-
2017-07-13historical
-
2017-01-25status Price Change
-
2017-01-24historical
-
2017-01-21price
-
2017-01-13New
ⓘ Source: listings_history table (triggers on properties + properties_extension) + one-shot
backfill from property_details.listing_events for pre-trigger history.
Climate risk First Street
- Flood 4/10 Moderate FEMA zone X (unshaded) · 22% chance over 30 yrs
- Wildfire 3/10 Moderate
- Heat 3/10 Moderate 7 d/yr ≥102°F today · 15 d/yr by 30 yrs out
- Wind 2/10 Low 0% chance of damaging wind over 30 yrs
- Air quality 2/10 Low 2 unhealthy d/yr today · 2 by 30 yrs out
Nearby sold comps map
Loading sold comps map…
Walkable amenities ~0.75 mi
Loading nearby amenities…
Taxation est. · year 1
- Rental income
- $30,208
- − Mortgage interest
- −$7,002
- − Property taxes
- −$1,875
- − Insurance
- −$625
- − Repairs & maintenance
- −$2,417
- − Management
- −$2,417
- − Depreciation
- −$3,636
- Taxable income
- $12,236
- Est. tax owed @ 24.0%
- −$2,937
- After-tax cash flow
- $10,561/yr
For passive investors: Depreciation is non-cash, so a rental often shows a tax loss while cash-flowing — sheltering income. Rental losses are passive: they offset passive income freely, and up to $25,000/yr can offset ordinary (W-2) income if you actively participate and your MAGI is under $100k (phasing out to $0 by $150k); unused losses carry forward. On sale, claimed depreciation is recaptured at up to 25%, and gains may owe capital-gains tax (a 1031 exchange can defer both). Figures are a year-1 estimate at your 24.0% rate — not tax advice; consult a CPA.
Schools (NCES district)
- District
- Thornton Fractional Twp Hsd 215
- NCES district ID
- 1738940
- Math proficiency
- 9% ▼ -3.00%
- Reading proficiency
- 13% ▼ -3.00%
- Median HH income
- $48,207
- Composite
- 10.27/100
- National rank
- #9793
- State rank
- #563 of 620 in IL
Livability — Lynwood
- Score
- 65/100
- State rank
- #635
- US rank
- #12997
Category grades
Schools grade is shown separately in the Schools card above.
Census & demographics
- Census place
- Lynwood, IL
- County
- Cook County · 4,486,803 people
- Metro
- Chicago-Naperville-Elgin, IL-IN-WI
- Population (ZIP)
- 52,175
- Household income
- $62,073
- Rent vs Own
- Severe rent burden
- 1714.0
Population outlook (Cook County) Hauer SSP2
- Today (2025)
- 5,347,519 people
- By 2030
- 5,357,703 · +0.2%
- By 2040
- 5,324,924 · -0.4%
- By 2050
- 5,230,762 · -2.2%
- By 2075
- 4,785,735 · -10.5%
- By 2100
- 4,188,836 · -21.7%
Race, ethnicity, and origin ACS 2023
- Neighborhood character
- Diverse neighborhood (Simpson 0.66)
- Race & ethnicity
- Black 49% Hispanic / Latino 26% White 19% Two or more races 11%
- Hispanic origin (detail)
- Mexican 22% Puerto Rican 2%
- Common ancestry
- Romanian 4% Portuguese 1% Lithuanian 1%
- Foreign-born
- 12% · Canada
- Languages at home
- 76% English-only · Spanish 21% Russian/Polish/Slavic 1% Other Indo-European 1%
Political lean MEDSL · Cook
- 2024 margin
- Solid D (+42.0) · D 70.4% · R 28.4% · Other 1.2%
- 2008→2024 swing
- -11.4pp toward R · 2008: 53.4pp · 2024: 42.0pp
- All cycles
- 2024: D+42.0 2020: D+50.3 2016: D+53.0 2012: D+49.4 2008: D+53.4
Not yet ingested
- Civics
- —
Market trends
- HPI YoY
- ▼ -108.75%
- Current HPI
- 212.4058
- Rent YoY
- ▲ 6.48%
- Metro
- Chicago-Naperville-Elgin, IL-IN-WI
- State GDP YoY
- ▲ 1.59%
- F500 in state
- 60
Industry mix (Fortune 500 HQ in IL)
| Industry | F500 HQs | Revenue |
|---|---|---|
| Insurance | 4 | $201B |
|
||
| Consumer Goods | 4 | $87B |
|
||
| Industrial Machinery | 3 | $64B |
|
||
| Healthcare | 2 | $55B |
|
||
| Retail / Pharmacy | 1 | $148B |
|
||
| Agriculture / Food | 1 | $86B |
|
||
Price history
6 events — show timeline
- 2026-05-11 Listed $175,000 MRED as Distributed by MLS Grid
- 2017-07-13 Listing Removed — MRED as Distributed by MLS Grid
- 2017-01-25 Relisted — MRED as Distributed by MLS Grid
- 2017-01-24 Listing Removed — MRED as Distributed by MLS Grid
- 2017-01-21 Price Changed — MRED as Distributed by MLS Grid
- 2017-01-13 Listed — MRED as Distributed by MLS Grid
Property tax history
+8.3%/yrLatest (2023): $6,295 · -19.3% YoY. Source: county tax records.
Cash-flow waterfall
monthlySold comps — $/sqft
last 12 mo · ≤1 miLoading sold comps…