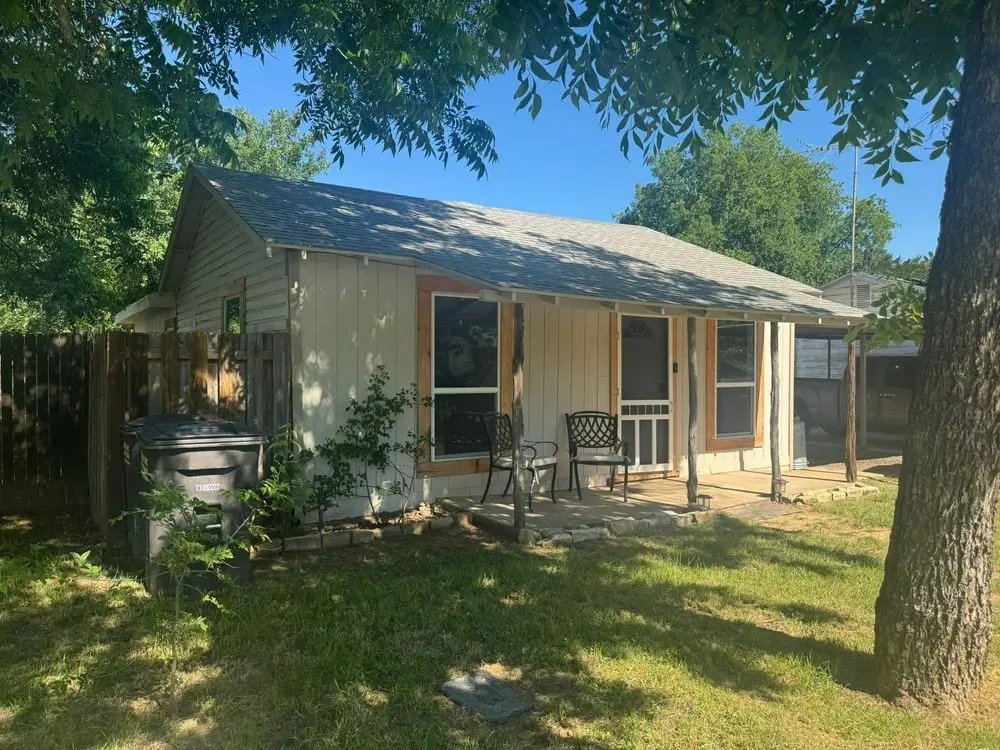
106 Gandy St · Lipan, TX
Flood risk 1/10 · Minimal
- FEMA flood zone
- X (unshaded)
- Chance of flooding over 30 yrs
- 0.0%
- Est. flood insurance / yr
- $507 – $1,088
Fire risk 8/10 · Major
- Est. fire insurance / yr
- $1,222 – $2,270
Heat risk 7/10 · Major
- Hot days now (above 108°F)
- 7 days/yr
- Hot days in 30 yrs
- 23 days/yr
Wind risk 6/10 · Moderate
- Chance of severe wind over 30 yrs
- 27.0%
Air-quality risk 2/10 · Minimal
- Unhealthy air days now
- 1 days/yr
- Unhealthy air days in 30 yrs
- 1 days/yr
Risk factors via First Street. Map © Google.
Why this score? — see what drove the B- grade
The composite is a weighted blend of 9 inputs, each scored 0–100. Each bar is that input's sub-score; the figure is the points it added to the 100-point composite (weight × sub-score).
- Cash flow +18.8/30.0
- ARV discount +14.9/15.0
- Appreciation +10.0/10.0
- DSCR +5.9/10.0
- 1% rule +4.3/10.0
- Schools +4.1/10.0
- Livability +3.1/5.0
- Rent growth +2.5/5.0
- Condition / age +2.5/5.0
$150,000
🖨 Deal sheet 📄 Offer letter ✓ Due diligence
Listing remarks MLS
Small and inviting!!! Yard with a minimum upkeep. Metal work Shop or storage building. Fenced in back yard. FAMILY???? Lipan ISD has a rich history of academic and extracurricular success for PK. KG 1-12.
Key facts
- 1,307 sq ft lot
- Built 1950
- Listed 14 days
Property features AI
Exterior
- Home design: Single-family house; Living area about 1,032 square feet
- Exterior features: Lot about 1,307 sq ft
Neighborhood map
What this means for you Summary
Snapshot
- This is a 3-bed/1.0-bath single-family listed at $150k.
Deal economics
- At list price, monthly cash flow is $151 ($2k/yr) — positive.
- The deal already cash-flows at list — no discount required.
- To meet the 1% rule (rent ≥ 1% of price), the offer needs to be $140k (6.7% below list).
- Recommended offer: $140k (6.7% below list) — sets the bar for 1% rule.
- Cap rate 7.5% vs local median 0.4% in Lipan — top-decile yield for the area; either an underpriced asset or a hidden risk that comps aren't pricing in. Stress-test before assuming the spread holds.
Location & tenants
- Location reads 62/100 on livability (#974 in TX) — a middle-class / working-renter tenant base. Strengths: cost of living A+, housing A+; Watch: schools C-, health & safety D+, employment D.
- Lipan ISD (rural): math 46% / reading 48% proficiency, ranked #211 of 826 in TX (top 26%) — families likely to look elsewhere, expect single-tenant / working-renter base with shorter leases.
- Market conditions: 102 active listings in the ZIP; 1 comparable units currently listed for rent nearby; 125 units permitted in Hood County in 2024 (0 in 5+ unit buildings).
Forward outlook
- In year one you build about $16k of equity ($1k loan paydown + $15k appreciation (10.0% local appreciation)).
- Hood County population projected at +29% by 2050 — long-run rental-demand tailwind backs the buy-and-hold thesis.
- At projected returns (10.0% appreciation + 3.0% rent growth), your $42k cash investment doubles in ~3 years — after that, you're playing with house money.
- By year 3, paydown + projected appreciation supports a ~$41k cash-out refi (75% LTV) — recoverable capital for the next deal without selling this one.
Negotiation context
- Only 14 days on market — expect competitive offers; lowballing is unlikely to land.
- 4 sale attempts since 15y ago with the ask held roughly flat each time — persistent listings suggest the price (not the market) is what's stuck; bring a comps-based counter.
Risks & watch-outs
- Watch-outs: built in 1950 — expect roof / HVAC / electrical / plumbing capex.
- Climate carrying-cost: major wind risk, 27% chance of damaging wind over 30y; severe wildfire risk; extreme-heat days projected 7→23/yr by 2055 (HVAC capex compounding) — expect insurance premiums to compound above CPI over the hold.
Questions for the listing agent
- Built in 1950 — when were the roof, HVAC, electrical panel, plumbing, and water heater last replaced?
- Is there a deadline driving the sale (1031 exchange, divorce, estate, relocation)? That informs how much negotiation room exists.
- Crime grade is F in this area — have there been break-ins, vandalism, or insurance claims at this property in the last 3 years? What carrier currently insures it and at what premium?
- What's the average days-on-market for RENTAL listings here right now (not sales)? A rising rental-DOM trend means longer vacancies and softer asking-rent achievability than the comps imply.
- What's the recent tenant-quality profile in this submarket — average credit score on applications, eviction rate, late-payment / NSF rate, and stable-employment percentage? A property-management company in the area should have these aggregated.
- How much new for-sale + rental construction is in the pipeline within 1–3 miles? Heavy new supply typically softens prices + rents 12–24 months out; constrained supply supports both.
Investment metrics
- 1% rule
- 0.93% ✗
- Cap rate
- 7.50%
- Cash-on-cash
- 4.31%
- DSCR
- 1.19
- GRM
- 8.9
CMA / ARV
- ARV (on-the-fly)
- $179,568
- Comps found
- 1
Show comp detail 1 sale within ~0.75 mi
| Address | Dist | Beds/Ba | Sqft | Sold | Price | $/sf | Match |
|---|---|---|---|---|---|---|---|
| 244 S Caddo St | 0.58mi | 3/2.0 | 1,146 (+11%) | 0mo | $199,000 | $174 | 50 |
Match score weights: distance 35% · size 25% · config 20% · recency 20%. Top-matched comps best support the ARV.
Projected returns pro-forma
10.0% appreciation · 3.0% rent growth · sell at horizon
- IRR
- 27.4%
- Equity multiple
- 3.17×
- Total profit
- $91,263
- Equity at exit
- $135,132
- IRR
- 23.9%
- Equity multiple
- 7.22×
- Total profit
- $261,150
- Equity at exit
- $291,417
Cash invested: $42,000 (down + closing). Projections, not guarantees.
Landlord ↔ Tenant lean methodology
- Overall (STATE)
- 87 Strongly Landlord-Friendly
- State Texas
- 87 Strongly Landlord-Friendly · R+5
- County
- — inherits STATE
- City
- — inherits STATE
ZIP-level market 76462
- Home prices YoY
- 6.2%
- Active inventory
- 102
- Price-to-rent
- 8.9×
Monthly cashflow live
- Estimated rent
- $1,400 medium interval (Pro) →
- Mortgage (P&I)
- −$787
- Tax from tax record
- −$106 /mo · $1,274/yr
- Insurance
- −$62
- HOA
- −$0
- Vacancy / Maint / Mgmt
- −$294
- Net cashflow
- $151
Break-even live
UW: 25.0% down · 7.5% · 30yr · 1.5% tax · 5.0% vac · 8.0% maint · 8.0% mgmt
Financing live
Cash to close
- Down payment
- $37,500
- Closing costs
- $4,500
- Reserves months
- —
- Total cash needed
- —
Loan-product check · same deal, 3 products live
Conventional
25% down · 7.5% · 30yr
- Down + closing
- —
- Monthly P&I
- —
- Monthly cashflow
- —
- DSCR
- —
- Eligible?
- —
Personal DTI + credit; lowest rate.
DSCR
20% down · 8.5% · 30yr
- Down + closing
- —
- Monthly P&I
- —
- Monthly cashflow
- —
- DSCR
- —
- Eligible?
- —
No personal income docs; deal must DSCR.
Hard money
10% down · 12.0% · 12mo
- Down + closing
- —
- Monthly P&I
- —
- Monthly cashflow
- —
- DSCR
- —
- Eligible?
- —
Short-term bridge; refi at stabilization.
Rent comps 1 comps
| Address | Beds | Baths | Sqft | Rent | $/sqft | DOM | Units | Dist |
|---|---|---|---|---|---|---|---|---|
| 129 Sears St Lipan, TX | 2.0 | 2.0 | 1000 | $1,400 | $1.40 | 3d | 1 | 0.48mi |
Listing history 11 events
-
2026-06-18days on market $150,000 Active 14 DOM
-
2026-06-17days on market $150,000 Active 13 DOM
-
2026-06-16days on market $150,000 Active 12 DOM
-
2026-06-15days on market $150,000 Active 11 DOM
-
2026-06-13days on market $150,000 Active 9 DOM
-
2026-06-13days on market $150,000 Active 8 DOM
-
2026-06-09days on market $150,000 Active 5 DOM
-
2026-06-08days on market $150,000 Active 4 DOM
-
2026-06-07days on market $150,000 Active 3 DOM
-
2026-06-04remarks 101-char remark
-
2026-06-04$150,000 Active 1 DOM
ⓘ Source: listings_history table (triggers on properties + properties_extension) + one-shot
backfill from property_details.listing_events for pre-trigger history.
Tax reassessment forecast TX · Resets to sale price
- Current annual tax
- $1,274 · $106/mo
- Projected year-2 tax
- $2,745 · $229/mo
- Expected delta
- +$1,471/yr (+$123/mo · 115.4%)
ⓘ Screening estimate from a state-policy table — verify with the county assessor before closing.
Climate risk First Street
- Flood 1/10 Low FEMA zone X (unshaded) · 0% chance over 30 yrs
- Wildfire 8/10 Severe
- Heat 7/10 Severe 7 d/yr ≥108°F today · 23 d/yr by 30 yrs out
- Wind 6/10 Major 27% chance of damaging wind over 30 yrs
- Air quality 2/10 Low 1 unhealthy d/yr today · 1 by 30 yrs out
Nearby sold comps map
Loading sold comps map…
Walkable amenities ~0.75 mi
Loading nearby amenities…
Taxation est. · year 1
- Rental income
- $16,800
- − Mortgage interest
- −$8,402
- − Property taxes
- −$1,274
- − Insurance
- −$750
- − Repairs & maintenance
- −$1,344
- − Management
- −$1,344
- − Depreciation
- −$4,364
- Taxable loss
- −$678
- Est. tax savings @ 24.0%
- +$163
- After-tax cash flow
- $1,971/yr
For passive investors: Depreciation is non-cash, so a rental often shows a tax loss while cash-flowing — sheltering income. Rental losses are passive: they offset passive income freely, and up to $25,000/yr can offset ordinary (W-2) income if you actively participate and your MAGI is under $100k (phasing out to $0 by $150k); unused losses carry forward. On sale, claimed depreciation is recaptured at up to 25%, and gains may owe capital-gains tax (a 1031 exchange can defer both). Figures are a year-1 estimate at your 24.0% rate — not tax advice; consult a CPA.
Schools (NCES district)
- District
- Lipan ISD
- NCES district ID
- 4827630
- Math proficiency
- 46% ▼ -4.00%
- Reading proficiency
- 48% ▼ -2.00%
- Median HH income
- $56,744
- Composite
- 40.94/100
- National rank
- #3608
- State rank
- #211 of 826 in TX
Livability — Lipan
- Score
- 62/100
- State rank
- #974
- US rank
- #17249
Category grades
Schools grade is shown separately in the Schools card above.
Census & demographics
- Census place
- Lipan, TX
- Population (ZIP)
- 4,920
Population outlook (Hood County) Hauer SSP2
- Today (2025)
- 63,502 people
- By 2030
- 67,459 · +6.2%
- By 2040
- 74,958 · +18.0%
- By 2050
- 81,922 · +29.0%
- By 2075
- 98,872 · +55.7%
- By 2100
- 107,796 · +69.8%
Race, ethnicity, and origin ACS 2023
- Neighborhood character
- Predominantly White (81%)
- Race & ethnicity
- White 81% Hispanic / Latino 17% Two or more races 4%
- Hispanic origin (detail)
- Mexican 17%
- Common ancestry
- Italian 5% Portuguese 5% Lithuanian 2%
- Foreign-born
- 2% · Canada
- Languages at home
- 94% English-only · Spanish 6%
Political lean MEDSL · Hood
- 2024 margin
- Solid R (+66.0) · D 16.6% · R 82.6%
- 2008→2024 swing
- -11.9pp toward R · 2008: -54.0pp · 2024: -66.0pp
- All cycles
- 2024: R+66.0 2020: R+64.1 2016: R+66.5 2012: R+64.7 2008: R+54.0
Not yet ingested
- Civics
- —
Market trends
- HPI YoY
- ▲ 20.20%
- Current HPI
- 347.1688
- Rent YoY
- —
- Metro
- —
- State GDP YoY
- ▲ 3.95%
- F500 in state
- 110
Industry mix (Fortune 500 HQ in TX)
| Industry | F500 HQs | Revenue |
|---|---|---|
| Energy | 16 | $1,198B |
|
||
| Technology | 5 | $198B |
|
||
| Engineering / Construction | 4 | $72B |
|
||
| Energy Services | 3 | $60B |
|
||
| Utilities | 3 | $41B |
|
||
| Healthcare | 2 | $330B |
|
||
Price history
+200.0% since first listed19 events — show timeline
- 2026-06-04 Listed $150,000 ForSaleByOwner.com
- 2021-07-27 Sold (Public Records) — Public Records
- 2021-07-22 Sold (MLS) — NTREIS
- 2021-05-18 Pending — NTREIS
- 2021-05-18 Relisted — NTREIS
- 2021-02-28 Pending — NTREIS
- 2021-02-02 Contingent — NTREIS
- 2020-09-15 Listed $79,990 NTREIS
- 2016-03-14 Sold (Public Records) — Public Records
- 2012-03-28 Sold (Public Records) — Public Records
- 2012-03-28 Sold (MLS) — NTREIS
- 2012-02-24 Pending — NTREIS
- 2011-09-28 Listed $50,000 NTREIS
- 1999-10-11 Sold (Public Records) — Public Records
- 1999-09-27 Sold (Public Records) — Public Records
- 1997-12-29 Sold (Public Records) — Public Records
- 1994-12-02 Sold (Public Records) — Public Records
- 1993-09-03 Sold (Public Records) — Public Records
- 1974-06-01 Sold (Public Records) — Public Records
Property tax history
+4.3%/yrLatest (2025): $1,274 · -1.6% YoY. Source: county tax records.
Cash-flow waterfall
monthlySold comps — $/sqft
last 12 mo · ≤1 miLoading sold comps…