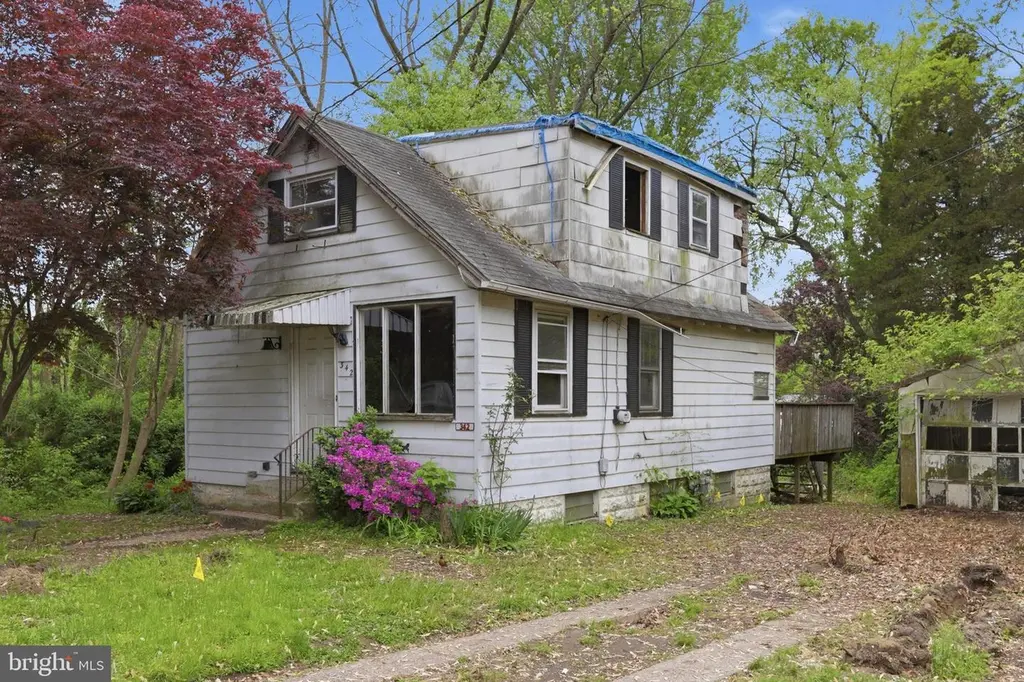
342 Empire Ave · Gloucester, NJ
Flood risk 1/10 · Minimal
- FEMA flood zone
- X (unshaded)
- Chance of flooding over 30 yrs
- 0.0%
- Est. flood insurance / yr
- $507 – $1,088
Fire risk 3/10 · Minor
- Est. fire insurance / yr
- $526 – $976
Heat risk 6/10 · Moderate
- Hot days now (above 103°F)
- 7 days/yr
- Hot days in 30 yrs
- 15 days/yr
Wind risk 6/10 · Moderate
- Chance of severe wind over 30 yrs
- 62.0%
Air-quality risk 4/10 · Minor
- Unhealthy air days now
- 4 days/yr
- Unhealthy air days in 30 yrs
- 6 days/yr
Risk factors via First Street. Map © Google.
Why this score? — see what drove the C+ grade
The composite is a weighted blend of 9 inputs, each scored 0–100. Each bar is that input's sub-score; the figure is the points it added to the 100-point composite (weight × sub-score).
- Cash flow +22.1/30.0
- ARV discount +15.0/15.0
- 1% rule +7.7/10.0
- DSCR +7.1/10.0
- Rent growth +3.5/5.0
- Schools +2.6/10.0
- Livability +2.5/5.0
- Condition / age +2.5/5.0
- Appreciation +0.0/10.0
$185,000
🖨 Deal sheet 📄 Offer letter ✓ Due diligence
Listing remarks
Investor special offering exceptional upside with an ARV of $375,000++ on a rare oversized double lot in a highly desirable location. Tucked away on a quiet dead-end street directly adjacent to Valleybrook Golf Course, this property provides a unique level of privacy while still being close to major conveniences, making it an ideal setting for long-term value and strong resale demand. The home features 3 bedrooms, 2 bathrooms , a large full basement, and a detached garage, and requires a complete renovation, presenting a prime opportunity for investors, builders, or end users looking to create a custom home in a premium location. Properties with this combination of land, privacy, and positi
Key facts
- Premium location
- Complete renovation
- Oversized double lot
Tags
Property features AI
Finance
- Financial info: Ownership: Fee Simple
Exterior
- Parking: Detached garage (1 space); Total of 1 garage/parking space
- Utilities: Public water; Public sewer
- Home design: Detached property
- Construction: Concrete perimeter foundation; Other structures above and below grade
- Exterior features: Lot dimensions approximately 40.51 x 120.00; No tidal water
Interior
- Bedrooms: Two bedrooms on the upper level; One bedroom on the main level
- Bathrooms: One full bathroom on the upper level; One full bathroom on the main level; Two full bathrooms total
- Heating & cooling: Heating: other; Cooling: other; Hot water: other
- Interior features: Basement present (other type)
Neighborhood map
What this means for you Summary
Snapshot
- This is a 3-bed/2.0-bath townhouse listed at $185k.
Deal economics
- At list price, monthly cash flow is $298 ($4k/yr) — positive.
- The deal already cash-flows at list — no discount required.
- Meets the 1% rule at list price ($2k rent vs $185k).
- Recommended offer: $179k (3.0% below list) — sets the bar for market timing.
Location & tenants
- Location reads: area grade C — affects rentability + tenant quality, not the cash-flow math above.
- Gloucester Township Public Schools (suburban): math 14% / reading 41% proficiency, ranked #351 of 472 in NJ (top 74%) — low school quality limits family demand, transient renter base, plan for 1-2y turnover.
- Market conditions: Rents rising fast (+4.2%/yr); 174 active listings in the ZIP; 5 comparable units currently listed for rent nearby; rentals leasing fast (median 1d on market — plan ~1-2 weeks tenant-placement turnaround); solid renter incomes; 1,018 units permitted in Camden County in 2024 (509 in 5+ unit buildings).
Forward outlook
- Local home prices are declining (-3.0%/yr); year-one equity from $1k of loan paydown is wiped out by about $6k of value loss. Plan a longer hold.
- Camden County population projected to shrink 8% by 2050 — rents likely to lag national; underwrite the cash flow, not the appreciation.
Negotiation context
- It's been on market 40 days — a 3% lower offer ($179k) is reasonable based on typical stale-listing flexibility.
Risks & watch-outs
- Watch-outs: property tax is 3.3% of price; built in 1927 — expect roof / HVAC / electrical / plumbing capex.
- Climate carrying-cost: major wind risk, 62% chance of damaging wind over 30y; extreme-heat days projected 7→15/yr by 2055 (HVAC capex compounding) — expect insurance premiums to compound above CPI over the hold.
Questions for the listing agent
- It's been on market 40 days. Have you received any prior offers? Is the seller open to a 3% concession, seller financing, or rate buy-down credit?
- Built in 1927 — when were the roof, HVAC, electrical panel, plumbing, and water heater last replaced?
- Property tax is high relative to price — has the assessment been appealed recently, and will the sale trigger a re-assessment?
- Is there a deadline driving the sale (1031 exchange, divorce, estate, relocation)? That informs how much negotiation room exists.
- What's the average days-on-market for RENTAL listings here right now (not sales)? A rising rental-DOM trend means longer vacancies and softer asking-rent achievability than the comps imply.
- What's the recent tenant-quality profile in this submarket — average credit score on applications, eviction rate, late-payment / NSF rate, and stable-employment percentage? A property-management company in the area should have these aggregated.
- How much new for-sale + rental construction is in the pipeline within 1–3 miles? Heavy new supply typically softens prices + rents 12–24 months out; constrained supply supports both.
Investment metrics
- 1% rule
- 1.27% ✓
- Cap rate
- 8.22%
- Cash-on-cash
- 6.90%
- DSCR
- 1.31
- GRM
- 6.5
CMA / ARV
- ARV (on-the-fly)
- $252,021
- Comps found
- 11
Show comp detail 11 sales within ~0.75 mi
| Address | Dist | Beds/Ba | Sqft | Sold | Price | $/sf | Match |
|---|---|---|---|---|---|---|---|
| 703 Aberdeen Ln | 0.71mi | 2/2.0 (-1) | 1,080 (-1%) | 4mo | $250,000 | $231 | 57 |
| 3101 Aberdeen Ln | 0.61mi | 2/2.0 (-1) | 1,032 (-5%) | 5mo | $280,000 | $271 | 53 |
| 504 Wimbledon Way | 0.68mi | 2/2.0 (-1) | 1,136 (+4%) | 11mo | $250,000 | $220 | 47 |
| 2307 Wimbledon Way | 0.63mi | 2/2.0 (-1) | 1,032 (-5%) | 13mo | $255,000 | $247 | 46 |
| 2403 Wimbledon Way | 0.61mi | 2/2.0 (-1) | 1,200 (+10%) | 9mo | $279,000 | $233 | 42 |
| 404 Wimbledon Way | 0.70mi | 2/1.0 (-1) | 1,200 (+10%) | 4mo | $245,000 | $204 | 39 |
| 2704 Wimbledon Way | 0.57mi | 2/1.0 (-1) | 1,200 (+10%) | 11mo | $257,000 | $214 | 39 |
| 5105 Aberdeen Ln | 0.69mi | 2/1.0 (-1) | 944 (-14%) | 2mo | $205,000 | $217 | 35 |
| 4505 Aberdeen Ln | 0.63mi | 2/1.0 (-1) | 944 (-14%) | 6mo | $222,000 | $235 | 34 |
| 2506 Wimbledon | 0.61mi | 2/2.5 (-1) | 1,228 (+13%) | 15mo | $270,000 | $220 | 31 |
| 401 Wimbledon Way | 0.70mi | 2/1.0 (-1) | 944 (-14%) | 19mo | $247,000 | $262 | 20 |
Match score weights: distance 35% · size 25% · config 20% · recency 20%. Top-matched comps best support the ARV.
Projected returns pro-forma
-3.0% appreciation · 4.16% rent growth · sell at horizon
- IRR
- -4.1%
- Equity multiple
- 0.84×
- Total profit
- $-8,032
- Equity at exit
- $27,584
- IRR
- 7.2%
- Equity multiple
- 1.58×
- Total profit
- $29,946
- Equity at exit
- $15,995
Cash invested: $51,800 (down + closing). Projections, not guarantees.
Landlord ↔ Tenant lean methodology
- Overall (STATE)
- 21 Tenant-Leaning
- State New Jersey
- 21 Tenant-Leaning · D+6
- County
- — inherits STATE
- City
- — inherits STATE
ZIP-level market 08012
- Rents YoY
- 4.2%
- Active inventory
- 174
- Price-to-rent
- 6.5×
Monthly cashflow live
- Estimated rent
- $2,354 high interval (Pro) →
- Mortgage (P&I)
- −$970
- Tax from tax record
- −$515 /mo · $6,180/yr
- Insurance
- −$77
- HOA
- −$0
- Vacancy / Maint / Mgmt
- −$494
- Net cashflow
- $298
Break-even live
UW: 25.0% down · 7.5% · 30yr · 1.5% tax · 5.0% vac · 8.0% maint · 8.0% mgmt
Financing live
Cash to close
- Down payment
- $46,250
- Closing costs
- $5,550
- Reserves months
- —
- Total cash needed
- —
Loan-product check · same deal, 3 products live
Conventional
25% down · 7.5% · 30yr
- Down + closing
- —
- Monthly P&I
- —
- Monthly cashflow
- —
- DSCR
- —
- Eligible?
- —
Personal DTI + credit; lowest rate.
DSCR
20% down · 8.5% · 30yr
- Down + closing
- —
- Monthly P&I
- —
- Monthly cashflow
- —
- DSCR
- —
- Eligible?
- —
No personal income docs; deal must DSCR.
Hard money
10% down · 12.0% · 12mo
- Down + closing
- —
- Monthly P&I
- —
- Monthly cashflow
- —
- DSCR
- —
- Eligible?
- —
Short-term bridge; refi at stabilization.
Rent comps 5 comps
| Address | Beds | Baths | Sqft | Rent | $/sqft | DOM | Units | Dist |
|---|---|---|---|---|---|---|---|---|
| 1501 Old Black Horse Pike Blackwood, NJ | 1.0–2.0 | 1.0–1.5 | 1045 | $2,170 | $2.08 | 1d | 25 | 0.48mi |
| 230 Almonesson Rd Unit A Blackwood, NJ | 2.0 | 1.0 | 900 | $1,900 | $2.11 | 10d | 1 | 0.66mi |
| 100 Blenheim-Erial Rd Blackwood, NJ | 1.0–2.0 | 1.0–2.0 | 1439 | $2,670 | $1.85 | 1d | 1 | 0.66mi |
| 8 Pinehurst Ct Blackwood, NJ | 4.0 | 2.5 | 1332 | $2,800 | $2.10 | 1d | 1 | 0.66mi |
| 590 Lower Landing Rd Blackwood, NJ | 3.0 | 1.0–1.5 | 1030 | $2,500 | $2.43 | 1d | 10 | 0.96mi |
Listing history 8 events
-
2026-06-08days on market $185,000 Active 40 DOM
-
2026-06-07days on market $185,000 Active 39 DOM
-
2026-06-04days on market $185,000 Active 36 DOM
-
2026-06-03days on market $185,000 Active 35 DOM
-
2026-06-02days on market $185,000 Active 34 DOM
-
2026-06-01days on market $185,000 Active 33 DOM
-
2026-05-31days on market $185,000 Active 32 DOM
-
2026-04-29$185,000 Active 900-char remark
ⓘ Source: listings_history table (triggers on properties + properties_extension) + one-shot
backfill from property_details.listing_events for pre-trigger history.
Tax reassessment forecast NJ · Partial reset (capped growth)
- Current annual tax
- $6,180 · $515/mo
- Projected year-2 tax
- $6,180 · $515/mo
- Expected delta
- $0/yr ($0/mo · 0.0%)
ⓘ Screening estimate from a state-policy table — verify with the county assessor before closing.
Climate risk First Street
- Flood 1/10 Low FEMA zone X (unshaded) · 0% chance over 30 yrs
- Wildfire 3/10 Moderate
- Heat 6/10 Major 7 d/yr ≥103°F today · 15 d/yr by 30 yrs out
- Wind 6/10 Major 62% chance of damaging wind over 30 yrs
- Air quality 4/10 Moderate 4 unhealthy d/yr today · 6 by 30 yrs out
Nearby sold comps map
Loading sold comps map…
Walkable amenities ~0.75 mi
Loading nearby amenities…
Taxation est. · year 1
- Rental income
- $28,251
- − Mortgage interest
- −$10,363
- − Property taxes
- −$6,180
- − Insurance
- −$925
- − Repairs & maintenance
- −$2,260
- − Management
- −$2,260
- − Depreciation
- −$5,382
- Taxable income
- $881
- Est. tax owed @ 24.0%
- −$212
- After-tax cash flow
- $3,360/yr
For passive investors: Depreciation is non-cash, so a rental often shows a tax loss while cash-flowing — sheltering income. Rental losses are passive: they offset passive income freely, and up to $25,000/yr can offset ordinary (W-2) income if you actively participate and your MAGI is under $100k (phasing out to $0 by $150k); unused losses carry forward. On sale, claimed depreciation is recaptured at up to 25%, and gains may owe capital-gains tax (a 1031 exchange can defer both). Figures are a year-1 estimate at your 24.0% rate — not tax advice; consult a CPA.
Schools (NCES district)
- District
- Gloucester Township Public Schools
- NCES district ID
- 3406030
- Math proficiency
- 14% ▼ -28.00%
- Reading proficiency
- 41% ▼ -13.00%
- Median HH income
- $72,539
- Composite
- 26.18/100
- National rank
- #7269
- State rank
- #351 of 472 in NJ
Livability — Gloucester
No livability data for this city. (Only ~50 U.S. cities are tracked.)
Census & demographics
- County
- Camden County · 407,624 people
- Metro
- Philadelphia-Camden-Wilmington, PA-NJ-DE-MD
- Population (ZIP)
- 41,812
- Household income
- $95,451
- Rent vs Own
- Severe rent burden
- 1264.0
Population outlook (Camden County) Hauer SSP2
- Today (2025)
- 507,964 people
- By 2030
- 502,182 · -1.1%
- By 2040
- 485,602 · -4.4%
- By 2050
- 465,630 · -8.3%
- By 2075
- 419,986 · -17.3%
- By 2100
- 369,492 · -27.3%
Race, ethnicity, and origin ACS 2023
- Neighborhood character
- Predominantly White (71%)
- Race & ethnicity
- White 71% Black 10% Hispanic / Latino 9% Two or more races 8% Asian 5%
- Hispanic origin (detail)
- Mexican 1% Puerto Rican 4%
- Common ancestry
- Romanian 6% Lithuanian 2% Slovak 2%
- Foreign-born
- 9% · Canada, Jamaica, China
- Languages at home
- 87% English-only · Spanish 5% Other Indo-European 4% Tagalog/Filipino 1%
Political lean MEDSL · Camden
- 2024 margin
- Strong D (+27.4) · D 63.0% · R 35.5% · Other 1.5%
- 2008→2024 swing
- -8.8pp toward R · 2008: 36.2pp · 2024: 27.4pp
- All cycles
- 2024: D+27.4 2020: D+33.5 2016: D+32.4 2012: D+36.6 2008: D+36.2
Not yet ingested
- Civics
- —
Market trends
- HPI YoY
- ▼ -232.79%
- Current HPI
- 315.9676
- Rent YoY
- ▲ 4.16%
- Metro
- Philadelphia-Camden-Wilmington, PA-NJ-DE-MD
- State GDP YoY
- ▲ 2.05%
- F500 in state
- 34
Industry mix (Fortune 500 HQ in NJ)
| Industry | F500 HQs | Revenue |
|---|---|---|
| Consumer Goods | 3 | $31B |
|
||
| Pharmaceuticals | 2 | $153B |
|
||
| Technology | 2 | $21B |
|
||
| Insurance | 2 | $20B |
|
||
| Healthcare | 2 | $19B |
|
||
| Financial Services | 1 | $70B |
|
||
Price history
+0.0% since first listed3 events — show timeline
- 2026-05-27 Sold (MLS) $185,000 BRIGHT MLS
- 2026-05-05 Sold (Public Records) $110,000 Public Records
- 2026-04-29 Listed $185,000 BRIGHT MLS
Property tax history
+3.8%/yrLatest (2025): $6,180 · +2.1% YoY. Source: county tax records.
Cash-flow waterfall
monthlySold comps — $/sqft
last 12 mo · ≤1 miLoading sold comps…