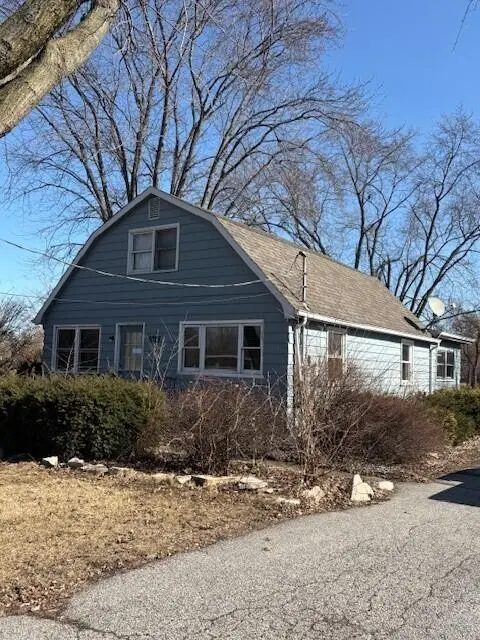
9225 Liable Rd · Highland, IN
Flood risk 5/10 · Moderate
- FEMA flood zone
- X (unshaded)
- Chance of flooding over 30 yrs
- 0.24%
- Est. flood insurance / yr
- $507 – $1,088
Fire risk 1/10 · Minimal
- Est. fire insurance / yr
- $717 – $1,331
Heat risk 3/10 · Minor
- Hot days now (above 103°F)
- 7 days/yr
- Hot days in 30 yrs
- 15 days/yr
Wind risk 2/10 · Minimal
- Chance of severe wind over 30 yrs
- 1.0%
Air-quality risk 3/10 · Minor
- Unhealthy air days now
- 2 days/yr
- Unhealthy air days in 30 yrs
- 3 days/yr
Risk factors via First Street. Map © Google.
Why this score? — see what drove the C grade
The composite is a weighted blend of 9 inputs, each scored 0–100. Each bar is that input's sub-score; the figure is the points it added to the 100-point composite (weight × sub-score).
- Cash flow +18.4/30.0
- ARV discount +15.0/15.0
- DSCR +5.8/10.0
- 1% rule +4.4/10.0
- Livability +3.9/5.0
- Schools +3.7/10.0
- Rent growth +3.4/5.0
- Condition / age +2.5/5.0
- Appreciation +0.0/10.0
$189,900
🖨 Deal sheet 📄 Offer letter ✓ Due diligence
Listing remarks MLS
Though needing a complete rehab, there is unlimited potential and possibilities for this 1,728' Sq. ft. 1.5 story home with a 2.5 car garage. The . 83A Lot sits directly across from Southridge Elementary School and sits adjacent to Sheppard Park.
Key facts
- Complete rehab
- 0.83 acre lot
- 2 garage spots
Tags
Neighborhood map
What this means for you Summary
Snapshot
- This is a 2-bed/1.0-bath single-family listed at $190k.
Deal economics
- At list price, monthly cash flow is $176 ($2k/yr) — positive.
- The deal already cash-flows at list — no discount required.
- To meet the 1% rule (rent ≥ 1% of price), the offer needs to be $178k (6.1% below list).
- Recommended offer: $173k (9.0% below list) — sets the bar for market timing.
- Cap rate 7.4% vs local median 4.1% in Highland — top-decile yield for the area; either an underpriced asset or a hidden risk that comps aren't pricing in. Stress-test before assuming the spread holds.
Location & tenants
- Location reads 77/100 on livability (#37 in IN, #2,959 nationally) — a middle-class / working-renter tenant base. Strengths: cost of living A+, housing A+, crime A; Watch: health & safety D+, amenities F, commute F.
- School Town Of Highland (suburban): math 39% / reading 45% proficiency, ranked #109 of 301 in IN (top 36%) — families likely to look elsewhere, expect single-tenant / working-renter base with shorter leases.
- Market conditions: Rents rising (+3.7%/yr); 102 active listings in the ZIP; 2 comparable units currently listed for rent nearby; solid renter incomes; 1,642 units permitted in Lake County in 2024 (14 in 5+ unit buildings).
Forward outlook
- Local home prices are declining (-3.0%/yr); year-one equity from $1k of loan paydown is wiped out by about $6k of value loss. Plan a longer hold.
- Lake County population projected to shrink 7% by 2050 — rents likely to lag national; underwrite the cash flow, not the appreciation.
Negotiation context
- It's been on market 119 days — a 9% lower offer ($173k) is reasonable based on typical stale-listing flexibility.
Risks & watch-outs
- Watch-outs: built in 1938 — expect roof / HVAC / electrical / plumbing capex.
- Climate carrying-cost: moderate flood risk — expect insurance premiums to compound above CPI over the hold.
Questions for the listing agent
- It's been on market 119 days. Have you received any prior offers? Is the seller open to a 9% concession, seller financing, or rate buy-down credit?
- Built in 1938 — when were the roof, HVAC, electrical panel, plumbing, and water heater last replaced?
- Why hasn't it sold? Are there any deal-killer items the seller is aware of (foundation, flood, title, zoning, code violations)?
- Is there a deadline driving the sale (1031 exchange, divorce, estate, relocation)? That informs how much negotiation room exists.
- Schools are A-rated — typically a magnet for longer-tenancy family renters. What's the average tenant stay here, and is there a school-zone premium baked into asking?
- What's the average days-on-market for RENTAL listings here right now (not sales)? A rising rental-DOM trend means longer vacancies and softer asking-rent achievability than the comps imply.
- What's the recent tenant-quality profile in this submarket — average credit score on applications, eviction rate, late-payment / NSF rate, and stable-employment percentage? A property-management company in the area should have these aggregated.
- How much new for-sale + rental construction is in the pipeline within 1–3 miles? Heavy new supply typically softens prices + rents 12–24 months out; constrained supply supports both.
Investment metrics
- 1% rule
- 0.94% ✗
- Cap rate
- 7.40%
- Cash-on-cash
- 3.97%
- DSCR
- 1.18
- GRM
- 8.9
CMA / ARV
- ARV (median comp)
- $302,938
- List price
- $189,900
- Delta
- -37.31%
- Verdict
- UNDERPRICED
- Comps
- 20 within 1.0 mi
Show comp detail 12 sales within ~0.75 mi
| Address | Dist | Beds/Ba | Sqft | Sold | Price | $/sf | Match |
|---|---|---|---|---|---|---|---|
| 3341 Martha St | 0.31mi | 3/1.5 (+1) | 1,732 (+0%) | 2mo | $245,000 | $141 | 77 |
| 3514 41st Pl | 0.18mi | 3/2.0 (+1) | 1,792 (+4%) | 3mo | $305,000 | $170 | 74 |
| 9618 Boulevard Dr | 0.48mi | 3/1.5 (+1) | 1,729 (+0%) | 4mo | $265,000 | $153 | 67 |
| 9217 Grace St | 0.25mi | 3/2.0 (+1) | 1,584 (-8%) | 1mo | $320,000 | $202 | 65 |
| 8941 Ohio Pl | 0.48mi | 3/1.0 (+1) | 1,584 (-8%) | 2mo | $280,000 | $177 | 57 |
| 9347 O'day Dr | 0.40mi | 3/2.0 (+1) | 1,888 (+9%) | 2mo | $297,500 | $158 | 55 |
| 3737 Jewett Ave | 0.66mi | 3/2.0 (+1) | 1,662 (-4%) | 0mo | $333,500 | $201 | 53 |
| 9047 Pettit Dr | 0.62mi | 3/1.0 (+1) | 1,608 (-7%) | 2mo | $266,019 | $165 | 53 |
| 9503 Forrest Dr | 0.59mi | 3/2.0 (+1) | 1,599 (-8%) | 0mo | $282,000 | $176 | 51 |
| 217 W 40th Pl | 0.64mi | 3/1.0 (+1) | 1,569 (-9%) | 1mo | $267,000 | $170 | 50 |
| 1006 W Ash | 0.69mi | 3/2.0 (+1) | 1,560 (-10%) | 1mo | $312,000 | $200 | 42 |
| 8939 Parrish Ave | 0.61mi | 3/2.0 (+1) | 1,534 (-11%) | 4mo | $300,000 | $196 | 41 |
Match score weights: distance 35% · size 25% · config 20% · recency 20%. Top-matched comps best support the ARV.
Projected returns pro-forma
-3.0% appreciation · 3.68% rent growth · sell at horizon
- IRR
- -9.4%
- Equity multiple
- 0.65×
- Total profit
- $-18,374
- Equity at exit
- $28,315
- IRR
- 0.9%
- Equity multiple
- 1.06×
- Total profit
- $3,435
- Equity at exit
- $16,419
Cash invested: $53,172 (down + closing). Projections, not guarantees.
Landlord ↔ Tenant lean methodology
- Overall (STATE)
- 90 Strongly Landlord-Friendly
- State Indiana
- 90 Strongly Landlord-Friendly · R+11
- County
- — inherits STATE
- City
- — inherits STATE
ZIP-level market 46322
- Rents YoY
- 3.7%
- Active inventory
- 102
- Price-to-rent
- 8.9×
Monthly cashflow live
- Estimated rent
- $1,784 medium interval (Pro) →
- Mortgage (P&I)
- −$996
- Tax from tax record
- −$158 /mo · $1,902/yr
- Insurance
- −$79
- HOA
- −$0
- Vacancy / Maint / Mgmt
- −$375
- Net cashflow
- $176
Break-even live
UW: 25.0% down · 7.5% · 30yr · 1.5% tax · 5.0% vac · 8.0% maint · 8.0% mgmt
Financing live
Cash to close
- Down payment
- $47,475
- Closing costs
- $5,697
- Reserves months
- —
- Total cash needed
- —
Loan-product check · same deal, 3 products live
Conventional
25% down · 7.5% · 30yr
- Down + closing
- —
- Monthly P&I
- —
- Monthly cashflow
- —
- DSCR
- —
- Eligible?
- —
Personal DTI + credit; lowest rate.
DSCR
20% down · 8.5% · 30yr
- Down + closing
- —
- Monthly P&I
- —
- Monthly cashflow
- —
- DSCR
- —
- Eligible?
- —
No personal income docs; deal must DSCR.
Hard money
10% down · 12.0% · 12mo
- Down + closing
- —
- Monthly P&I
- —
- Monthly cashflow
- —
- DSCR
- —
- Eligible?
- —
Short-term bridge; refi at stabilization.
Rent comps 2 comps
| Address | Beds | Baths | Sqft | Rent | $/sqft | DOM | Units | Dist |
|---|---|---|---|---|---|---|---|---|
| 1800 W Park Blvd Griffith, IN | 3.0 | 2.0 | 1288 | $2,221 | $1.72 | 1d | 1 | 1.43mi |
| 1818 Park West Blvd Griffith, IN | 1.0–3.0 | 1.0–2.5 | 1230 | $1,714 | $1.39 | 1d | 78 | 1.44mi |
Listing history 14 events
-
2026-06-18days on market $189,900 Active 119 DOM
-
2026-06-17days on market $189,900 Active 118 DOM
-
2026-06-16days on market $189,900 Active 117 DOM
-
2026-06-15days on market $189,900 Active 116 DOM
-
2026-06-13days on market $189,900 Active 114 DOM
-
2026-06-09days on market $189,900 Active 110 DOM
-
2026-06-08days on market $189,900 Active 109 DOM
-
2026-06-07days on market $189,900 Active 108 DOM
-
2026-06-04days on market $189,900 Active 105 DOM
-
2026-06-03days on market $189,900 Active 104 DOM
-
2026-06-02days on market $189,900 Active 103 DOM
-
2026-06-01days on market $189,900 Active 102 DOM
-
2026-05-31days on market $189,900 Active 101 DOM
-
2026-02-19$189,900 Active 246-char remark
Show marketing remark (246 chars)
Though needing a complete rehab, there is unlimited potential and possibilities for this 1,728' Sq. ft. 1.5 story home with a 2.5 car garage. The . 83A Lot sits directly across from Southridge Elementary School and sits adjacent to Sheppard Park.
ⓘ Source: listings_history table (triggers on properties + properties_extension) + one-shot
backfill from property_details.listing_events for pre-trigger history.
Tax reassessment forecast IN · Partial reset (capped growth)
- Current annual tax
- $1,902 · $158/mo
- Projected year-2 tax
- $1,902 · $158/mo
- Expected delta
- $0/yr ($0/mo · 0.0%)
ⓘ Screening estimate from a state-policy table — verify with the county assessor before closing.
Climate risk First Street
- Flood 5/10 Major FEMA zone X (unshaded) · 24% chance over 30 yrs
- Wildfire 1/10 Low
- Heat 3/10 Moderate 7 d/yr ≥103°F today · 15 d/yr by 30 yrs out
- Wind 2/10 Low 100% chance of damaging wind over 30 yrs
- Air quality 3/10 Moderate 2 unhealthy d/yr today · 3 by 30 yrs out
Nearby sold comps map
Loading sold comps map…
Walkable amenities ~0.75 mi
Loading nearby amenities…
Taxation est. · year 1
- Rental income
- $21,405
- − Mortgage interest
- −$10,637
- − Property taxes
- −$1,902
- − Insurance
- −$950
- − Repairs & maintenance
- −$1,712
- − Management
- −$1,712
- − Depreciation
- −$5,524
- Taxable loss
- −$1,033
- Est. tax savings @ 24.0%
- +$248
- After-tax cash flow
- $2,356/yr
For passive investors: Depreciation is non-cash, so a rental often shows a tax loss while cash-flowing — sheltering income. Rental losses are passive: they offset passive income freely, and up to $25,000/yr can offset ordinary (W-2) income if you actively participate and your MAGI is under $100k (phasing out to $0 by $150k); unused losses carry forward. On sale, claimed depreciation is recaptured at up to 25%, and gains may owe capital-gains tax (a 1031 exchange can defer both). Figures are a year-1 estimate at your 24.0% rate — not tax advice; consult a CPA.
Schools (NCES district)
- District
- School Town Of Highland
- NCES district ID
- 1804560
- Math proficiency
- 39% ▼ -9.00%
- Reading proficiency
- 45% ▼ -6.00%
- Median HH income
- $60,641
- Composite
- 37.15/100
- National rank
- #4485
- State rank
- #109 of 301 in IN
Livability — Highland
- Score
- 77/100
- State rank
- #37
- US rank
- #2959
Category grades
Schools grade is shown separately in the Schools card above.
Census & demographics
- Census place
- Highland, IN
- County
- Lake County · 422,878 people
- City population
- 23,680
- Metro
- Chicago-Naperville-Elgin, IL-IN-WI
- Population (ZIP)
- 23,680
- Household income
- $78,062
- Rent vs Own
- Severe rent burden
- 538.0
Population outlook (Lake County) Hauer SSP2
- Today (2025)
- 484,026 people
- By 2030
- 478,091 · -1.2%
- By 2040
- 462,974 · -4.3%
- By 2050
- 449,894 · -7.1%
- By 2075
- 436,169 · -9.9%
- By 2100
- 426,607 · -11.9%
Race, ethnicity, and origin ACS 2023
- Neighborhood character
- Predominantly White (67%)
- Race & ethnicity
- White 67% Hispanic / Latino 18% Black 9% Two or more races 9% Asian 2%
- Hispanic origin (detail)
- Mexican 13% Puerto Rican 3%
- Common ancestry
- Romanian 15% Iranian 6% Lithuanian 2%
- Foreign-born
- 7% · Canada
- Languages at home
- 87% English-only · Spanish 8% Russian/Polish/Slavic 2% Other Indo-European 1%
Political lean MEDSL · Lake
- 2024 margin
- Lean D (+5.6) · D 52.1% · R 46.5% · Other 1.5%
- 2008→2024 swing
- -28.6pp toward R · 2008: 34.3pp · 2024: 5.6pp
- All cycles
- 2024: D+5.6 2020: D+15.1 2016: D+20.6 2012: D+31.0 2008: D+34.3
Not yet ingested
- Civics
- —
Market trends
- HPI YoY
- ▼ -230.63%
- Current HPI
- 254.1772
- Rent YoY
- ▲ 3.68%
- Metro
- Chicago-Naperville-Elgin, IL-IN-WI
- State GDP YoY
- ▲ 2.90%
- F500 in state
- 18
Industry mix (Fortune 500 HQ in IN)
| Industry | F500 HQs | Revenue |
|---|---|---|
| Industrial Machinery | 2 | $37B |
|
||
| Healthcare | 1 | $177B |
|
||
| Pharmaceuticals | 1 | $45B |
|
||
| Metals / Steel | 1 | $18B |
|
||
| Agriculture | 1 | $17B |
|
||
| Packaging | 1 | $12B |
|
||
Price history
1 event — show timeline
- 2026-02-19 Listed $189,900 NIRA MLS as Distributed by MLS Grid
Property tax history
+6.0%/yrLatest (2024): $1,902 · +2.0% YoY. Source: county tax records.
Cash-flow waterfall
monthlySold comps — $/sqft
last 12 mo · ≤1 miLoading sold comps…