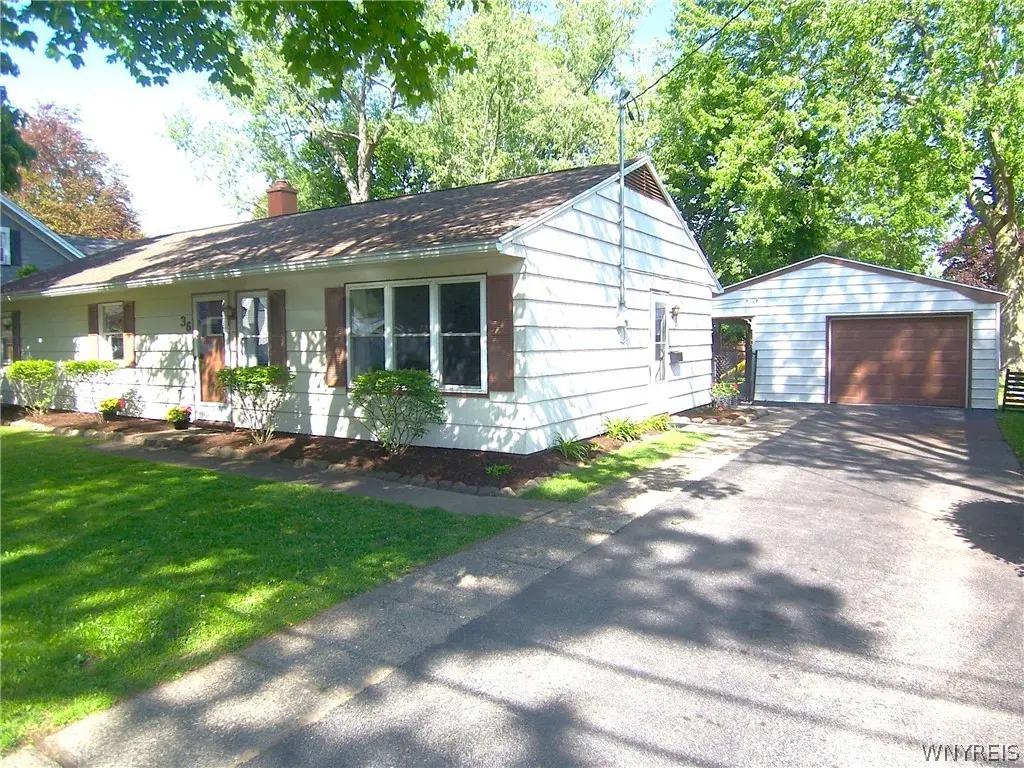
36 Elm St · Batavia, NY
Flood risk 1/10 · Minimal
- FEMA flood zone
- X
- Chance of flooding over 30 yrs
- 0.0%
- Est. flood insurance / yr
- $507 – $1,088
Fire risk 3/10 · Minor
- Est. fire insurance / yr
- $691 – $1,283
Heat risk 2/10 · Minimal
- Hot days now (above 95°F)
- 7 days/yr
- Hot days in 30 yrs
- 16 days/yr
Wind risk 1/10 · Minimal
- Chance of severe wind over 30 yrs
- —
Air-quality risk 2/10 · Minimal
- Unhealthy air days now
- 1 days/yr
- Unhealthy air days in 30 yrs
- 2 days/yr
Risk factors via First Street. Map © Google.
Why this score? — see what drove the D- grade
The composite is a weighted blend of 9 inputs, each scored 0–100. Each bar is that input's sub-score; the figure is the points it added to the 100-point composite (weight × sub-score).
- Cash flow +14.8/30.0
- DSCR +4.5/10.0
- ARV discount +4.0/15.0
- Schools +3.7/10.0
- 1% rule +3.4/10.0
- Livability +3.4/5.0
- Rent growth +2.5/5.0
- Condition / age +2.5/5.0
- Appreciation +0.0/10.0
$170,000
🖨 Deal sheet (PDF) 📄 Offer letter ✓ Due diligence
Listing remarks MLS
COZY 3 BEDROOM RANCH HOME WITH 1.5 BATHS. VERY WELL MAINTAINED- FRESHLY PAINTED INTERIOR AND NEWER RUGS. NICE SIZE KITCHEN AND FORMAL DINING ROOM. ALL APPLIANCES ARE INCLUDED. NEW ROOF IN 2008 & FURNACE(2011)GREAT YARD AND COVERED PATIO NEXT TO DETACHED 1.5 CAR GARAGE. CALL TODAY FOR AN APPOINTMENT.
Key facts
- Formal dining room
- Step saver kitchen
- Breakfast bar
Tags
Property features AI
Exterior
- Parking: Detached garage with electricity and garage door opener; 1.5 garage spaces
- Utilities: Cable available; Electricity connected (circuit breakers); Public water connected; Sewer connected
- Home design: Single-story home; Existing structure
- Construction: Aluminum siding and cedar exterior; Copper plumbing; Asphalt architectural shingle roof; Poured foundation and slab
- Exterior features: Blacktop driveway; Partial fence; Patio; Covered patio/porch; Porch; Private yard; See remarks
Interior
- Kitchen: Built-in refrigerator; Electric oven; Electric range; Range hood; Exhaust fan
- Bedrooms: Three bedrooms on the main level
- Flooring: Carpet; Laminate; Varies
- Bathrooms: One full bathroom; One half bathroom; Two bathrooms on the main level
- Heating & cooling: Gas forced-air heating
- Interior features: Ceiling fan(s); Separate/formal dining room; Separate/formal living room; Window treatments; Drapes; Thermal windows; Bedroom on main level
- Laundry & utility: Washer; Dryer; Main-level laundry
Neighborhood map
What this means for you Summary
Snapshot
- This is a 3-bed/1.5-bath single-family listed at $170k.
Deal economics
- At list price, monthly cash flow is $46 ($553/yr) — positive.
- The deal already cash-flows at list — no discount required.
- To meet the 1% rule (rent ≥ 1% of price), the offer needs to be $144k (15.5% below list).
- Recommended offer: $144k (15.5% below list) — sets the bar for 1% rule.
- Cap rate 6.6% vs local median 5.5% in Batavia — meaningfully above typical; check what's discounted (condition, days-on-market, listing class) to confirm the premium yield is real.
Location & tenants
- Location reads 68/100 on livability (#536 in NY) — a middle-class / working-renter tenant base. Strengths: cost of living A+, housing A+, health & safety A; Watch: employment C-, crime D+, amenities F.
- Batavia City School District (town): math 38% / reading 50% proficiency, ranked #477 of 590 in NY (top 81%) — families likely to look elsewhere, expect single-tenant / working-renter base with shorter leases.
- Zoned schools: John Kennedy School (math 35% / reading 50%, grade F, #1,356 of 2,108 statewide, top 64%, 481 students, 56% FRL); Batavia Middle School (math 23% / reading 50%, grade F, #464 of 729 statewide, top 64%, 595 students, 54% FRL); Batavia High School (math 87% / reading 75%, grade A, #485 of 1,100 statewide, top 45%, 645 students, 45% FRL) — zoned schools at 52% FRL track the district average.
- Market conditions: 91 active listings in the ZIP; 5 comparable units currently listed for rent nearby; rentals leasing fast (median 4d on market — plan ~1-2 weeks tenant-placement turnaround); 55 units permitted in Genesee County in 2024 (0 in 5+ unit buildings).
Forward outlook
- Local home prices are declining (-3.0%/yr); year-one equity from $1k of loan paydown is wiped out by about $5k of value loss. Plan a longer hold.
- Genesee County population projected at -22% by 2050 — secular population decline; favor cash flow + early exit over multi-decade hold.
Negotiation context
- Only 9 days on market — expect competitive offers; lowballing is unlikely to land.
- 2 sale attempts since 14y ago with the ask held roughly flat each time — persistent listings suggest the price (not the market) is what's stuck; bring a comps-based counter.
- Current owner paid $76k; list at $170k implies a 124% gain — meaningful room to come down on a strong offer.
Risks & watch-outs
- Watch-outs: built in 1954 — expect roof / HVAC / electrical / plumbing capex.
Questions for the listing agent
- Built in 1954 — when were the roof, HVAC, electrical panel, plumbing, and water heater last replaced?
- Is there a deadline driving the sale (1031 exchange, divorce, estate, relocation)? That informs how much negotiation room exists.
- Schools are B-rated — typically a magnet for longer-tenancy family renters. What's the average tenant stay here, and is there a school-zone premium baked into asking?
- Crime grade is D in this area — have there been break-ins, vandalism, or insurance claims at this property in the last 3 years? What carrier currently insures it and at what premium?
- The area grade is low — what's the realistic commute time and amenity access for the typical tenant pool here? Any planned neighborhood developments (good or bad) we should know about?
- What's the average days-on-market for RENTAL listings here right now (not sales)? A rising rental-DOM trend means longer vacancies and softer asking-rent achievability than the comps imply.
- What's the recent tenant-quality profile in this submarket — average credit score on applications, eviction rate, late-payment / NSF rate, and stable-employment percentage? A property-management company in the area should have these aggregated.
- How much new for-sale + rental construction is in the pipeline within 1–3 miles? Heavy new supply typically softens prices + rents 12–24 months out; constrained supply supports both.
Investment metrics
- 1% rule
- 0.84% ✗
- Cap rate
- 6.62%
- Cash-on-cash
- 1.16%
- DSCR
- 1.05
- GRM
- 9.9
CMA / ARV
- ARV (on-the-fly)
- $157,824
- Comps found
- 12
Show comp detail 12 sales within ~0.75 mi
| Address | Dist | Beds/Ba | Sqft | Sold | Price | $/sf | Match |
|---|---|---|---|---|---|---|---|
| 34 Trumbull Pkwy | 0.08mi | 3/1.0 | 1,248 (+8%) | 10mo | $236,500 | $190 | 73 |
| 55 Columbia Ave | 0.31mi | 3/1.0 | 1,120 (-3%) | 11mo | $85,000 | $76 | 70 |
| 109 Vine St | 0.19mi | 3/1.5 | 1,248 (+8%) | 14mo | $192,000 | $154 | 66 |
| 208 Ross St | 0.43mi | 3/1.5 | 1,234 (+7%) | 4mo | $160,000 | $130 | 65 |
| 108 East Ave | 0.09mi | 3/1.0 | 1,308 (+14%) | 11mo | $179,400 | $137 | 62 |
| 138 Summit St | 0.42mi | 4/1.5 (+1) | 1,248 (+8%) | 5mo | $185,000 | $148 | 57 |
| 175 Summit St | 0.51mi | 3/1.0 | 1,078 (-6%) | 10mo | $165,000 | $153 | 56 |
| 15 Goade Park | 0.67mi | 3/2.0 | 1,136 (-1%) | 12mo | $120,000 | $106 | 54 |
| 282 Ross St | 0.67mi | 3/1.5 | 1,076 (-7%) | 6mo | $195,000 | $181 | 53 |
| 4 Ellicott Pl | 0.62mi | 4/1.0 (+1) | 1,158 (+0%) | 14mo | $95,000 | $82 | 51 |
| 23 Tracy Ave | 0.50mi | 3/1.5 | 1,288 (+12%) | 13mo | $150,000 | $116 | 46 |
| 114 North St | 0.53mi | 4/2.0 (+1) | 1,248 (+8%) | 10mo | $44,000 | $35 | 46 |
Match score weights: distance 35% · size 25% · config 20% · recency 20%. Top-matched comps best support the ARV.
Projected returns pro-forma
-3.0% appreciation · 3.0% rent growth · sell at horizon
- IRR
- -14.5%
- Equity multiple
- 0.48×
- Total profit
- $-24,642
- Equity at exit
- $25,348
- IRR
- -5.8%
- Equity multiple
- 0.63×
- Total profit
- $-17,805
- Equity at exit
- $14,698
Cash invested: $47,600 (down + closing). Projections, not guarantees.
Landlord ↔ Tenant lean methodology
- Overall (STATE)
- 15 Strongly Tenant-Friendly
- State New York
- 15 Strongly Tenant-Friendly · D+10
- County
- — inherits STATE
- City
- — inherits STATE
ZIP-level market 14020
- Home prices YoY
- -10.4%
- Active inventory
- 91
- Price-to-rent
- 9.9×
Monthly cashflow live
- Estimated rent
- $1,436 high interval (Pro) →
- Mortgage (P&I)
- −$891
- Tax from tax record
- −$126 /mo · $1,513/yr
- Insurance
- −$71
- HOA
- −$0
- Vacancy / Maint / Mgmt
- −$302
- Net cashflow
- $46
Break-even live
Sensitivity live
| Price | -10% $142 | -5% $94 | +0% $46 | +5% $-2 | +10% $-50 |
|---|---|---|---|---|---|
| Rent | -10% $-67 | -5% $-11 | +0% $46 | +5% $103 | +10% $160 |
| Rate | -1.0pp $132 | -0.5pp $89 | base $46 | +0.5pp $2 | +1.0pp $-43 |
UW: 25.0% down · 7.5% · 30yr · 1.5% tax · 5.0% vac · 8.0% maint · 8.0% mgmt
Financing live
Cash to close
- Down payment
- $42,500
- Closing costs
- $5,100
- Reserves months
- —
- Total cash needed
- —
Loan-product check · same deal, 3 products live
Conventional
25% down · 7.5% · 30yr
- Down + closing
- —
- Monthly P&I
- —
- Monthly cashflow
- —
- DSCR
- —
- Eligible?
- —
Personal DTI + credit; lowest rate.
DSCR
20% down · 8.5% · 30yr
- Down + closing
- —
- Monthly P&I
- —
- Monthly cashflow
- —
- DSCR
- —
- Eligible?
- —
No personal income docs; deal must DSCR.
Hard money
10% down · 12.0% · 12mo
- Down + closing
- —
- Monthly P&I
- —
- Monthly cashflow
- —
- DSCR
- —
- Eligible?
- —
Short-term bridge; refi at stabilization.
Rent comps 5 comps
| Address | Beds | Baths | Sqft | Rent | $/sqft | DOM | Units | Dist |
|---|---|---|---|---|---|---|---|---|
| 10 Woodstock Gdns Unit 10 Batavia, NY | 2.0 | 1.0 | 1007 | $1,230 | $1.22 | 3d | 1 | 0.44mi |
| 115 Woodstock Gdns Unit 115 Batavia, NY | 2.0 | 1.0 | 1007 | $1,230 | $1.22 | 12d | 1 | 0.47mi |
| 219 N Spruce St Batavia, NY | 2.0 | 1.0 | 1007 | $1,230 | $1.22 | 45d | 1 | 0.51mi |
| 105 Main St Unit 2 Batavia, NY | 2.0 | 2.0 | 950 | $2,100 | $2.21 | 3d | 1 | 0.61mi |
| 224 State St Batavia, NY | 2.0 | 1.0 | 1000 | $1,150 | $1.15 | 3d | 1 | 0.78mi |
Listing history 5 events
-
2026-05-20$170,000 Active
-
2012-06-14soldstatus $75,900 306-char remark
Show marketing remark (306 chars)
COZY 3 BEDROOM RANCH HOME WITH 1.5 BATHS. VERY WELL MAINTAINED- FRESHLY PAINTED INTERIOR AND NEWER RUGS. NICE SIZE KITCHEN AND FORMAL DINING ROOM. ALL APPLIANCES ARE INCLUDED. NEW ROOF IN 2008 & FURNACE(2011)GREAT YARD AND COVERED PATIO NEXT TO DETACHED 1.5 CAR GARAGE. CALL TODAY FOR AN APPOINTMENT.
-
2012-06-14soldstatus $75,000
Show marketing remark (306 chars)
COZY 3 BEDROOM RANCH HOME WITH 1.5 BATHS. VERY WELL MAINTAINED- FRESHLY PAINTED INTERIOR AND NEWER RUGS. NICE SIZE KITCHEN AND FORMAL DINING ROOM. ALL APPLIANCES ARE INCLUDED. NEW ROOF IN 2008 & FURNACE(2011)GREAT YARD AND COVERED PATIO NEXT TO DETACHED 1.5 CAR GARAGE. CALL TODAY FOR AN APPOINTMENT.
-
2012-03-29$79,900 306-char remark
Show marketing remark (306 chars)
COZY 3 BEDROOM RANCH HOME WITH 1.5 BATHS. VERY WELL MAINTAINED- FRESHLY PAINTED INTERIOR AND NEWER RUGS. NICE SIZE KITCHEN AND FORMAL DINING ROOM. ALL APPLIANCES ARE INCLUDED. NEW ROOF IN 2008 & FURNACE(2011)GREAT YARD AND COVERED PATIO NEXT TO DETACHED 1.5 CAR GARAGE. CALL TODAY FOR AN APPOINTMENT.
-
2005-03-21soldstatus $67,000
ⓘ Source: listings_history table (triggers on properties + properties_extension) + one-shot
backfill from property_details.listing_events for pre-trigger history.
Tax reassessment forecast NY · Partial reset (capped growth)
- Current annual tax
- $1,513 · $126/mo
- Projected year-2 tax
- $2,193 · $183/mo
- Expected delta
- +$680/yr (+$57/mo · 44.9%)
ⓘ Screening estimate from a state-policy table — verify with the county assessor before closing.
Climate risk First Street
- Flood 1/10 Low FEMA zone X · 0% chance over 30 yrs
- Wildfire 3/10 Moderate
- Heat 2/10 Low 7 d/yr ≥95°F today · 16 d/yr by 30 yrs out
- Wind 1/10 Low
- Air quality 2/10 Low 1 unhealthy d/yr today · 2 by 30 yrs out
Nearby sold comps map
Loading sold comps map…
Walkable amenities ~0.75 mi
Loading nearby amenities…
Taxation est. · year 1
- Rental income
- $17,233
- − Mortgage interest
- −$9,523
- − Property taxes
- −$1,513
- − Insurance
- −$850
- − Repairs & maintenance
- −$1,379
- − Management
- −$1,379
- − Depreciation
- −$4,945
- Taxable loss
- −$2,355
- Est. tax savings @ 24.0%
- +$565
- After-tax cash flow
- $1,118/yr
For passive investors: Depreciation is non-cash, so a rental often shows a tax loss while cash-flowing — sheltering income. Rental losses are passive: they offset passive income freely, and up to $25,000/yr can offset ordinary (W-2) income if you actively participate and your MAGI is under $100k (phasing out to $0 by $150k); unused losses carry forward. On sale, claimed depreciation is recaptured at up to 25%, and gains may owe capital-gains tax (a 1031 exchange can defer both). Figures are a year-1 estimate at your 24.0% rate — not tax advice; consult a CPA.
Schools (NCES district)
- District
- Batavia City School District
- NCES district ID
- 3603990
- Math proficiency
- 38% ▼ -13.00%
- Reading proficiency
- 50% ▲ 4.00%
- Median HH income
- $43,288
- Composite
- 37.13/100
- National rank
- #4490
- State rank
- #477 of 590 in NY
Livability — Batavia
- Score
- 68/100
- State rank
- #536
- US rank
- #9660
Category grades
Schools grade is shown separately in the Schools card above.
Census & demographics
- Census place
- Batavia, NY
- County
- Genesee County · 22,002 people
- City population
- 22,002
- Metro
- Batavia, NY
- Population (ZIP)
- 22,002
- Household income
- $62,655
- Rent vs Own
- Severe rent burden
- 817.0
Population outlook (Genesee County) Hauer SSP2
- Today (2025)
- 56,113 people
- By 2030
- 54,140 · -3.5%
- By 2040
- 49,368 · -12.0%
- By 2050
- 43,911 · -21.7%
- By 2075
- 32,511 · -42.1%
- By 2100
- 21,695 · -61.3%
Race, ethnicity, and origin ACS 2023
- Neighborhood character
- Predominantly White (87%)
- Race & ethnicity
- White 87% Two or more races 6% Hispanic / Latino 4% Black 3% Asian 1%
- Common ancestry
- Romanian 11% Lithuanian 2% Slovak 2%
- Foreign-born
- 4% · Canada, China
- Languages at home
- 95% English-only · Spanish 3% Chinese 1%
Political lean MEDSL · Genesee
- 2024 margin
- Solid R (+34.0) · D 33.0% · R 67.0%
- 2008→2024 swing
- -15.6pp toward R · 2008: -18.4pp · 2024: -34.0pp
- All cycles
- 2024: R+34.0 2020: R+31.7 2016: R+37.0 2012: R+20.9 2008: R+18.4
Not yet ingested
- Civics
- —
Market trends
- HPI YoY
- ▼ -30.58%
- Current HPI
- 263.2147
- Rent YoY
- —
- Metro
- Batavia, NY
- State GDP YoY
- ▲ 2.60%
- F500 in state
- 92
Industry mix (Fortune 500 HQ in NY)
| Industry | F500 HQs | Revenue |
|---|---|---|
| Financial Services | 10 | $950B |
|
||
| Consumer Goods | 9 | $162B |
|
||
| Insurance | 4 | $225B |
|
||
| Telecommunications | 2 | $144B |
|
||
| Pharmaceuticals | 2 | $112B |
|
||
| Media / Entertainment | 2 | $69B |
|
||
Price history
+153.7% since first listed5 events — show timeline
- 2026-05-20 Listed $170,000 WNYREIS
- 2012-06-14 Sold (Public Records) $75,000 Public Records
- 2012-06-14 Sold (MLS) $75,900 UNYREIS
- 2012-03-29 Listed $79,900 UNYREIS
- 2005-03-21 Sold (Public Records) $67,000 Public Records
Property tax history
-4.7%/yrLatest (2025): $1,513 · -45.6% YoY. Source: county tax records.
Cash-flow waterfall
monthlySold comps — $/sqft
last 12 mo · ≤1 miLoading sold comps…