607 Temple Dr · Gulfport, MS
Flood risk 4/10 · Minor
- FEMA flood zone
- X (unshaded)
- Chance of flooding over 30 yrs
- 0.22%
- Est. flood insurance / yr
- $507 – $1,088
Fire risk 2/10 · Minimal
- Est. fire insurance / yr
- $1,241 – $2,305
Heat risk 10/10 · Severe
- Hot days now (above 107°F)
- 7 days/yr
- Hot days in 30 yrs
- 23 days/yr
Wind risk 9/10 · Severe
- Chance of severe wind over 30 yrs
- 99.0%
Air-quality risk 1/10 · Minimal
- Unhealthy air days now
- 0 days/yr
- Unhealthy air days in 30 yrs
- 0 days/yr
Risk factors via First Street. Map © Google.
Why this score? — see what drove the B+ grade
The composite is a weighted blend of 9 inputs, each scored 0–100. Each bar is that input's sub-score; the figure is the points it added to the 100-point composite (weight × sub-score).
- Cash flow +30.0/30.0
- ARV discount +15.0/15.0
- 1% rule +10.0/10.0
- DSCR +10.0/10.0
- Rent growth +4.2/5.0
- Schools +4.2/10.0
- Livability +3.7/5.0
- Condition / age +2.5/5.0
- Appreciation +0.0/10.0
$95,000
🖨 Deal sheet 📄 Offer letter ✓ Due diligence
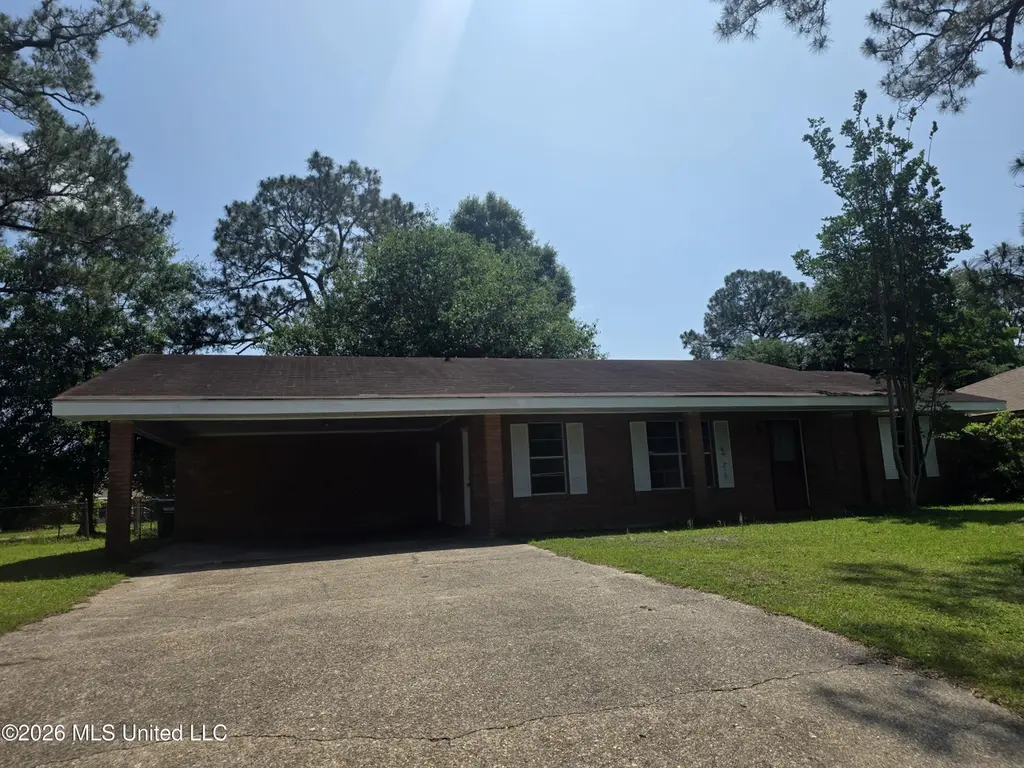
Listing remarks
Spacious home on a corner lot with newer stainless kitchen appliances. Double carport with a long concrete driveway can fit 6 cars. Lovely trees in the back yard provide privacy and shade. Not much is needed to finish the fencing. Inside the house just needs a fresh coat of paint, flooring and new light fixtures to get ready for new owners or to use as a rental. A great buy, don't wait too long or your miss out on this diamond in the rough.
Key facts
- Back yard
- Fencing
- Double carport
Tags
Property features AI
Finance
- HOA & community: Near entertainment; Street lights in the neighborhood
Exterior
- Parking: Attached carport; Covered carport; Driveway parking; Concrete surfaces; 2 carport spaces (6 parking spaces total)
- Security: Smoke detectors; Carbon monoxide detectors
- Utilities: Public water; Public sewer; Electricity connected; Natural gas connected; Cable available; Sewer connected; Water connected
- Home design: Single-family house; One level
- Construction: Brick veneer exterior; Slab foundation; Asphalt shingle roof (three-tab)
- Exterior features: Front porch; Patio; Partial backyard fence; Back yard fencing; City lot on a corner; Few trees in yard; Front yard
Interior
- Kitchen: Dishwasher (ENERGY STAR qualified); Refrigerator (ENERGY STAR qualified, free-standing); Free-standing electric range; Range hood
- Bedrooms: Primary bedroom; Bedroom 2; Bedroom 3
- Flooring: Carpet; Combination flooring; Vinyl
- Bathrooms: 2 full bathrooms (including a primary bathroom and a hall bathroom)
- Heating & cooling: Central heating (natural gas); Central air conditioning (electric)
- Interior features: Breakfast bar; Laminate counters; Aluminum-framed windows; Deadbolt locks; Sliding doors; Storm doors; See remarks for additional exterior/interior details
- Laundry & utility: Laundry room with washer and electric dryer hookups; Washer hookup inside
Neighborhood map
What this means for you Summary
Snapshot
- This is a 3-bed/1.0-bath single-family listed at $95k.
Deal economics
- At list price, monthly cash flow is $534 ($6k/yr) — positive.
- The deal already cash-flows at list — no discount required.
- Meets the 1% rule at list price ($1k rent vs $95k).
- Cap rate 13.0% vs local median 4.9% in Gulfport — top-decile yield for the area; either an underpriced asset or a hidden risk that comps aren't pricing in. Stress-test before assuming the spread holds.
Location & tenants
- Location reads 73/100 on livability (#15 in MS) — a middle-class / working-renter tenant base. Strengths: cost of living A+, housing A+, health & safety A+; Watch: schools D, amenities F, commute F.
- Harrison County School District (rural): math 52% / reading 46% proficiency, ranked #14 of 130 in MS (top 11%) — families likely to look elsewhere, expect single-tenant / working-renter base with shorter leases; 62% free/reduced lunch — lower-income household profile, screen leases tightly.
- Market conditions: Rents rising fast (+7.0%/yr); 763 active listings in the ZIP; 13 comparable units currently listed for rent nearby; rentals lingering (median 44d on market — plan ~5-8 weeks vacancy on turnover, expect pricing pressure); 62% of comp listings sitting > 30 days — soft ceiling on asking rent; 2,194 units permitted in Harrison County in 2024 (0 in 5+ unit buildings).
Forward outlook
- Local home prices are declining (-3.0%/yr); year-one equity from $657 of loan paydown is wiped out by about $3k of value loss. Plan a longer hold.
- Harrison County population projected at +27% by 2050 — long-run rental-demand tailwind backs the buy-and-hold thesis.
- At projected returns (-3.0% appreciation + 7.0% rent growth), your $27k cash investment doubles in ~5 years — after that, you're playing with house money.
Negotiation context
- Only 5 days on market — expect competitive offers; lowballing is unlikely to land.
Risks & watch-outs
- Climate carrying-cost: severe wind risk, 99% chance of damaging wind over 30y; extreme-heat days projected 7→23/yr by 2055 (HVAC capex compounding) — expect insurance premiums to compound above CPI over the hold.
Questions for the listing agent
- Is there a deadline driving the sale (1031 exchange, divorce, estate, relocation)? That informs how much negotiation room exists.
- Schools are D-rated, which usually means shorter tenancies and higher turnover. Who's the typical renter profile here, and what's been the actual vacancy rate?
- What's the average days-on-market for RENTAL listings here right now (not sales)? A rising rental-DOM trend means longer vacancies and softer asking-rent achievability than the comps imply.
- What's the recent tenant-quality profile in this submarket — average credit score on applications, eviction rate, late-payment / NSF rate, and stable-employment percentage? A property-management company in the area should have these aggregated.
- How much new for-sale + rental construction is in the pipeline within 1–3 miles? Heavy new supply typically softens prices + rents 12–24 months out; constrained supply supports both.
Investment metrics
- 1% rule
- 1.55% ✓
- Cap rate
- 13.04%
- Cash-on-cash
- 24.10%
- DSCR
- 2.07
- GRM
- 5.4
CMA / ARV
- ARV (median comp)
- $151,921
- List price
- $95,000
- Delta
- -37.47%
- Verdict
- UNDERPRICED
- Comps
- 20 within 1.0 mi
Show comp detail 12 sales within ~0.75 mi
| Address | Dist | Beds/Ba | Sqft | Sold | Price | $/sf | Match |
|---|---|---|---|---|---|---|---|
| 607 Temple Dr | 0.00mi | 3/2.0 | 1,450 (+0%) | 1mo | $95,000 | $66 | 95 |
| 502 Ramsey Ave | 0.32mi | 3/1.5 | 1,456 (+0%) | 14mo | $172,000 | $118 | 71 |
| 2513 Knox St | 0.38mi | 3/2.0 | 1,501 (+4%) | 2mo | $174,900 | $117 | 71 |
| 10604 E Bay Tree Dr | 0.12mi | 3/2.0 | 1,254 (-14%) | 7mo | $169,995 | $136 | 62 |
| 2607 W Stevens Cir | 0.63mi | 3/1.5 | 1,429 (-1%) | 6mo | $139,000 | $97 | 61 |
| 10766 E Bay Tree Dr | 0.21mi | 3/2.0 | 1,255 (-13%) | 8mo | $145,000 | $116 | 58 |
| 2412 Knox St | 0.30mi | 3/1.5 | 1,300 (-10%) | 13mo | $160,000 | $123 | 56 |
| 925 Sweetgum Dr | 0.74mi | 3/1.5 | 1,375 (-5%) | 3mo | $105,000 | $76 | 53 |
| 12343 Dedeaux Rd | 0.74mi | 2/1.0 (-1) | 1,459 (+1%) | 8mo | $139,900 | $96 | 53 |
| 2627 W Angela Cir | 0.69mi | 3/1.5 | 1,278 (-12%) | 2mo | $124,900 | $98 | 44 |
| 13359 Chris Dr | 0.57mi | 3/2.5 | 1,300 (-10%) | 9mo | $125,000 | $96 | 43 |
| 2410 E Birch Dr | 0.55mi | 3/2.0 | 1,665 (+15%) | 6mo | $199,000 | $120 | 40 |
Match score weights: distance 35% · size 25% · config 20% · recency 20%. Top-matched comps best support the ARV.
Projected returns pro-forma
-3.0% appreciation · 6.99% rent growth · sell at horizon
- IRR
- 21.7%
- Equity multiple
- 1.93×
- Total profit
- $24,803
- Equity at exit
- $14,165
- IRR
- 32.3%
- Equity multiple
- 4.49×
- Total profit
- $92,912
- Equity at exit
- $8,214
Cash invested: $26,600 (down + closing). Projections, not guarantees.
Landlord ↔ Tenant lean methodology
- Overall (STATE)
- 90 Strongly Landlord-Friendly
- State Mississippi
- 90 Strongly Landlord-Friendly · R+11
- County
- — inherits STATE
- City
- — inherits STATE
ZIP-level market 39503
- Home prices YoY
- -21.5%
- Rents YoY
- 7.0%
- Active inventory
- 763
- Price-to-rent
- 5.4×
Monthly cashflow live
- Estimated rent
- $1,477 high interval (Pro) →
- Mortgage (P&I)
- −$498
- Tax from tax record
- −$95 /mo · $1,135/yr
- Insurance
- −$40
- HOA
- −$0
- Vacancy / Maint / Mgmt
- −$310
- Net cashflow
- $534
Break-even live
UW: 25.0% down · 7.5% · 30yr · 1.5% tax · 5.0% vac · 8.0% maint · 8.0% mgmt
Financing live
Cash to close
- Down payment
- $23,750
- Closing costs
- $2,850
- Reserves months
- —
- Total cash needed
- —
Loan-product check · same deal, 3 products live
Conventional
25% down · 7.5% · 30yr
- Down + closing
- —
- Monthly P&I
- —
- Monthly cashflow
- —
- DSCR
- —
- Eligible?
- —
Personal DTI + credit; lowest rate.
DSCR
20% down · 8.5% · 30yr
- Down + closing
- —
- Monthly P&I
- —
- Monthly cashflow
- —
- DSCR
- —
- Eligible?
- —
No personal income docs; deal must DSCR.
Hard money
10% down · 12.0% · 12mo
- Down + closing
- —
- Monthly P&I
- —
- Monthly cashflow
- —
- DSCR
- —
- Eligible?
- —
Short-term bridge; refi at stabilization.
Rent comps 13 comps
| Address | Beds | Baths | Sqft | Rent | $/sqft | DOM | Units | Dist |
|---|---|---|---|---|---|---|---|---|
| 10596 E Bay Tree Dr Gulfport, MS | 2.0 | 2.0 | 1047 | $1,200 | $1.15 | 43d | 1 | 0.15mi |
| 13181 Warren Dr Gulfport, MS | 3.0 | 2.0 | 1188 | $1,375 | $1.16 | 43d | 1 | 0.20mi |
| 10669 E Bay Tree Dr Gulfport, MS | 3.0 | 2.0 | 1200 | $1,425 | $1.19 | 21d | 1 | 0.21mi |
| 13242 Warren Dr Gulfport, MS | 2.0 | 2.0 | 1012 | $1,100 | $1.09 | 43d | 1 | 0.30mi |
| 11310 Fairfield Ln Gulfport, MS | 3.0 | 2.0 | 1084 | $1,625 | $1.50 | 43d | 1 | 0.83mi |
| 12271 Dedeaux Rd Gulfport, MS | 3.0 | 1.5 | 1462 | $1,350 | $0.92 | 43d | 1 | 0.86mi |
| 12062 Jessica Cir Gulfport, MS | 3.0 | 2.0 | 1385 | $1,700 | $1.23 | 13d | 1 | 0.94mi |
| 11312 Jessica Dr Gulfport, MS | 3.0 | 2.0 | 1092 | $1,625 | $1.49 | 21d | 1 | 1.01mi |
| 11200 Three Rivers Rd Gulfport, MS | 3.0 | 2.0 | 1124 | $1,445 | $1.29 | 13d | 1 | 1.24mi |
| 11200 Three Rivers Rd Gulfport, MS | 2.0 | 2.0 | 1042 | $1,147 | $1.10 | 43d | 1 | 1.24mi |
| 12147 Prudie Cir Gulfport, MS | 3.0 | 2.0 | 1100 | $975 | $0.89 | 43d | 1 | 1.26mi |
| 12040 Highland Ave Gulfport, MS | 3.0 | 2.0 | 1019 | $950 | $0.93 | 13d | 1 | 1.29mi |
| 1009 Michelle Dr Gulfport, MS | 4.0 | 2.0 | 1254 | $1,650 | $1.32 | 43d | 1 | 1.45mi |
Listing history 2 events
-
2026-05-04status Pending 444-char remark
-
2026-04-29$95,000 Active 444-char remark
ⓘ Source: listings_history table (triggers on properties + properties_extension) + one-shot
backfill from property_details.listing_events for pre-trigger history.
Tax reassessment forecast MS · Resets to sale price
- Current annual tax
- $1,135 · $95/mo
- Projected year-2 tax
- $1,135 · $95/mo
- Expected delta
- $0/yr ($0/mo · 0.0%)
ⓘ Screening estimate from a state-policy table — verify with the county assessor before closing.
Climate risk First Street
- Flood 4/10 Moderate FEMA zone X (unshaded) · 22% chance over 30 yrs
- Wildfire 2/10 Low
- Heat 10/10 Extreme 7 d/yr ≥107°F today · 23 d/yr by 30 yrs out
- Wind 9/10 Extreme 99% chance of damaging wind over 30 yrs
- Air quality 1/10 Low 0 unhealthy d/yr today · 0 by 30 yrs out
Nearby sold comps map
Loading sold comps map…
Walkable amenities ~0.75 mi
Loading nearby amenities…
Taxation est. · year 1
- Rental income
- $17,720
- − Mortgage interest
- −$5,321
- − Property taxes
- −$1,135
- − Insurance
- −$475
- − Repairs & maintenance
- −$1,418
- − Management
- −$1,418
- − Depreciation
- −$2,764
- Taxable income
- $5,190
- Est. tax owed @ 24.0%
- −$1,246
- After-tax cash flow
- $5,165/yr
For passive investors: Depreciation is non-cash, so a rental often shows a tax loss while cash-flowing — sheltering income. Rental losses are passive: they offset passive income freely, and up to $25,000/yr can offset ordinary (W-2) income if you actively participate and your MAGI is under $100k (phasing out to $0 by $150k); unused losses carry forward. On sale, claimed depreciation is recaptured at up to 25%, and gains may owe capital-gains tax (a 1031 exchange can defer both). Figures are a year-1 estimate at your 24.0% rate — not tax advice; consult a CPA.
Schools (NCES district)
- District
- Harrison County School District
- NCES district ID
- 2801770
- Math proficiency
- 52% ▼ -4.00%
- Reading proficiency
- 46% ▼ -4.00%
- Median HH income
- $46,504
- Composite
- 41.66/100
- National rank
- #3419
- State rank
- #14 of 130 in MS
Livability — Gulfport
- Score
- 73/100
- State rank
- #15
- US rank
- #5010
Category grades
Schools grade is shown separately in the Schools card above.
Census & demographics
- Census place
- Gulfport, MS
- County
- Harrison County · 178,171 people
- City population
- 96,188
- Metro
- Gulfport-Biloxi, MS
- Population (ZIP)
- 55,059
- Household income
- $62,641
- Rent vs Own
- Severe rent burden
- 1686.0
Population outlook (Harrison County) Hauer SSP2
- Today (2025)
- 228,444 people
- By 2030
- 241,942 · +5.9%
- By 2040
- 267,531 · +17.1%
- By 2050
- 291,062 · +27.4%
- By 2075
- 346,711 · +51.8%
- By 2100
- 378,165 · +65.5%
Race, ethnicity, and origin ACS 2023
- Neighborhood character
- Diverse neighborhood (Simpson 0.58)
- Race & ethnicity
- White 58% Black 27% Two or more races 9% Hispanic / Latino 6% Asian 2%
- Hispanic origin (detail)
- Mexican 2% Puerto Rican 1%
- Common ancestry
- Lithuanian 5% Slovak 1% Portuguese 1%
- Foreign-born
- 3% · Canada
- Languages at home
- 95% English-only · Spanish 3%
Political lean MEDSL · Harrison
- 2024 margin
- Strong R (+28.9) · D 35.0% · R 63.9% · Other 1.1%
- 2008→2024 swing
- -2.9pp toward R · 2008: -26.0pp · 2024: -28.9pp
- All cycles
- 2024: R+28.9 2020: R+25.2 2016: R+30.7 2012: R+26.6 2008: R+26.0
Not yet ingested
- Civics
- —
Market trends
- HPI YoY
- ▼ -51.39%
- Current HPI
- 187.285
- Rent YoY
- ▲ 6.99%
- Metro
- Gulfport-Biloxi, MS
- State GDP YoY
- —
- F500 in state
- 0
Price history
4 events — show timeline
- 2026-05-27 Sold (Public Records) — Public Records
- 2026-05-27 Sold (MLS) — MLSU
- 2026-05-04 Pending — MLSU
- 2026-04-29 Listed $95,000 MLSU
Property tax history
-1.9%/yrLatest (2025): $1,135 · +4.1% YoY. Source: county tax records.
Cash-flow waterfall
monthlySold comps — $/sqft
last 12 mo · ≤1 miLoading sold comps…