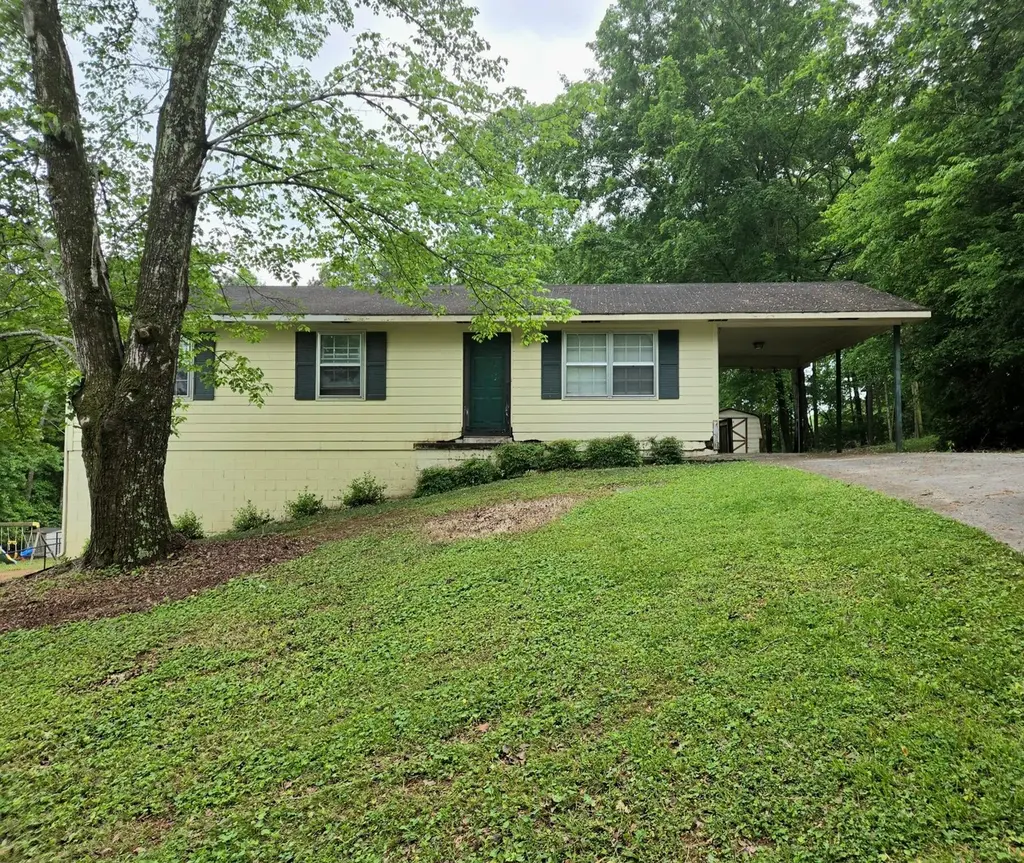
1333 Fernwood Dr · LaFayette, GA
Flood risk 1/10 · Minimal
- FEMA flood zone
- X (unshaded)
- Chance of flooding over 30 yrs
- 0.0%
- Est. flood insurance / yr
- $473 – $860
Fire risk 5/10 · Moderate
- Est. fire insurance / yr
- $963 – $1,789
Heat risk 5/10 · Moderate
- Hot days now (above 104°F)
- 7 days/yr
- Hot days in 30 yrs
- 19 days/yr
Wind risk 4/10 · Minor
- Chance of severe wind over 30 yrs
- 11.0%
Air-quality risk 3/10 · Minor
- Unhealthy air days now
- 2 days/yr
- Unhealthy air days in 30 yrs
- 2 days/yr
Risk factors via First Street. Map © Google.
Why this score? — see what drove the C grade
The composite is a weighted blend of 9 inputs, each scored 0–100. Each bar is that input's sub-score; the figure is the points it added to the 100-point composite (weight × sub-score).
- Cash flow +20.2/30.0
- ARV discount +15.0/15.0
- DSCR +6.4/10.0
- 1% rule +4.6/10.0
- Livability +3.1/5.0
- Rent growth +2.5/5.0
- Condition / age +2.5/5.0
- Schools +2.3/10.0
- Appreciation +0.0/10.0
$155,000
🖨 Deal sheet 📄 Offer letter ✓ Due diligence
Listing remarks
Charming investor special -- 3 bed, 1.5 bath home on a generous, private lot. Solid bones with great potential: living room, eat-in kitchen, and flexible floorplan ready for modernization with an unfinished basement. Large backyard offers room for expansion, landscaping, or outdoor entertaining -- perfect for adding value or building an accessory unit (subject to permits). Attached carport and off-street parking. Needs some TLC and cosmetic updates, ideal for investors or owner-occupiers looking to renovate for resale or long-term rental income. Priced to reflect condition -- bring your vision and tools. Schedule a showing today.
Key facts
- Private lot
- Attached carport
- Unfinished basement
Tags
Property features AI
Finance
- Other: Property condition noted as fixer
- HOA & community: No community features listed
Exterior
- Parking: Has carport (1 space); Driveway
- Utilities: Public water; Public sewer; Electricity available
- Home design: Single-family residence (house); One level
- Construction: Frame construction; Block foundation; Asphalt shingle roof; Built as a house (residential)
- Exterior features: No specific exterior features listed; Gentle sloping lot; Paved road frontage on a private road
Interior
- Kitchen: No appliances listed
- Bedrooms: Total of 7 rooms (bedrooms included within total room count)
- Flooring: Carpet
- Bathrooms: 1 full bathroom; 1 half bathroom
- Heating & cooling: Electric cooling (has cooling)
- Interior features: Carpet flooring; Unfinished basement
Neighborhood map
What this means for you Summary
Snapshot
- This is a 3-bed/1.5-bath single-family listed at $155k.
Deal economics
- At list price, monthly cash flow is $195 ($2k/yr) — positive.
- The deal already cash-flows at list — no discount required.
- To meet the 1% rule (rent ≥ 1% of price), the offer needs to be $149k (4.0% below list).
- Recommended offer: $149k (4.0% below list) — sets the bar for 1% rule.
- Cap rate 7.8% vs local median 4.1% in LaFayette — top-decile yield for the area; either an underpriced asset or a hidden risk that comps aren't pricing in. Stress-test before assuming the spread holds.
Location & tenants
- Location reads 61/100 on livability (#345 in GA) — a middle-class / working-renter tenant base. Strengths: cost of living A+, housing A; Watch: crime D+, amenities F, commute F.
- Walker County (rural): math 25% / reading 29% proficiency, ranked #114 of 174 in GA (top 66%) — low school quality limits family demand, transient renter base, plan for 1-2y turnover; 61% free/reduced lunch — lower-income household profile, screen leases tightly.
- Zoned schools: North Lafayette Elementary School (math 22% / reading 17%, grade F, #878 of 1,228 statewide, top 75%, 432 students, 68% FRL); Lafayette Middle School (math 23% / reading 27%, grade F, #291 of 470 statewide, top 64%, 575 students, 77% FRL); Lafayette High School (math 5% / reading 15%, grade F, #353 of 424 statewide, top 86%, 1,164 students, 62% FRL).
- Market conditions: 218 active listings in the ZIP; 347 units permitted in Walker County in 2024 (24 in 5+ unit buildings).
- This rent runs 32% of the median local income ($55k/yr) — at the standard rent-burdened threshold; future hikes will face affordability resistance.
Forward outlook
- Local home prices are declining (-3.0%/yr); year-one equity from $1k of loan paydown is wiped out by about $5k of value loss. Plan a longer hold.
- Walker County population projected at -16% by 2050 — secular population decline; favor cash flow + early exit over multi-decade hold.
Negotiation context
- It's been on market 34 days — a 3% lower offer ($150k) is reasonable based on typical stale-listing flexibility.
Risks & watch-outs
- Climate carrying-cost: moderate wildfire risk; extreme-heat days projected 7→19/yr by 2055 (HVAC capex compounding) — expect insurance premiums to compound above CPI over the hold.
Questions for the listing agent
- It's been on market 34 days. Have you received any prior offers? Is the seller open to a 4% concession, seller financing, or rate buy-down credit?
- Built in 1978 — when were the roof, HVAC, electrical panel, plumbing, and water heater last replaced?
- Is there a deadline driving the sale (1031 exchange, divorce, estate, relocation)? That informs how much negotiation room exists.
- Schools are F-rated, which usually means shorter tenancies and higher turnover. Who's the typical renter profile here, and what's been the actual vacancy rate?
- Crime grade is D in this area — have there been break-ins, vandalism, or insurance claims at this property in the last 3 years? What carrier currently insures it and at what premium?
- What's the average days-on-market for RENTAL listings here right now (not sales)? A rising rental-DOM trend means longer vacancies and softer asking-rent achievability than the comps imply.
- What's the recent tenant-quality profile in this submarket — average credit score on applications, eviction rate, late-payment / NSF rate, and stable-employment percentage? A property-management company in the area should have these aggregated.
- How much new for-sale + rental construction is in the pipeline within 1–3 miles? Heavy new supply typically softens prices + rents 12–24 months out; constrained supply supports both.
Investment metrics
- 1% rule
- 0.96% ✗
- Cap rate
- 7.80%
- Cash-on-cash
- 5.39%
- DSCR
- 1.24
- GRM
- 8.7
CMA / ARV
- ARV (median comp)
- $199,603
- List price
- $155,000
- Delta
- -22.35%
- Verdict
- UNDERPRICED
- Comps
- 20 within 1.0 mi
Show comp detail 12 sales within ~0.75 mi
| Address | Dist | Beds/Ba | Sqft | Sold | Price | $/sf | Match |
|---|---|---|---|---|---|---|---|
| 1309 Campbell Cres | 0.09mi | 3/1.0 | 1,275 (-12%) | 1mo | $85,000 | $67 | 74 |
| 1118 Probasco St N | 0.38mi | 3/2.0 | 1,490 (+4%) | 3mo | $220,000 | $148 | 72 |
| 1303 Campbell Cres | 0.11mi | 3/2.0 | 1,275 (-12%) | 4mo | $250,000 | $196 | 71 |
| 1306 Fernwood Dr | 0.18mi | 3/2.0 | 1,275 (-12%) | 0mo | $165,500 | $130 | 70 |
| 1112 Probasco St | 0.43mi | 3/2.0 | 1,409 (-2%) | 7mo | $269,000 | $191 | 69 |
| 308 Ridgecrest Dr | 0.42mi | 3/2.0 | 1,408 (-2%) | 13mo | $257,900 | $183 | 64 |
| 302 Ridgecrest Dr | 0.46mi | 3/2.0 | 1,368 (-5%) | 6mo | $162,500 | $119 | 63 |
| 408 Ridgecrest Drive Dr | 0.34mi | 3/2.0 | 1,319 (-8%) | 10mo | $224,900 | $171 | 60 |
| 307 Ridgecrest Dr | 0.43mi | 3/2.0 | 1,229 (-15%) | 2mo | $225,000 | $183 | 52 |
| 203 Darvin Ln | 0.52mi | 3/2.0 | 1,251 (-13%) | 2mo | $235,900 | $189 | 50 |
| 105 Darvin Ln | 0.52mi | 3/1.5 | 1,300 (-10%) | 13mo | $235,000 | $181 | 49 |
| 1490 N Main St | 0.61mi | 3/3.0 | 1,652 (+15%) | 8mo | $369,000 | $223 | 34 |
Match score weights: distance 35% · size 25% · config 20% · recency 20%. Top-matched comps best support the ARV.
Projected returns pro-forma
-3.0% appreciation · 3.0% rent growth · sell at horizon
- IRR
- -8.0%
- Equity multiple
- 0.71×
- Total profit
- $-12,733
- Equity at exit
- $23,111
- IRR
- 1.6%
- Equity multiple
- 1.11×
- Total profit
- $4,768
- Equity at exit
- $13,402
Cash invested: $43,400 (down + closing). Projections, not guarantees.
Landlord ↔ Tenant lean methodology
- Overall (STATE)
- 90 Strongly Landlord-Friendly
- State Georgia
- 90 Strongly Landlord-Friendly · R+3
- County
- — inherits STATE
- City
- — inherits STATE
ZIP-level market 30728
- Home prices YoY
- -14.2%
- Active inventory
- 218
- Price-to-rent
- 8.7×
Monthly cashflow live
- Estimated rent
- $1,489 medium interval (Pro) →
- Mortgage (P&I)
- −$813
- Tax from tax record
- −$104 /mo · $1,243/yr
- Insurance
- −$65
- HOA
- −$0
- Vacancy / Maint / Mgmt
- −$313
- Net cashflow
- $195
Break-even live
UW: 25.0% down · 7.5% · 30yr · 1.5% tax · 5.0% vac · 8.0% maint · 8.0% mgmt
Financing live
Cash to close
- Down payment
- $38,750
- Closing costs
- $4,650
- Reserves months
- —
- Total cash needed
- —
Loan-product check · same deal, 3 products live
Conventional
25% down · 7.5% · 30yr
- Down + closing
- —
- Monthly P&I
- —
- Monthly cashflow
- —
- DSCR
- —
- Eligible?
- —
Personal DTI + credit; lowest rate.
DSCR
20% down · 8.5% · 30yr
- Down + closing
- —
- Monthly P&I
- —
- Monthly cashflow
- —
- DSCR
- —
- Eligible?
- —
No personal income docs; deal must DSCR.
Hard money
10% down · 12.0% · 12mo
- Down + closing
- —
- Monthly P&I
- —
- Monthly cashflow
- —
- DSCR
- —
- Eligible?
- —
Short-term bridge; refi at stabilization.
Listing history 6 events
-
2026-06-02status $155,000 Pending 34 DOM
-
2026-06-01days on market $155,000 Active 34 DOM
-
2026-05-31days on market $155,000 Active 33 DOM
-
2026-05-30days on market $155,000 Active 32 DOM
-
2026-05-13price $157,500 637-char remark
-
2026-04-28$160,000 Active 637-char remark
ⓘ Source: listings_history table (triggers on properties + properties_extension) + one-shot
backfill from property_details.listing_events for pre-trigger history.
Tax reassessment forecast GA · Resets to sale price
- Current annual tax
- $1,243 · $104/mo
- Projected year-2 tax
- $1,426 · $119/mo
- Expected delta
- +$183/yr (+$15/mo · 14.7%)
ⓘ Screening estimate from a state-policy table — verify with the county assessor before closing.
Climate risk First Street
- Flood 1/10 Low FEMA zone X (unshaded) · 0% chance over 30 yrs
- Wildfire 5/10 Major
- Heat 5/10 Major 7 d/yr ≥104°F today · 19 d/yr by 30 yrs out
- Wind 4/10 Moderate 11% chance of damaging wind over 30 yrs
- Air quality 3/10 Moderate 2 unhealthy d/yr today · 2 by 30 yrs out
Nearby sold comps map
Loading sold comps map…
Walkable amenities ~0.75 mi
Loading nearby amenities…
Taxation est. · year 1
- Rental income
- $17,863
- − Mortgage interest
- −$8,682
- − Property taxes
- −$1,243
- − Insurance
- −$775
- − Repairs & maintenance
- −$1,429
- − Management
- −$1,429
- − Depreciation
- −$4,509
- Taxable loss
- −$205
- Est. tax savings @ 24.0%
- +$49
- After-tax cash flow
- $2,389/yr
For passive investors: Depreciation is non-cash, so a rental often shows a tax loss while cash-flowing — sheltering income. Rental losses are passive: they offset passive income freely, and up to $25,000/yr can offset ordinary (W-2) income if you actively participate and your MAGI is under $100k (phasing out to $0 by $150k); unused losses carry forward. On sale, claimed depreciation is recaptured at up to 25%, and gains may owe capital-gains tax (a 1031 exchange can defer both). Figures are a year-1 estimate at your 24.0% rate — not tax advice; consult a CPA.
Schools (NCES district)
- District
- Walker County
- NCES district ID
- 1305370
- Math proficiency
- 25% ▼ -10.00%
- Reading proficiency
- 29% ▼ -10.00%
- Median HH income
- $39,889
- Composite
- 22.74/100
- National rank
- #8035
- State rank
- #114 of 174 in GA
Livability — LaFayette
- Score
- 61/100
- State rank
- #345
- US rank
- #17893
Category grades
Schools grade is shown separately in the Schools card above.
Census & demographics
- Census place
- LaFayette, GA
- County
- Walker County · 48,831 people
- City population
- 18,790
- Metro
- Chattanooga, TN-GA
- Population (ZIP)
- 18,790
- Household income
- $55,455
- Rent vs Own
- Severe rent burden
- 233.0
Population outlook (Walker County) Hauer SSP2
- Today (2025)
- 66,050 people
- By 2030
- 64,305 · -2.6%
- By 2040
- 60,127 · -9.0%
- By 2050
- 55,551 · -15.9%
- By 2075
- 44,886 · -32.0%
- By 2100
- 34,015 · -48.5%
Race, ethnicity, and origin ACS 2023
- Neighborhood character
- Predominantly White (90%)
- Race & ethnicity
- White 90% Two or more races 5% Black 3% Hispanic / Latino 2% Asian 1%
- Common ancestry
- Slovak 3% Lithuanian 2% Iranian 2%
- Foreign-born
- 2% · South Korea
- Languages at home
- 97% English-only · Spanish 2% Korean 1%
Political lean MEDSL · Walker
- 2024 margin
- Solid R (+59.3) · D 20.1% · R 79.4%
- 2008→2024 swing
- -12.5pp toward R · 2008: -46.8pp · 2024: -59.3pp
- All cycles
- 2024: R+59.3 2020: R+59.3 2016: R+61.5 2012: R+50.2 2008: R+46.8
Not yet ingested
- Civics
- —
Market trends
- HPI YoY
- ▼ -45.02%
- Current HPI
- 271.2944
- Rent YoY
- —
- Metro
- Chattanooga, TN-GA
- State GDP YoY
- ▲ 2.66%
- F500 in state
- 28
Industry mix (Fortune 500 HQ in GA)
| Industry | F500 HQs | Revenue |
|---|---|---|
| Paper / Packaging | 2 | $29B |
|
||
| Retail | 1 | $160B |
|
||
| Transportation / Logistics | 1 | $91B |
|
||
| Airlines | 1 | $62B |
|
||
| Consumer Goods | 1 | $47B |
|
||
| Utilities | 1 | $25B |
|
||
Price history
-3.1% since first listed4 events — show timeline
- 2026-06-01 Pending — GCAR
- 2026-05-27 Price Changed $155,000 GCAR
- 2026-05-13 Price Changed $157,500 GCAR
- 2026-04-28 Listed $160,000 GCAR
Property tax history
+4.0%/yrLatest (2025): $1,243 · -4.3% YoY. Source: county tax records.
Cash-flow waterfall
monthlySold comps — $/sqft
last 12 mo · ≤1 miLoading sold comps…