 🏗️ New Construction
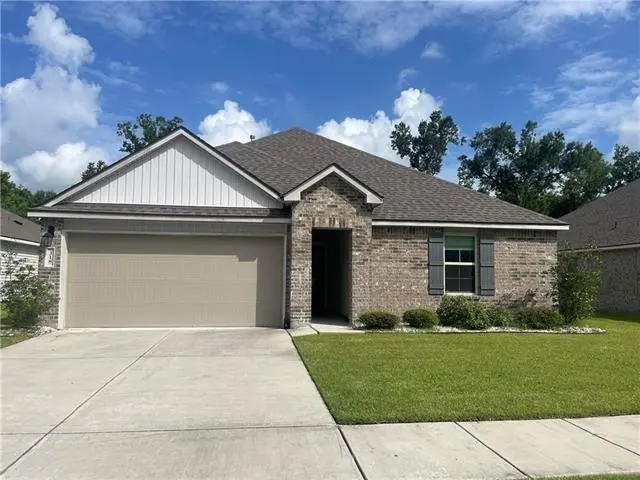
318 Pretty Acres Ave · Hahnville, LA
Flood risk No data
- FEMA flood zone
- —
- Chance of flooding over 30 yrs
- —
- Est. flood insurance / yr
- —
Fire risk No data
- Est. fire insurance / yr
- —
Heat risk No data
- Hot days now (above threshold)
- —
- Hot days in 30 yrs
- —
Wind risk No data
- Chance of severe wind over 30 yrs
- —
Air-quality risk No data
- Unhealthy air days now
- —
- Unhealthy air days in 30 yrs
- —
Risk factors via First Street. Map © Google.
Why this score? — see what drove the F grade
The composite is a weighted blend of 9 inputs, each scored 0–100. Each bar is that input's sub-score; the figure is the points it added to the 100-point composite (weight × sub-score).
- ARV discount +7.5/15.0
- Cash flow +7.4/30.0
- Schools +4.0/10.0
- Livability +3.0/5.0
- Rent growth +2.5/5.0
- Condition / age +2.5/5.0
- 1% rule +2.1/10.0
- DSCR +1.5/10.0
- Appreciation +0.0/10.0
$2,000
🖨 Deal sheet 📄 Offer letter ✓ Due diligence
Listing remarks MLS
New Construction for rent in Pretty Acres Subdivision. Three bedroom two full baths. Property will be ready to rent February 1, 2026. Section 8 welcomed.
Key facts
- 8,712 sq ft lot
- Built 2023
- Listed 197 days
Neighborhood map
What this means for you Summary
Snapshot
- This is a 3-bed/2.0-bath single-family listed at $2k.
Deal economics
- At list price, monthly cash flow is $-402 ($-5k/yr) — negative.
- The deal already cash-flows at list — no discount required.
- Meets the 1% rule at list price ($2k rent vs $2k).
- Recommended offer: $2k (12.0% below list) — sets the bar for market timing.
Location & tenants
- Location reads 60/100 on livability (#258 in LA) — a middle-class / working-renter tenant base. Strengths: cost of living A+, crime A, housing B+; Watch: schools F, amenities F, commute F.
- St. Charles Parish (suburban): math 40% / reading 51% proficiency, ranked #14 of 98 in LA (top 14%) — families likely to look elsewhere, expect single-tenant / working-renter base with shorter leases.
- Market conditions: 52 active listings in the ZIP; 2 comparable units currently listed for rent nearby; 74 units permitted in St. Charles Parish in 2024 (0 in 5+ unit buildings).
Forward outlook
- Local home prices are declining (-3.0%/yr); year-one equity from $2k of loan paydown is wiped out by about $9k of value loss. Plan a longer hold.
- St. Charles County population projected to shrink 7% by 2050 — rents likely to lag national; underwrite the cash flow, not the appreciation.
Negotiation context
- It's been on market 197 days — a 12% lower offer ($2k) is reasonable based on typical stale-listing flexibility.
Risks & watch-outs
- Watch-outs: property tax is 234.0% of price.
Questions for the listing agent
- What do current leases actually rent for vs. the listed asking? Can we see a recent rent roll and the last 12 months of T-12 income?
- It's been on market 197 days. Have you received any prior offers? Is the seller open to a 12% concession, seller financing, or rate buy-down credit?
- Property tax is high relative to price — has the assessment been appealed recently, and will the sale trigger a re-assessment?
- Why hasn't it sold? Are there any deal-killer items the seller is aware of (foundation, flood, title, zoning, code violations)?
- Is there a deadline driving the sale (1031 exchange, divorce, estate, relocation)? That informs how much negotiation room exists.
- Schools are F-rated, which usually means shorter tenancies and higher turnover. Who's the typical renter profile here, and what's been the actual vacancy rate?
- The area grade is low — what's the realistic commute time and amenity access for the typical tenant pool here? Any planned neighborhood developments (good or bad) we should know about?
- What's the average days-on-market for RENTAL listings here right now (not sales)? A rising rental-DOM trend means longer vacancies and softer asking-rent achievability than the comps imply.
- What's the recent tenant-quality profile in this submarket — average credit score on applications, eviction rate, late-payment / NSF rate, and stable-employment percentage? A property-management company in the area should have these aggregated.
- How much new for-sale + rental construction is in the pipeline within 1–3 miles? Heavy new supply typically softens prices + rents 12–24 months out; constrained supply supports both.
Investment metrics
- 1% rule
- 0.71% ✗
- Cap rate
- 4.75%
- Cash-on-cash
- -5.52%
- DSCR
- 0.75
- GRM
- 11.7
CMA / ARV
- ARV (median comp)
- $312,006
- List price
- $2,000
- Delta
- -99.36%
- Verdict
- UNDERPRICED
- Comps
- 20 within 1.0 mi
Show comp detail 7 sales within ~0.75 mi
| Address | Dist | Beds/Ba | Sqft | Sold | Price | $/sf | Match |
|---|---|---|---|---|---|---|---|
| 312 Pretty Acres Ave | 0.01mi | 3/2.0 | 1,616 (+12%) | 11mo | $285,000 | $176 | 71 |
| 156 Pretty Acres Ave | 0.31mi | 3/2.0 | 1,450 (+0%) | 18mo | $260,000 | $179 | 70 |
| 246 Pretty Acres Ave | 0.14mi | 3/2.0 | 1,623 (+12%) | 7mo | $285,000 | $176 | 67 |
| 134 Gourgues St | 0.53mi | 3/2.0 | 1,521 (+5%) | 2mo | $261,000 | $172 | 65 |
| 58 River Park Dr | 0.17mi | 3/2.0 | 1,265 (-13%) | 10mo | $215,000 | $170 | 63 |
| 13 River Park Dr | 0.35mi | 4/2.5 (+1) | 1,500 (+4%) | 20mo | $197,000 | $131 | 54 |
| 147 Shaw St | 0.75mi | 3/2.0 | 1,636 (+13%) | 23mo | $325,000 | $199 | 24 |
Match score weights: distance 35% · size 25% · config 20% · recency 20%. Top-matched comps best support the ARV.
Projected returns pro-forma
-3.0% appreciation · 3.0% rent growth · sell at horizon
- IRR
- -25.7%
- Equity multiple
- 0.13×
- Total profit
- $-76,114
- Equity at exit
- $46,521
- IRR
- -22.2%
- Equity multiple
- -0.13×
- Total profit
- $-99,093
- Equity at exit
- $26,977
Cash invested: $87,362 (down + closing). Projections, not guarantees.
Landlord ↔ Tenant lean methodology
- Overall (STATE)
- 90 Strongly Landlord-Friendly
- State Louisiana
- 90 Strongly Landlord-Friendly · R+12
- County
- — inherits STATE
- City
- — inherits STATE
ZIP-level market 70057
- Home prices YoY
- -7.1%
- Active inventory
- 52
- Price-to-rent
- 0.1×
Monthly cashflow live
- Estimated rent
- $2,221 medium interval (Pro) →
- Mortgage (P&I)
- −$1,636
- Tax est. 1.5%
- −$390 /mo · $4,680/yr
- Insurance
- −$130
- HOA
- −$0
- Vacancy / Maint / Mgmt
- −$466
- Net cashflow
- $-402
Break-even live
UW: 25.0% down · 7.5% · 30yr · 1.5% tax · 5.0% vac · 8.0% maint · 8.0% mgmt
Financing live
Cash to close
- Down payment
- $78,001
- Closing costs
- $9,360
- Reserves months
- —
- Total cash needed
- —
Loan-product check · same deal, 3 products live
Conventional
25% down · 7.5% · 30yr
- Down + closing
- —
- Monthly P&I
- —
- Monthly cashflow
- —
- DSCR
- —
- Eligible?
- —
Personal DTI + credit; lowest rate.
DSCR
20% down · 8.5% · 30yr
- Down + closing
- —
- Monthly P&I
- —
- Monthly cashflow
- —
- DSCR
- —
- Eligible?
- —
No personal income docs; deal must DSCR.
Hard money
10% down · 12.0% · 12mo
- Down + closing
- —
- Monthly P&I
- —
- Monthly cashflow
- —
- DSCR
- —
- Eligible?
- —
Short-term bridge; refi at stabilization.
Rent comps 2 comps
| Address | Beds | Baths | Sqft | Rent | $/sqft | DOM | Units | Dist |
|---|---|---|---|---|---|---|---|---|
| 240 Pretty Acres Ave Hahnville, LA | 4.0 | 2.0 | 1875 | $2,300 | $1.23 | 3d | 1 | 0.15mi |
| 24 Mary St Norco, LA | 3.0 | 1.0 | 1350 | $1,750 | $1.30 | 44d | 1 | 1.06mi |
Listing history 16 events
-
2026-06-18days on market $2,000 Active 197 DOM
-
2026-06-17days on market $2,000 Active 196 DOM
-
2026-06-16days on market $2,000 Active 195 DOM
-
2026-06-15days on market $2,000 Active 194 DOM
-
2026-06-13days on market $2,000 Active 192 DOM
-
2026-06-13days on market $2,000 Active 191 DOM
-
2026-06-10days on market $2,000 Active 189 DOM
-
2026-06-09days on market $2,000 Active 188 DOM
-
2026-06-08days on market $2,000 Active 187 DOM
-
2026-06-07days on market $2,000 Active 186 DOM
-
2026-06-05days on market $2,000 Active 183 DOM
-
2026-06-03days on market $2,000 Active 182 DOM
-
2026-06-02days on market $2,000 Active 181 DOM
-
2026-06-01days on market $2,000 Active 180 DOM
-
2026-05-31days on market $2,000 Active 179 DOM
-
2025-12-03$2,000 Active 153-char remark
Show marketing remark (153 chars)
New Construction for rent in Pretty Acres Subdivision. Three bedroom two full baths. Property will be ready to rent February 1, 2026. Section 8 welcomed.
ⓘ Source: listings_history table (triggers on properties + properties_extension) + one-shot
backfill from property_details.listing_events for pre-trigger history.
Nearby sold comps map
Loading sold comps map…
Walkable amenities ~0.75 mi
Loading nearby amenities…
Taxation est. · year 1
- Rental income
- $26,649
- − Mortgage interest
- −$17,477
- − Property taxes
- −$4,680
- − Insurance
- −$1,560
- − Repairs & maintenance
- −$2,132
- − Management
- −$2,132
- − Depreciation
- −$9,077
- Taxable loss
- −$10,408
- Est. tax savings @ 24.0%
- +$2,498
- After-tax cash flow
- $-2,323/yr
For passive investors: Depreciation is non-cash, so a rental often shows a tax loss while cash-flowing — sheltering income. Rental losses are passive: they offset passive income freely, and up to $25,000/yr can offset ordinary (W-2) income if you actively participate and your MAGI is under $100k (phasing out to $0 by $150k); unused losses carry forward. On sale, claimed depreciation is recaptured at up to 25%, and gains may owe capital-gains tax (a 1031 exchange can defer both). Figures are a year-1 estimate at your 24.0% rate — not tax advice; consult a CPA.
Schools (NCES district)
- District
- St. Charles Parish
- NCES district ID
- 2201440
- Math proficiency
- 40% ▼ -38.00%
- Reading proficiency
- 51% ▼ -32.00%
- Median HH income
- $60,261
- Composite
- 40.0/100
- National rank
- #3830
- State rank
- #14 of 98 in LA
Livability — Hahnville
- Score
- 60/100
- State rank
- #258
- US rank
- #19172
Category grades
Schools grade is shown separately in the Schools card above.
Census & demographics
- Census place
- Hahnville, LA
- Population (ZIP)
- 4,475
Population outlook (St. Charles County) Hauer SSP2
- Today (2025)
- 53,296 people
- By 2030
- 53,030 · -0.5%
- By 2040
- 51,646 · -3.1%
- By 2050
- 49,771 · -6.6%
- By 2075
- 46,993 · -11.8%
- By 2100
- 44,473 · -16.6%
Race, ethnicity, and origin ACS 2023
- Neighborhood character
- Diverse neighborhood (Simpson 0.63)
- Race & ethnicity
- White 44% Black 39% Hispanic / Latino 13% Two or more races 5%
- Hispanic origin (detail)
- Mexican 6% Dominican 2%
- Common ancestry
- Lithuanian 10% Romanian 1%
- Foreign-born
- 7% · Canada
- Languages at home
- 86% English-only · Spanish 11% French/Haitian/Cajun 2% German/W. Germanic 1%
Political lean MEDSL · St. Charles
- 2024 margin
- Solid R (+32.4) · D 33.0% · R 65.4% · Other 1.6%
- 2008→2024 swing
- -1.1pp toward R · 2008: -31.2pp · 2024: -32.4pp
- All cycles
- 2024: R+32.4 2020: R+29.6 2016: R+30.8 2012: R+27.8 2008: R+31.2
Not yet ingested
- Civics
- —
Market trends
- HPI YoY
- ▼ -15.65%
- Current HPI
- 203.5157
- Rent YoY
- —
- Metro
- —
- State GDP YoY
- ▲ 3.29%
- F500 in state
- 10
Industry mix (Fortune 500 HQ in LA)
| Industry | F500 HQs | Revenue |
|---|---|---|
| Telecommunications | 2 | $23B |
|
||
| Utilities | 1 | $12B |
|
||
| Wholesale / Distribution | 1 | $5B |
|
||
| Advertising | 1 | $2B |
|
||
Price history
1 event — show timeline
- 2025-12-03 Listed $2,000 AcadianaMLS
Property tax history
+127.0%/yrLatest (2024): $2,410 · -5.5% YoY. Source: county tax records.
Cash-flow waterfall
monthlySold comps — $/sqft
last 12 mo · ≤1 miLoading sold comps…