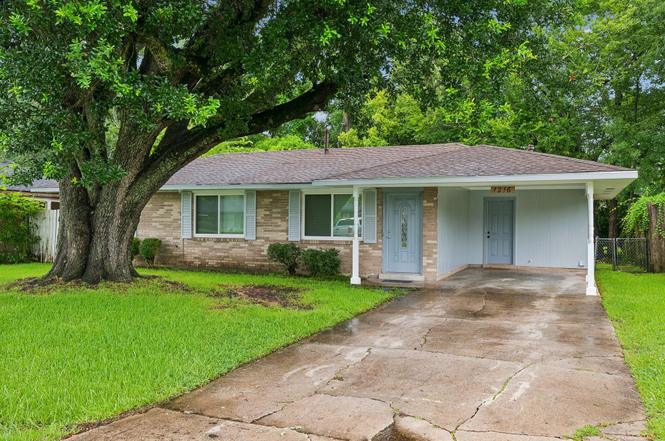
1216 S Stacy Ave · Gonzales, LA
Flood risk No data
- FEMA flood zone
- —
- Chance of flooding over 30 yrs
- —
- Est. flood insurance / yr
- —
Fire risk No data
- Est. fire insurance / yr
- —
Heat risk No data
- Hot days now (above threshold)
- —
- Hot days in 30 yrs
- —
Wind risk No data
- Chance of severe wind over 30 yrs
- —
Air-quality risk No data
- Unhealthy air days now
- —
- Unhealthy air days in 30 yrs
- —
Risk factors via First Street. Map © Google.
Why this score? — see what drove the D- grade
The composite is a weighted blend of 9 inputs, each scored 0–100. Each bar is that input's sub-score; the figure is the points it added to the 100-point composite (weight × sub-score).
- Cash flow +12.5/30.0
- ARV discount +5.8/15.0
- Schools +4.7/10.0
- DSCR +3.7/10.0
- 1% rule +3.6/10.0
- Rent growth +3.3/5.0
- Livability +3.2/5.0
- Condition / age +2.5/5.0
- Appreciation +0.0/10.0
$199,750
🖨 Deal sheet (PDF) 📄 Offer letter ✓ Due diligence
Listing remarks
This adorable home offers a cozy, modern feel from the moment you step foot through the front door. Every inch of its interior has been updated with fresh paint, contemporary flooring throughout and new front windows. This home is carpet free for easy maintenance and a seamless flow throughout the home. The kitchen has a clean polished look with updated counters, bar seating for 2, a modern finish on the cabinets and new appliances. As an added bonus, the stainless steel refrigerator remains with the home. A beautiful double glass door allows you to enjoy your morning coffee with a view of the outdoors. The fenced backyard provides plenty of space for outdoor activities, while the covered p
Key facts
- Carpet free
- Double glass door
- Updated interior
Tags
Property features AI
Exterior
- Home design: Single family home; Single-story
- Construction: Living area approximately 1125
Interior
- Bedrooms: 3 bedrooms
- Bathrooms: 1.5 bathrooms
- Interior features: Air conditioning
Neighborhood map
What this means for you Summary
Snapshot
- This is a 3-bed/1.5-bath single-family listed at $200k.
Deal economics
- At list price, monthly cash flow is $-28 ($-332/yr) — negative.
- To cash-flow at today's rent, offer at most $196k (2.0% below list).
- To meet the 1% rule (rent ≥ 1% of price), the offer needs to be $171k (14.3% below list).
- Recommended offer: $171k (14.3% below list) — sets the bar for 1% rule.
- Cap rate 6.1% vs local median 4.5% in Gonzales — top-decile yield for the area; either an underpriced asset or a hidden risk that comps aren't pricing in. Stress-test before assuming the spread holds.
Location & tenants
- Location reads 65/100 on livability (#135 in LA) — a middle-class / working-renter tenant base. Strengths: cost of living A+, housing A+; Watch: employment D, crime F, amenities F.
- Ascension Parish (suburban): math 48% / reading 58% proficiency, ranked #7 of 98 in LA (top 7%) — acceptable for families but not a draw, mixed tenant base, ~2y average lease.
- Zoned schools: Gonzales Primary School (math 25% / reading 37%, grade F, #321 of 646 statewide, top 50%, 526 students, 76% FRL); Gonzales Middle School (math 18% / reading 33%, grade F, #139 of 218 statewide, top 64%, 781 students, 69% FRL); East Ascension High School (math 47% / reading 49%, grade D, #43 of 265 statewide, top 16%, 2,098 students, 55% FRL) — zoned schools average 67% FRL vs 44% district-wide (22 pts higher); higher-poverty schools than district average — tighter screening recommended.
- Zoned-school proficiency averages 35% at this address vs 53% district-wide (-18 pts) — the specific schools serving this property underperform the Ascension Parish average; the district grade overstates school quality for this exact location.
- Market conditions: Rents rising (+3.3%/yr); 571 active listings in the ZIP; 10 comparable units currently listed for rent nearby; rentals at typical pace (median 25d on market — plan ~3-4 weeks tenant-placement turnaround); solid renter incomes; 579 units permitted in Ascension Parish in 2024 (0 in 5+ unit buildings).
Forward outlook
- Local home prices are declining (-3.0%/yr); year-one equity from $1k of loan paydown is wiped out by about $6k of value loss. Plan a longer hold.
- Ascension County population projected at +43% by 2050 — long-run rental-demand tailwind backs the buy-and-hold thesis.
Negotiation context
- Only 3 days on market — expect competitive offers; lowballing is unlikely to land.
Questions for the listing agent
- What do current leases actually rent for vs. the listed asking? Can we see a recent rent roll and the last 12 months of T-12 income?
- Is there a deadline driving the sale (1031 exchange, divorce, estate, relocation)? That informs how much negotiation room exists.
- Schools are B-rated — typically a magnet for longer-tenancy family renters. What's the average tenant stay here, and is there a school-zone premium baked into asking?
- Crime grade is F in this area — have there been break-ins, vandalism, or insurance claims at this property in the last 3 years? What carrier currently insures it and at what premium?
- The area grade is low — what's the realistic commute time and amenity access for the typical tenant pool here? Any planned neighborhood developments (good or bad) we should know about?
- What's the average days-on-market for RENTAL listings here right now (not sales)? A rising rental-DOM trend means longer vacancies and softer asking-rent achievability than the comps imply.
- What's the recent tenant-quality profile in this submarket — average credit score on applications, eviction rate, late-payment / NSF rate, and stable-employment percentage? A property-management company in the area should have these aggregated.
- How much new for-sale + rental construction is in the pipeline within 1–3 miles? Heavy new supply typically softens prices + rents 12–24 months out; constrained supply supports both.
Investment metrics
- 1% rule
- 0.86% ✗
- Cap rate
- 6.13%
- Cash-on-cash
- -0.59%
- DSCR
- 0.97
- GRM
- 9.7
CMA / ARV
- ARV (on-the-fly)
- $192,375
- Comps found
- 12
Show comp detail 12 sales within ~0.75 mi
| Address | Dist | Beds/Ba | Sqft | Sold | Price | $/sf | Match |
|---|---|---|---|---|---|---|---|
| 1124 S Stacy Ave | 0.04mi | 3/1.5 | 1,171 (+4%) | 4mo | $199,900 | $171 | 88 |
| 420 W Live Oak St | 0.11mi | 3/1.5 | 1,105 (-2%) | 14mo | $175,000 | $158 | 80 |
| 1026 S Lanoux Ave | 0.25mi | 3/2.0 | 1,105 (-2%) | 8mo | $210,000 | $190 | 77 |
| 1026 S Arceneaux Ave | 0.11mi | 3/1.0 | 1,250 (+11%) | 2mo | $155,000 | $124 | 72 |
| 1211 S Lexington Ave | 0.20mi | 3/2.0 | 1,229 (+9%) | 10mo | $212,500 | $173 | 65 |
| 1942 S Ringer Ave | 0.44mi | 3/2.0 | 1,187 (+6%) | 9mo | $189,900 | $160 | 61 |
| 1932 S Gaudin Ave | 0.45mi | 3/2.0 | 1,185 (+5%) | 9mo | $150,000 | $127 | 61 |
| 560 S Ida Ave | 0.43mi | 3/2.0 | 1,251 (+11%) | 4mo | $239,000 | $191 | 56 |
| 1934 S Ringer Ave | 0.43mi | 3/2.0 | 1,236 (+10%) | 8mo | $213,476 | $173 | 55 |
| 304 W Bordelon St | 0.52mi | 3/1.5 | 1,223 (+9%) | 12mo | $160,000 | $131 | 52 |
| 216 S Marchand Ave | 0.57mi | 3/2.0 | 1,259 (+12%) | 1mo | $214,000 | $170 | 51 |
| 317 E Spillman St | 0.65mi | 3/2.0 | 1,247 (+11%) | 6mo | $221,200 | $177 | 45 |
Match score weights: distance 35% · size 25% · config 20% · recency 20%. Top-matched comps best support the ARV.
Projected returns pro-forma
-3.0% appreciation · 3.26% rent growth · sell at horizon
- IRR
- -17.0%
- Equity multiple
- 0.40×
- Total profit
- $-33,654
- Equity at exit
- $29,783
- IRR
- -8.4%
- Equity multiple
- 0.47×
- Total profit
- $-29,615
- Equity at exit
- $17,271
Cash invested: $55,930 (down + closing). Projections, not guarantees.
Landlord ↔ Tenant lean methodology
- Overall (STATE)
- 90 Strongly Landlord-Friendly
- State Louisiana
- 90 Strongly Landlord-Friendly · R+12
- County
- — inherits STATE
- City
- — inherits STATE
ZIP-level market 70737
- Rents YoY
- 3.3%
- Active inventory
- 571
- Price-to-rent
- 9.7×
Monthly cashflow live
- Estimated rent
- $1,712 high interval (Pro) →
- Mortgage (P&I)
- −$1,048
- Tax est. 1.5%
- −$250 /mo · $2,996/yr
- Insurance
- −$83
- HOA
- −$0
- Vacancy / Maint / Mgmt
- −$360
- Net cashflow
- $-28
Break-even live
Sensitivity live
| Price | -10% $110 | -5% $41 | +0% $-28 | +5% $-97 | +10% $-166 |
|---|---|---|---|---|---|
| Rent | -10% $-163 | -5% $-95 | +0% $-28 | +5% $40 | +10% $108 |
| Rate | -1.0pp $73 | -0.5pp $23 | base $-28 | +0.5pp $-79 | +1.0pp $-132 |
UW: 25.0% down · 7.5% · 30yr · 1.5% tax · 5.0% vac · 8.0% maint · 8.0% mgmt
Financing live
Cash to close
- Down payment
- $49,938
- Closing costs
- $5,992
- Reserves months
- —
- Total cash needed
- —
Loan-product check · same deal, 3 products live
Conventional
25% down · 7.5% · 30yr
- Down + closing
- —
- Monthly P&I
- —
- Monthly cashflow
- —
- DSCR
- —
- Eligible?
- —
Personal DTI + credit; lowest rate.
DSCR
20% down · 8.5% · 30yr
- Down + closing
- —
- Monthly P&I
- —
- Monthly cashflow
- —
- DSCR
- —
- Eligible?
- —
No personal income docs; deal must DSCR.
Hard money
10% down · 12.0% · 12mo
- Down + closing
- —
- Monthly P&I
- —
- Monthly cashflow
- —
- DSCR
- —
- Eligible?
- —
Short-term bridge; refi at stabilization.
Rent comps 10 comps
| Address | Beds | Baths | Sqft | Rent | $/sqft | DOM | Units | Dist |
|---|---|---|---|---|---|---|---|---|
| 1018 S Mire Ave Gonzales, LA | 3.0 | 1.0 | 1106 | $1,350 | $1.22 | 45d | 1 | 0.24mi |
| 39511 Auster Ln Gonzales, LA | 3.0 | 2.0 | 1461 | $2,150 | $1.47 | 16d | 1 | 0.98mi |
| 920 W Tony St Unit 12-D Gonzales, LA | 2.0 | 1.5 | 1088 | $1,425 | $1.31 | 25d | 1 | 1.00mi |
| 808 S Audubon Place Ave Gonzales, LA | 2.0 | 2.0 | 1223 | $2,000 | $1.64 | 45d | 1 | 1.06mi |
| 910 W Macci St Unit 18D Gonzales, LA | 2.0 | 1.5 | 1108 | $1,375 | $1.24 | 25d | 1 | 1.07mi |
| 609 Saint Francis Pkwy Gonzales, LA | 1.0–3.0 | 1.0–2.0 | 1104 | $1,993 | $1.81 | 16d | 15 | 1.15mi |
| 2020 S Veterans Blvd Gonzales, LA | 1.0–2.0 | 1.0–2.0 | 895 | $1,653 | $1.85 | 16d | 14 | 1.19mi |
| 2009 S Veterans Blvd Gonzales, LA | 2.0–3.0 | 2.0 | 1191 | $2,397 | $2.01 | 16d | 13 | 1.31mi |
| 2419 W Orice Roth Rd Gonzales, LA | 1.0–3.0 | 1.0–2.0 | 1084 | $1,613 | $1.49 | 16d | 19 | 1.44mi |
| 12375 E Landry Rd Unit 20 Gonzales, LA | 3.0 | 1.0 | 1200 | $1,193 | $0.99 | 45d | 1 | 1.46mi |
Listing history 3 events
-
2026-06-21days on market $199,750 Coming Soon 3 DOM
-
2026-06-19remarks 699-char remark
-
2026-06-19$199,750 Coming Soon 1 DOM
ⓘ Source: listings_history table (triggers on properties + properties_extension) + one-shot
backfill from property_details.listing_events for pre-trigger history.
Nearby sold comps map
Loading sold comps map…
Walkable amenities ~0.75 mi
Loading nearby amenities…
Taxation est. · year 1
- Rental income
- $20,549
- − Mortgage interest
- −$11,189
- − Property taxes
- −$2,996
- − Insurance
- −$999
- − Repairs & maintenance
- −$1,644
- − Management
- −$1,644
- − Depreciation
- −$5,811
- Taxable loss
- −$3,734
- Est. tax savings @ 24.0%
- +$896
- After-tax cash flow
- $564/yr
For passive investors: Depreciation is non-cash, so a rental often shows a tax loss while cash-flowing — sheltering income. Rental losses are passive: they offset passive income freely, and up to $25,000/yr can offset ordinary (W-2) income if you actively participate and your MAGI is under $100k (phasing out to $0 by $150k); unused losses carry forward. On sale, claimed depreciation is recaptured at up to 25%, and gains may owe capital-gains tax (a 1031 exchange can defer both). Figures are a year-1 estimate at your 24.0% rate — not tax advice; consult a CPA.
Schools (NCES district)
- District
- Ascension Parish
- NCES district ID
- 2200090
- Math proficiency
- 48% ▼ -31.00%
- Reading proficiency
- 58% ▼ -25.00%
- Median HH income
- $68,423
- Composite
- 47.0/100
- National rank
- #2347
- State rank
- #7 of 98 in LA
Livability — Gonzales
- Score
- 65/100
- State rank
- #135
- US rank
- #12429
Category grades
Schools grade is shown separately in the Schools card above.
Census & demographics
- Census place
- Gonzales, LA
- County
- Ascension Parish · 98,362 people
- City population
- 49,084
- Metro
- Baton Rouge, LA
- Population (ZIP)
- 49,084
- Household income
- $82,521
- Rent vs Own
- Severe rent burden
- 863.0
Population outlook (Ascension County) Hauer SSP2
- Today (2025)
- 145,480 people
- By 2030
- 158,329 · +8.8%
- By 2040
- 183,741 · +26.3%
- By 2050
- 207,615 · +42.7%
- By 2075
- 260,244 · +78.9%
- By 2100
- 289,576 · +99.0%
Race, ethnicity, and origin ACS 2023
- Neighborhood character
- Diverse neighborhood (Simpson 0.57)
- Race & ethnicity
- White 59% Black 26% Hispanic / Latino 10% Two or more races 7%
- Hispanic origin (detail)
- Mexican 6%
- Common ancestry
- Lithuanian 15% Serbian 1% Slovak 1%
- Foreign-born
- 7% · Canada
- Languages at home
- 89% English-only · Spanish 9% French/Haitian/Cajun 1% Other Indo-European 1%
Political lean MEDSL · Ascension
- 2024 margin
- Solid R (+34.0) · D 32.2% · R 66.1% · Other 1.7%
- 2008→2024 swing
- +1.7pp toward D · 2008: -35.7pp · 2024: -34.0pp
- All cycles
- 2024: R+34.0 2020: R+32.5 2016: R+36.0 2012: R+34.3 2008: R+35.7
Not yet ingested
- Civics
- —
Market trends
- HPI YoY
- ▼ -89.49%
- Current HPI
- 145.3384
- Rent YoY
- ▲ 3.26%
- Metro
- Baton Rouge, LA
- State GDP YoY
- ▲ 3.29%
- F500 in state
- 10
Industry mix (Fortune 500 HQ in LA)
| Industry | F500 HQs | Revenue |
|---|---|---|
| Telecommunications | 2 | $23B |
|
||
| Utilities | 1 | $12B |
|
||
| Wholesale / Distribution | 1 | $5B |
|
||
| Advertising | 1 | $2B |
|
||
Cash-flow waterfall
monthlySold comps — $/sqft
last 12 mo · ≤1 miLoading sold comps…