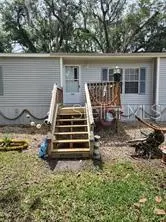
5550 S Coral Bells Ave · Homosassa, FL
Flood risk 10/10 · Severe
- FEMA flood zone
- AE
- Chance of flooding over 30 yrs
- 0.99%
- Est. flood insurance / yr
- $1,737 – $8,500
Fire risk 3/10 · Minor
- Est. fire insurance / yr
- $947 – $1,759
Heat risk 9/10 · Severe
- Hot days now (above 110°F)
- 7 days/yr
- Hot days in 30 yrs
- 25 days/yr
Wind risk 9/10 · Severe
- Chance of severe wind over 30 yrs
- 99.0%
Air-quality risk 1/10 · Minimal
- Unhealthy air days now
- 0 days/yr
- Unhealthy air days in 30 yrs
- 0 days/yr
Risk factors via First Street. Map © Google.
Why this score? — see what drove the C+ grade
The composite is a weighted blend of 9 inputs, each scored 0–100. Each bar is that input's sub-score; the figure is the points it added to the 100-point composite (weight × sub-score).
- Cash flow +30.0/30.0
- DSCR +10.0/10.0
- 1% rule +8.8/10.0
- Schools +4.1/10.0
- Livability +3.1/5.0
- Rent growth +2.5/5.0
- Condition / age +2.5/5.0
- ARV discount +0.8/15.0
- Appreciation +0.0/10.0
$205,000
🖨 Deal sheet (PDF) 📄 Offer letter ✓ Due diligence
Listing remarks MLS
Tucked away in Old Homosassa, Florida this home offers the best of Florida living—high & dry with plenty of space, and a location that puts adventure at your doorstep! Step inside to a welcoming split 3/2 floor plan, where the open great room has vaulted ceilings and features a wood-burning fireplace that is warm & inviting. The Master Suite is spacious with a walk-in closet & a master bath with dual sinks and walk-in shower. The private laundry room includes a washer & dryer and storage. The brand-new A/C (2024) ensures comfort year-round, and the spacious kitchen has an eating nook and plenty of cabinet space! Outside, you'll find a huge aluminum carport with a concrete slab, ideal for keeping your boat, trailer, or golf cart protected—because let’s be honest, you’ll want all three in this golf-cart-friendly, waterfront community! This property has no restrictions and would make a great weekend getaway or could be rented out! Minutes from world-class fishing, scenic springs, lively waterfront dining, and the best of the Nature Coast, this home is your ticket to the laid-back, outdoor lifestyle Old Homosassa is famous for. Come check this charming well-maintained home out today!
Key facts
- Plenty of storage
- Split floor plan
- Backyard is fenced
Tags
Property features AI
Finance
- Other: Furnished; Lot approximately 0.3 acres (about 101 x 130); Asphalt road access
Exterior
- Parking: Has carport; Carport for 2 vehicles
- Utilities: Well water; Septic tank; Cable connected; Public utilities available
- Home design: Residential modular home; Single-story (one level); Faces east; Entry on one level
- Construction: Metal frame construction; Metal roof; Crawlspace foundation; Built as a modular home
- Exterior features: Outdoor shower; Private mailbox; Storage
Interior
- Kitchen: Range; Refrigerator; Dishwasher
- Bedrooms: 3 bedrooms
- Flooring: Laminate
- Bathrooms: 2 full bathrooms
- Heating & cooling: Electric heat; Central air conditioning; Wood-burning fireplace in living room
- Interior features: Walk-in closet(s); Formal living room separate; Inside utility
- Laundry & utility: Laundry room; Washer; Dryer
Neighborhood map
What this means for you Summary
Snapshot
- This is a 3-bed/2.0-bath manufactured listed at $205k.
Deal economics
- At list price, monthly cash flow is $604 ($7k/yr) — positive.
- The deal already cash-flows at list — no discount required.
- Meets the 1% rule at list price ($3k rent vs $205k).
- Recommended offer: $202k (1.5% below list) — sets the bar for market timing.
- Cap rate 12.3% vs local median 1.8% in Homosassa — top-decile yield for the area; either an underpriced asset or a hidden risk that comps aren't pricing in. Stress-test before assuming the spread holds.
Location & tenants
- Location reads 62/100 on livability (#749 in FL) — a middle-class / working-renter tenant base. Strengths: crime A+; Watch: health & safety C-, employment D+, amenities F.
- Citrus (rural): math 49% / reading 50% proficiency, ranked #44 of 73 in FL (top 60%) — families likely to look elsewhere, expect single-tenant / working-renter base with shorter leases.
- Zoned schools: Homosassa Elementary School (math 62% / reading 47%, grade C, #892 of 2,144 statewide, top 44%, 411 students, 78% FRL); Crystal River Middle School (math 49% / reading 47%, grade C-, #286 of 571 statewide, top 50%, 900 students, 64% FRL); Crystal River High School (math 31% / reading 44%, grade F, #336 of 667 statewide, top 51%, 1,249 students, 56% FRL).
- Market conditions: 311 active listings in the ZIP; 7 comparable units currently listed for rent nearby; rentals at typical pace (median 23d on market — plan ~3-4 weeks tenant-placement turnaround); 2,443 units permitted in Citrus County in 2024 (0 in 5+ unit buildings).
- At $2,827/mo this rent would consume 74% of the median local household income ($46k/yr) (locally 113% of renters already pay >50% of income on rent) — very limited rent-growth headroom before tenants either downsize or default.
Forward outlook
- Local home prices are declining (-3.0%/yr); year-one equity from $1k of loan paydown is wiped out by about $6k of value loss. Plan a longer hold.
- Citrus County population projected to shrink 10% by 2050 — rents likely to lag national; underwrite the cash flow, not the appreciation.
- At projected returns (-3.0% appreciation + 3.0% rent growth), your $57k cash investment doubles in ~9 years — after that, you're playing with house money.
Negotiation context
- It's been on market 19 days — a 2% lower offer ($202k) is reasonable based on typical stale-listing flexibility.
- 4 sale attempts with the ask held roughly flat each time — persistent listings suggest the price (not the market) is what's stuck; bring a comps-based counter.
Risks & watch-outs
- Watch-outs: flood insurance adds $427/mo.
- Climate carrying-cost: in FEMA flood zone AE (mandatory federal flood insurance); severe wind risk, 99% chance of damaging wind over 30y; extreme-heat days projected 7→25/yr by 2055 (HVAC capex compounding) — expect insurance premiums to compound above CPI over the hold.
Questions for the listing agent
- What's the actual annual flood-insurance premium (NFIP or private), and is the property in a SFHA with mandatory coverage?
- Is there a deadline driving the sale (1031 exchange, divorce, estate, relocation)? That informs how much negotiation room exists.
- What's the average days-on-market for RENTAL listings here right now (not sales)? A rising rental-DOM trend means longer vacancies and softer asking-rent achievability than the comps imply.
- What's the recent tenant-quality profile in this submarket — average credit score on applications, eviction rate, late-payment / NSF rate, and stable-employment percentage? A property-management company in the area should have these aggregated.
- How much new for-sale + rental construction is in the pipeline within 1–3 miles? Heavy new supply typically softens prices + rents 12–24 months out; constrained supply supports both.
Investment metrics
- 1% rule
- 1.38% ✓
- Cap rate
- 12.33%
- Cash-on-cash
- 21.54%
- DSCR
- 1.96
- GRM
- 6.0
CMA / ARV
- ARV (on-the-fly)
- $178,480
- Comps found
- 2
Show comp detail 2 sales within ~0.75 mi
| Address | Dist | Beds/Ba | Sqft | Sold | Price | $/sf | Match |
|---|---|---|---|---|---|---|---|
| 5550 S Coral Bells Ave | 0.00mi | 3/2.0 | 1,552 (0%) | 14mo | $179,000 | $115 | 88 |
| 10321 W Central St | 0.14mi | 2/2.0 (-1) | 1,587 (+2%) | 5mo | $165,000 | $104 | 81 |
Match score weights: distance 35% · size 25% · config 20% · recency 20%. Top-matched comps best support the ARV.
Projected returns pro-forma
-3.0% appreciation · 3.0% rent growth · sell at horizon
- IRR
- 2.5%
- Equity multiple
- 1.09×
- Total profit
- $5,421
- Equity at exit
- $30,566
- IRR
- 12.1%
- Equity multiple
- 1.96×
- Total profit
- $54,956
- Equity at exit
- $17,725
Cash invested: $57,400 (down + closing). Projections, not guarantees.
Landlord ↔ Tenant lean methodology
- Overall (STATE)
- 87 Strongly Landlord-Friendly
- State Florida
- 87 Strongly Landlord-Friendly · R+3
- County
- — inherits STATE
- City
- — inherits STATE
ZIP-level market 34448
- Home prices YoY
- -26.1%
- Active inventory
- 311
- Price-to-rent
- 6.0×
Monthly cashflow live
- Estimated rent
- $2,827 high interval (Pro) →
- Mortgage (P&I)
- −$1,075
- Tax from tax record
- −$42 /mo · $507/yr
- Insurance
- −$85
- Flood insurance flood zone
- −$427 /mo · $5,118/yr
- HOA
- −$0
- Vacancy / Maint / Mgmt
- −$594
- Net cashflow
- $604
Break-even live
Sensitivity live
| Price | -10% $720 | -5% $662 | +0% $604 | +5% $546 | +10% $488 |
|---|---|---|---|---|---|
| Rent | -10% $381 | -5% $492 | +0% $604 | +5% $716 | +10% $827 |
| Rate | -1.0pp $707 | -0.5pp $656 | base $604 | +0.5pp $551 | +1.0pp $497 |
UW: 25.0% down · 7.5% · 30yr · 1.5% tax · 5.0% vac · 8.0% maint · 8.0% mgmt
Financing live
Cash to close
- Down payment
- $51,250
- Closing costs
- $6,150
- Reserves months
- —
- Total cash needed
- —
Loan-product check · same deal, 3 products live
Conventional
25% down · 7.5% · 30yr
- Down + closing
- —
- Monthly P&I
- —
- Monthly cashflow
- —
- DSCR
- —
- Eligible?
- —
Personal DTI + credit; lowest rate.
DSCR
20% down · 8.5% · 30yr
- Down + closing
- —
- Monthly P&I
- —
- Monthly cashflow
- —
- DSCR
- —
- Eligible?
- —
No personal income docs; deal must DSCR.
Hard money
10% down · 12.0% · 12mo
- Down + closing
- —
- Monthly P&I
- —
- Monthly cashflow
- —
- DSCR
- —
- Eligible?
- —
Short-term bridge; refi at stabilization.
Rent comps 7 comps
| Address | Beds | Baths | Sqft | Rent | $/sqft | DOM | Units | Dist |
|---|---|---|---|---|---|---|---|---|
| 5111 S Gray Pelican Way Unit 5111 Homosassa, FL | 2.0 | 2.0 | 1543 | $3,200 | $2.07 | 23d | 1 | 0.90mi |
| 11445 W Riverhaven Dr Homosassa, FL | 2.0 | 2.0 | 1493 | $2,900 | $1.94 | 23d | 1 | 1.15mi |
| 11459 W Riverhaven Dr Homosassa, FL | 2.0 | 2.0 | 1699 | $3,000 | $1.77 | 23d | 1 | 1.17mi |
| 5230 S View Pt Homosassa, FL | 2.0 | 2.0 | 1149 | $2,800 | $2.44 | 23d | 1 | 1.19mi |
| 11481 W Riverhaven Dr Homosassa, FL | 2.0 | 2.0 | 1149 | $3,000 | $2.61 | 23d | 1 | 1.19mi |
| 11639 W Riverhaven Dr Homosassa, FL | 3.0 | 2.0 | 1925 | $2,900 | $1.51 | 23d | 1 | 1.39mi |
| 11643 W Riverhaven Dr Homosassa, FL | 3.0 | 2.5 | 1821 | $2,900 | $1.59 | 23d | 1 | 1.40mi |
Listing history 14 events
-
2026-06-21days on market $205,000 Active 19 DOM
-
2026-06-19days on market $205,000 Active 17 DOM
-
2026-06-18days on market $205,000 Active 16 DOM
-
2026-06-17days on market $205,000 Active 15 DOM
-
2026-06-16days on market $205,000 Active 14 DOM
-
2026-06-15days on market $205,000 Active 13 DOM
-
2026-06-14days on market $205,000 Active 11 DOM
-
2026-06-13days on market $205,000 Active 10 DOM
-
2026-06-10days on market $205,000 Active 8 DOM
-
2026-06-09days on market $205,000 Active 7 DOM
-
2026-06-08days on market $205,000 Active 6 DOM
-
2026-06-07days on market $205,000 Active 5 DOM
-
2026-06-03remarks 689-char remark
-
2026-06-03$205,000 Active 1 DOM
ⓘ Source: listings_history table (triggers on properties + properties_extension) + one-shot
backfill from property_details.listing_events for pre-trigger history.
Tax reassessment forecast FL · Resets to sale price
- Current annual tax
- $507 · $42/mo
- Projected year-2 tax
- $1,702 · $142/mo
- Expected delta
- +$1,194/yr (+$100/mo · 235.6%)
ⓘ Screening estimate from a state-policy table — verify with the county assessor before closing.
Climate risk First Street
- Flood 10/10 Extreme FEMA zone AE · 99% chance over 30 yrs
- Wildfire 3/10 Moderate
- Heat 9/10 Extreme 7 d/yr ≥110°F today · 25 d/yr by 30 yrs out
- Wind 9/10 Extreme 99% chance of damaging wind over 30 yrs
- Air quality 1/10 Low 0 unhealthy d/yr today · 0 by 30 yrs out
Nearby sold comps map
Loading sold comps map…
Walkable amenities ~0.75 mi
Loading nearby amenities…
Taxation est. · year 1
- Rental income
- $33,922
- − Mortgage interest
- −$11,483
- − Property taxes
- −$507
- − Insurance
- −$6,144
- − Repairs & maintenance
- −$2,714
- − Management
- −$2,714
- − Depreciation
- −$5,964
- Taxable income
- $4,397
- Est. tax owed @ 24.0%
- −$1,055
- After-tax cash flow
- $6,192/yr
For passive investors: Depreciation is non-cash, so a rental often shows a tax loss while cash-flowing — sheltering income. Rental losses are passive: they offset passive income freely, and up to $25,000/yr can offset ordinary (W-2) income if you actively participate and your MAGI is under $100k (phasing out to $0 by $150k); unused losses carry forward. On sale, claimed depreciation is recaptured at up to 25%, and gains may owe capital-gains tax (a 1031 exchange can defer both). Figures are a year-1 estimate at your 24.0% rate — not tax advice; consult a CPA.
Schools (NCES district)
- District
- Citrus
- NCES district ID
- 1200270
- Math proficiency
- 49% ▼ -10.00%
- Reading proficiency
- 50% ▼ -6.00%
- Median HH income
- $38,618
- Composite
- 41.28/100
- National rank
- #3519
- State rank
- #44 of 73 in FL
Livability — Homosassa
- Score
- 62/100
- State rank
- #749
- US rank
- #16240
Category grades
Schools grade is shown separately in the Schools card above.
Census & demographics
- Census place
- Homosassa, FL
- County
- Citrus County · 111,314 people
- City population
- 29,919
- Metro
- Homosassa Springs, FL
- Population (ZIP)
- 10,817
- Household income
- $45,916
- Rent vs Own
- Severe rent burden
- 113.0
Population outlook (Citrus County) Hauer SSP2
- Today (2025)
- 138,622 people
- By 2030
- 136,886 · -1.3%
- By 2040
- 132,009 · -4.8%
- By 2050
- 125,196 · -9.7%
- By 2075
- 108,570 · -21.7%
- By 2100
- 84,454 · -39.1%
Race, ethnicity, and origin ACS 2023
- Neighborhood character
- Predominantly White (94%)
- Race & ethnicity
- White 94% Two or more races 3% Hispanic / Latino 3% Black 1%
- Common ancestry
- Slovak 3% Scotch-Irish 2% Lithuanian 2%
- Foreign-born
- 2% · Canada
- Languages at home
- 96% English-only · Spanish 2% Russian/Polish/Slavic 1%
Political lean MEDSL · Citrus
- 2024 margin
- Solid R (+45.9) · D 26.8% · R 72.6%
- 2008→2024 swing
- -29.8pp toward R · 2008: -16.1pp · 2024: -45.9pp
- All cycles
- 2024: R+45.9 2020: R+41.0 2016: R+39.7 2012: R+21.9 2008: R+16.1
Not yet ingested
- Civics
- —
Market trends
- HPI YoY
- ▼ -110.27%
- Current HPI
- 312.4302
- Rent YoY
- —
- Metro
- Homosassa Springs, FL
- State GDP YoY
- ▲ 3.28%
- F500 in state
- 36
Industry mix (Fortune 500 HQ in FL)
| Industry | F500 HQs | Revenue |
|---|---|---|
| Industrial Technology | 2 | $29B |
|
||
| Insurance | 2 | $17B |
|
||
| Retail | 1 | $60B |
|
||
| Technology Distribution | 1 | $58B |
|
||
| Homebuilding | 1 | $35B |
|
||
| Technology Manufacturing | 1 | $35B |
|
||
Price history
+173.3% since first listed16 events — show timeline
- 2026-06-01 Listed $205,000 Stellar MLS as Distributed by MLS Grid
- 2026-02-15 Listing Removed — Stellar MLS as Distributed by MLS Grid
- 2026-01-16 Price Changed $204,900 Stellar MLS as Distributed by MLS Grid
- 2025-10-02 Price Changed $207,000 Stellar MLS as Distributed by MLS Grid
- 2025-09-08 Price Changed $209,900 Stellar MLS as Distributed by MLS Grid
- 2025-08-23 Relisted — Stellar MLS as Distributed by MLS Grid
- 2025-08-19 Pending — Stellar MLS as Distributed by MLS Grid
- 2025-07-06 Price Changed $214,000 Stellar MLS as Distributed by MLS Grid
- 2025-06-24 Price Changed $219,000 Stellar MLS as Distributed by MLS Grid
- 2025-06-12 Price Changed $222,000 Stellar MLS as Distributed by MLS Grid
- 2025-05-13 Listed $225,000 Stellar MLS as Distributed by MLS Grid
- 2025-04-14 Sold (Public Records) $189,000 Public Records
- 2025-04-11 Sold (MLS) $179,000 RACC
- 2025-03-19 Pending — RACC
- 2025-03-14 Listed $189,000 RACC
- 2004-11-23 Sold (Public Records) $75,000 Public Records
Property tax history
-0.3%/yrLatest (2025): $507 · +15.5% YoY. Source: county tax records.
Cash-flow waterfall
monthlySold comps — $/sqft
last 12 mo · ≤1 miLoading sold comps…