 Duplex
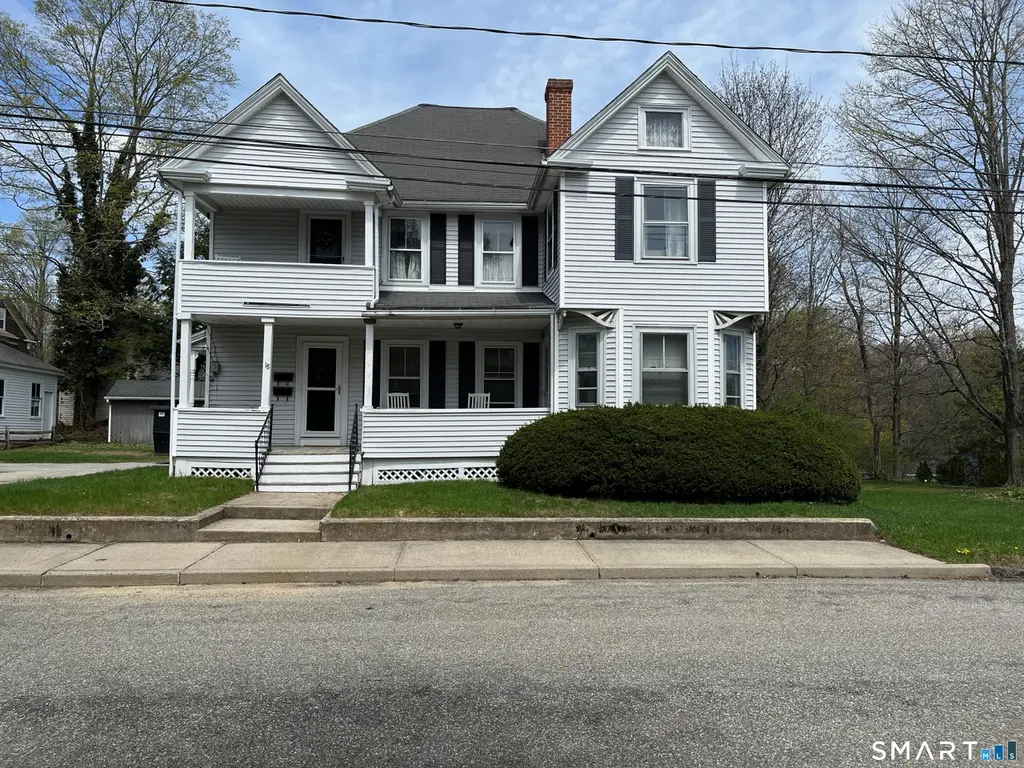
18 Addison St · Putnam, CT
Flood risk 1/10 · Minimal
- FEMA flood zone
- X (unshaded)
- Chance of flooding over 30 yrs
- 0.0%
- Est. flood insurance / yr
- $473 – $860
Fire risk 3/10 · Minor
- Est. fire insurance / yr
- $829 – $1,539
Heat risk 4/10 · Minor
- Hot days now (above 95°F)
- 7 days/yr
- Hot days in 30 yrs
- 15 days/yr
Wind risk 6/10 · Moderate
- Chance of severe wind over 30 yrs
- 53.0%
Air-quality risk 2/10 · Minimal
- Unhealthy air days now
- 2 days/yr
- Unhealthy air days in 30 yrs
- 2 days/yr
Risk factors via First Street. Map © Google.
Why this score? — see what drove the C+ grade
The composite is a weighted blend of 9 inputs, each scored 0–100. Each bar is that input's sub-score; the figure is the points it added to the 100-point composite (weight × sub-score).
- Cash flow +27.3/30.0
- DSCR +9.5/10.0
- ARV discount +8.3/15.0
- 1% rule +7.2/10.0
- Livability +3.3/5.0
- Schools +2.6/10.0
- Rent growth +2.5/5.0
- Condition / age +2.5/5.0
- Appreciation +0.0/10.0
$275,000
🖨 Deal sheet 📄 Offer letter ✓ Due diligence
Multi-family units
County records classify this as Multi-Family (2-4 Unit). Listing-text estimate: 2 units. confirmed
Listing remarks
Tucked away on the outskirts of Putnam, this stately two-family home offers the perfect mix of classic charm and space. Each apartment features 2 bedrooms, 1 full bath, laundry hookups, and its own covered porch - the perfect spot to relax and enjoy the peaceful surroundings. Bright and comfortable living spaces, a spacious yard, and a quiet setting give this property a warm and welcoming feel, all while being just minutes from local shops and restaurants. multiple offers. Please submit highest and best offers by 6/1/26 at 1:00.
Key facts
- 0.26 acre lot
- 3 parking spots
- Built 1907
Property features AI
Exterior
- Parking: Off-street parking and driveway (3 total parking spaces)
- Utilities: Public water connected; Public sewer connected; Natural gas hot water (domestic, 40 gallon tank); Gas available in street
- Home design: Multi-family (2-family) property
- Construction: Frame construction with vinyl siding; Brick and stone foundation; Asphalt shingle roof; White exterior color
- Exterior features: Enclosed porch and open porch; Balcony; Sidewalk; Shed; Gutters; French doors; Level lot; Private paved asphalt driveway
Interior
- Bedrooms: 4 bedrooms
- Bathrooms: 2 full bathrooms
- Heating & cooling: Hot air heating; Window unit air conditioning
- Interior features: 10 total rooms; Full unfinished basement with interior access, dirt floor and storage; Attic with floored storage and pull-down stairs; Window unit cooling
- Laundry & utility: Laundry hookups in all units (in-unit hookups for Unit 1 and Unit 2)
Neighborhood map
What this means for you Summary
Snapshot
- This is a 2 × 2-bed/1.0-bath units multifamily listed at $275k.
Deal economics
- At list price, monthly cash flow is $797 ($10k/yr) — positive. Per door: $398/mo.
- The deal already cash-flows at list — no discount required.
- Meets the 1% rule at list price ($3k rent vs $275k).
- Cap rate 9.8% vs local median 3.5% in Putnam — top-decile yield for the area; either an underpriced asset or a hidden risk that comps aren't pricing in. Stress-test before assuming the spread holds.
Location & tenants
- Location reads 66/100 on livability (#117 in CT) — a middle-class / working-renter tenant base. Strengths: crime A+, housing A+, cost of living A; Watch: health & safety D+, amenities F, commute F.
- Putnam School District (suburban): math 25% / reading 34% proficiency, ranked #126 of 153 in CT (top 82%) — low school quality limits family demand, transient renter base, plan for 1-2y turnover.
- Zoned schools: Putnam Elementary School (math 31% / reading 33%, grade F, #361 of 553 statewide, top 68%, 571 students, 57% FRL); Putnam High School (math 34% / reading 54%, grade F, #94 of 194 statewide, top 49%, 253 students, 48% FRL) — zoned schools at 53% FRL track the district average.
- Market conditions: 58 active listings in the ZIP; 149 units permitted in Northeastern Connecticut Planning Region in 2024 (0 in 5+ unit buildings).
Forward outlook
- Local home prices are declining (-3.0%/yr); year-one equity from $2k of loan paydown is wiped out by about $8k of value loss. Plan a longer hold.
- At projected returns (-3.0% appreciation + 3.0% rent growth), your $77k cash investment doubles in ~10 years — after that, you're playing with house money.
Negotiation context
- Only 5 days on market — expect competitive offers; lowballing is unlikely to land.
- Current owner paid $35k; list at $275k implies a 686% gain — meaningful room to come down on a strong offer.
Risks & watch-outs
- Watch-outs: built in 1907 — expect roof / HVAC / electrical / plumbing capex.
- Climate carrying-cost: major wind risk, 53% chance of damaging wind over 30y — expect insurance premiums to compound above CPI over the hold.
Questions for the listing agent
- Can we see the unit-by-unit rent roll, current vacancy, and any below-market leases? What's the average tenancy length?
- What capital expenditures (roof, boiler, parking lot, exteriors) have been made in the last 5 years, and what's planned in the next 2?
- Built in 1907 — when were the roof, HVAC, electrical panel, plumbing, and water heater last replaced?
- Is there a deadline driving the sale (1031 exchange, divorce, estate, relocation)? That informs how much negotiation room exists.
- Schools are D-rated, which usually means shorter tenancies and higher turnover. Who's the typical renter profile here, and what's been the actual vacancy rate?
- What's the average days-on-market for RENTAL listings here right now (not sales)? A rising rental-DOM trend means longer vacancies and softer asking-rent achievability than the comps imply.
- What's the recent tenant-quality profile in this submarket — average credit score on applications, eviction rate, late-payment / NSF rate, and stable-employment percentage? A property-management company in the area should have these aggregated.
- How much new apartment / multifamily construction is in the pipeline within 1–3 miles? Heavy new supply (>2% of stock underway) typically softens rents 12–24 months out; light construction supports rent growth.
Investment metrics
- 1% rule
- 1.22% ✓
- Cap rate
- 9.77%
- Cash-on-cash
- 12.42%
- DSCR
- 1.55
- GRM
- 6.9
CMA / ARV
- ARV (on-the-fly)
- $279,840
- Comps found
- 5
Show comp detail 5 sales within ~0.75 mi
| Address | Dist | Beds/Ba | Sqft | Sold | Price | $/sf | Match |
|---|---|---|---|---|---|---|---|
| 41-43 Mill St | 0.34mi | 4/2.0 | 2,128 (+0%) | 1mo | $250,000 | $117 | 83 |
| 126 Powhattan St | 0.23mi | 4/3.0 | 2,116 (-0%) | 15mo | $253,500 | $120 | 72 |
| 19 Bolles St | 0.47mi | 4/2.0 | 1,820 (-14%) | 1mo | $297,500 | $163 | 53 |
| 203 School St | 0.52mi | 5/3.0 (+1) | 1,887 (-11%) | 1mo | $367,150 | $195 | 48 |
| 68 Battey St | 0.25mi | 5/2.0 (+1) | 1,824 (-14%) | 15mo | $240,000 | $132 | 48 |
Match score weights: distance 35% · size 25% · config 20% · recency 20%. Top-matched comps best support the ARV.
Projected returns pro-forma
-3.0% appreciation · 3.0% rent growth · sell at horizon
- IRR
- 2.1%
- Equity multiple
- 1.08×
- Total profit
- $6,206
- Equity at exit
- $41,003
- IRR
- 11.7%
- Equity multiple
- 1.92×
- Total profit
- $70,822
- Equity at exit
- $23,777
Cash invested: $77,000 (down + closing). Projections, not guarantees.
Landlord ↔ Tenant lean methodology
- Overall (STATE)
- 27 Tenant-Leaning
- State Connecticut
- 27 Tenant-Leaning · D+7
- County
- — inherits STATE
- City
- — inherits STATE
ZIP-level market 06260
- Home prices YoY
- -4.3%
- Active inventory
- 58
- Price-to-rent
- 13.7×
Monthly cashflow live
- Estimated rent
- $3,345 high interval (Pro) →
- Mortgage (P&I)
- −$1,442
- Tax from tax record
- −$289 /mo · $3,468/yr
- Insurance
- −$115
- HOA
- −$0
- Vacancy / Maint / Mgmt
- −$702
- Net cashflow
- $797
Break-even live
2-unit breakdown (identical units grouped — click to expand)
| Units | Beds | Baths | Est. rent |
|---|---|---|---|
| 2× units | 2 | 1 | $3,344 |
| #1 | 2 | 1 | $1,672 |
| #2 | 2 | 1 | $1,672 |
| Total (2 units) | $3,345 | ||
UW: 25.0% down · 7.5% · 30yr · 1.5% tax · 5.0% vac · 8.0% maint · 8.0% mgmt
Financing live
Cash to close
- Down payment
- $68,750
- Closing costs
- $8,250
- Reserves months
- —
- Total cash needed
- —
Loan-product check · same deal, 3 products live
Conventional
25% down · 7.5% · 30yr
- Down + closing
- —
- Monthly P&I
- —
- Monthly cashflow
- —
- DSCR
- —
- Eligible?
- —
Personal DTI + credit; lowest rate.
DSCR
20% down · 8.5% · 30yr
- Down + closing
- —
- Monthly P&I
- —
- Monthly cashflow
- —
- DSCR
- —
- Eligible?
- —
No personal income docs; deal must DSCR.
Hard money
10% down · 12.0% · 12mo
- Down + closing
- —
- Monthly P&I
- —
- Monthly cashflow
- —
- DSCR
- —
- Eligible?
- —
Short-term bridge; refi at stabilization.
Listing history 8 events
-
2026-06-03status $275,000 Under Contract 5 DOM
-
2026-06-02days on market $275,000 Active 5 DOM
-
2026-06-01remarks 534-char remark
-
2026-06-01days on market $275,000 Active 4 DOM
-
2026-05-31days on market $275,000 Active 3 DOM
-
2026-05-31days on market $275,000 Active 2 DOM
-
2026-05-25historical $275,000
-
1981-04-24soldstatus $35,000
ⓘ Source: listings_history table (triggers on properties + properties_extension) + one-shot
backfill from property_details.listing_events for pre-trigger history.
Tax reassessment forecast CT · Partial reset (capped growth)
- Current annual tax
- $3,468 · $289/mo
- Projected year-2 tax
- $4,676 · $390/mo
- Expected delta
- +$1,208/yr (+$101/mo · 34.8%)
ⓘ Screening estimate from a state-policy table — verify with the county assessor before closing.
Climate risk First Street
- Flood 1/10 Low FEMA zone X (unshaded) · 0% chance over 30 yrs
- Wildfire 3/10 Moderate
- Heat 4/10 Moderate 7 d/yr ≥95°F today · 15 d/yr by 30 yrs out
- Wind 6/10 Major 53% chance of damaging wind over 30 yrs
- Air quality 2/10 Low 2 unhealthy d/yr today · 2 by 30 yrs out
Nearby sold comps map
Loading sold comps map…
Walkable amenities ~0.75 mi
Loading nearby amenities…
Taxation est. · year 1
- Rental income
- $40,140
- − Mortgage interest
- −$15,404
- − Property taxes
- −$3,468
- − Insurance
- −$1,375
- − Repairs & maintenance
- −$3,211
- − Management
- −$3,211
- − Depreciation
- −$8,000
- Taxable income
- $5,470
- Est. tax owed @ 24.0%
- −$1,313
- After-tax cash flow
- $8,249/yr
For passive investors: Depreciation is non-cash, so a rental often shows a tax loss while cash-flowing — sheltering income. Rental losses are passive: they offset passive income freely, and up to $25,000/yr can offset ordinary (W-2) income if you actively participate and your MAGI is under $100k (phasing out to $0 by $150k); unused losses carry forward. On sale, claimed depreciation is recaptured at up to 25%, and gains may owe capital-gains tax (a 1031 exchange can defer both). Figures are a year-1 estimate at your 24.0% rate — not tax advice; consult a CPA.
Schools (NCES district)
- District
- Putnam School District
- NCES district ID
- 0903480
- Math proficiency
- 25% ▼ -12.00%
- Reading proficiency
- 34% ▼ -19.00%
- Median HH income
- $51,031
- Composite
- 25.85/100
- National rank
- #7349
- State rank
- #126 of 153 in CT
Livability — Putnam
- Score
- 66/100
- State rank
- #117
- US rank
- #11486
Category grades
Schools grade is shown separately in the Schools card above.
Census & demographics
- Census place
- Putnam, CT
- Population (ZIP)
- 9,227
Population outlook (Northeastern Connecticut County) Hauer SSP2
- By 2040
- 104,160
Race, ethnicity, and origin ACS 2023
- Neighborhood character
- Predominantly White (84%)
- Race & ethnicity
- White 84% Hispanic / Latino 7% Two or more races 6% Black 2% Asian 1%
- Hispanic origin (detail)
- Puerto Rican 4%
- Common ancestry
- Lithuanian 18% Romanian 5% Scotch-Irish 1%
- Foreign-born
- 4% · Canada, South Korea
- Languages at home
- 94% English-only · Spanish 4% Russian/Polish/Slavic 1% French/Haitian/Cajun 1%
Political lean MEDSL · Northeastern Connecticut
- 2024 margin
- R (+15.4) · D 41.5% · R 57.0% · Other 1.5%
- All cycles
- 2024: R+15.4
Not yet ingested
- Civics
- —
Market trends
- HPI YoY
- ▼ -14.95%
- Current HPI
- 332.9661
- Rent YoY
- —
- Metro
- —
- State GDP YoY
- ▲ 1.06%
- F500 in state
- 38
Industry mix (Fortune 500 HQ in CT)
| Industry | F500 HQs | Revenue |
|---|---|---|
| Industrial Machinery | 4 | $38B |
|
||
| Insurance | 3 | $71B |
|
||
| Financial Services | 2 | $25B |
|
||
| Transportation / Logistics | 2 | $18B |
|
||
| Healthcare | 1 | $247B |
|
||
| Telecommunications | 1 | $55B |
|
||
Price history
+685.7% since first listed2 events — show timeline
- 2026-05-25 Coming Soon $275,000 Smart MLS
- 1981-04-24 Sold (Public Records) $35,000 Public Records
Property tax history
+1.9%/yrLatest (2023): $3,468 · +3.6% YoY. Source: county tax records.
Cash-flow waterfall
monthlySold comps — $/sqft
last 12 mo · ≤1 miLoading sold comps…