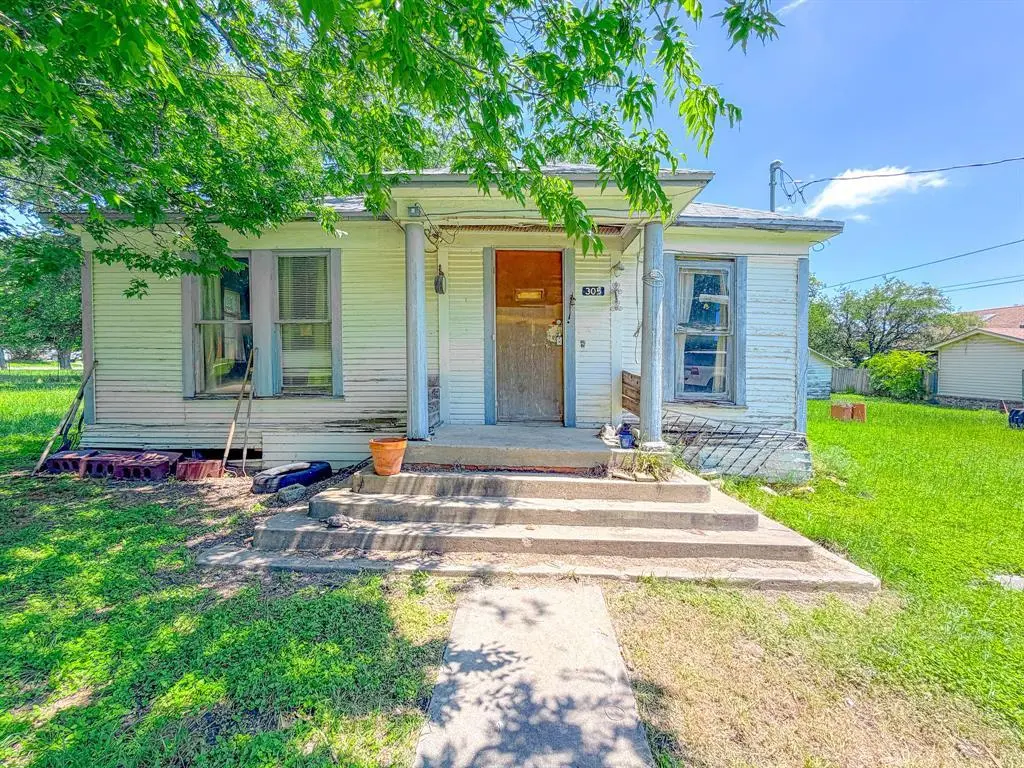
305 N 3rd St · Coolidge, TX
Flood risk 1/10 · Minimal
- FEMA flood zone
- X (unshaded)
- Chance of flooding over 30 yrs
- 0.0%
- Est. flood insurance / yr
- $507 – $1,088
Fire risk 6/10 · Moderate
- Est. fire insurance / yr
- $1,222 – $2,270
Heat risk 7/10 · Major
- Hot days now (above 109°F)
- 7 days/yr
- Hot days in 30 yrs
- 22 days/yr
Wind risk 6/10 · Moderate
- Chance of severe wind over 30 yrs
- 67.0%
Air-quality risk 2/10 · Minimal
- Unhealthy air days now
- 0 days/yr
- Unhealthy air days in 30 yrs
- 1 days/yr
Risk factors via First Street. Map © Google.
Why this score? — see what drove the B+ grade
The composite is a weighted blend of 9 inputs, each scored 0–100. Each bar is that input's sub-score; the figure is the points it added to the 100-point composite (weight × sub-score).
- Cash flow +30.0/30.0
- 1% rule +10.0/10.0
- DSCR +10.0/10.0
- ARV discount +7.5/15.0
- Appreciation +5.6/10.0
- Schools +4.3/10.0
- Livability +3.1/5.0
- Rent growth +2.5/5.0
- Condition / age +2.5/5.0
$85,000
🖨 Deal sheet 📄 Offer letter ✓ Due diligence
Listing remarks
This spacious 5-bedroom, 1 bath home is a fantastic investment opportunity full of potential. Situated on a very nice lot with beautiful, mature trees, the property offers both charm and a peaceful setting. With generous square footage and a flexible layout, this home is ready for your vision and creativity to bring it back to life. Whether you’re looking to renovate and flip, create a rental property, or design your dream home, the possibilities here are endless. Featuring ample room for expansion or reconfiguration. Bring your ideas and bring this property back to life. Information is deemed reliable but not guaranteed. Buyer and buyer's agent are responsible for verifying all infor
Key facts
- 0.48 acre lot
- Built 1946
- Listed 43 days
Property features AI
Finance
- Other: Listing is active and offered with exclusive right to sell; Possession at closing/funding; Special listing conditions: Standard
- Financial info: Listing terms: Cash; Loan type: Treat as clear; No second mortgage indicated; Multi-parcel property
- HOA & community: No homeowner association
Exterior
- Parking: Open parking
- Security: Security features: Unknown
- Utilities: City water; City sewer; Not in a municipal utility district
- Home design: Single-family residence; Residential property; Attached (property indicated as attached); Built in 1946; Facing direction: Unknown
- Construction: Wood construction; Composition roof; Pillar/post/pier foundation
- Exterior features: Few trees on the lot; Gravel road access; Property may be subdivided
Interior
- Kitchen: Other appliances
- Bedrooms: Five bedrooms (primary bedroom on main level)
- Flooring: Vinyl flooring; Wood flooring
- Bathrooms: One full bathroom
- Heating & cooling: Attic fan; Ceiling fan(s); Wall/window unit(s); Floor furnace; Natural gas heating
- Interior features: One-level layout; Two rooms (per listed room count); Other interior features
- Laundry & utility: Utility room
Neighborhood map
What this means for you Summary
Snapshot
- This is a 5-bed/1.0-bath single-family listed at $85k.
Deal economics
- At list price, monthly cash flow is $533 ($6k/yr) — positive.
- The deal already cash-flows at list — no discount required.
- Meets the 1% rule at list price ($1k rent vs $85k).
- Recommended offer: $82k (3.0% below list) — sets the bar for market timing.
Location & tenants
- Location reads 62/100 on livability (#904 in TX) — a middle-class / working-renter tenant base. Strengths: cost of living A+, housing A+, crime B+; Watch: amenities F, commute F, employment D-.
- Coolidge ISD (rural): math 55% / reading 45% proficiency, ranked #407 of 1,141 in TX (top 36%) — acceptable for families but not a draw, mixed tenant base, ~2y average lease; 77% free/reduced lunch — lower-income household profile, screen leases tightly.
- Zoned schools: Coolidge El (math 64% / reading 44%, grade C, #621 of 4,322 statewide, top 15%, 155 students, 73% FRL) — zoned schools at 73% FRL track the district average.
- Market conditions: 45 active listings in the ZIP; 17 units permitted in Limestone County in 2024 (0 in 5+ unit buildings).
Forward outlook
- In year one you build about $2k of equity ($588 loan paydown + $978 appreciation (1.1% local appreciation)).
- Limestone County population projected to shrink 4% by 2050 — rents likely to lag national; underwrite the cash flow, not the appreciation.
- At projected returns (1.1% appreciation + 3.0% rent growth), your $24k cash investment doubles in ~3 years — after that, you're playing with house money.
Negotiation context
- It's been on market 43 days — a 3% lower offer ($82k) is reasonable based on typical stale-listing flexibility.
Risks & watch-outs
- Watch-outs: built in 1946 — expect roof / HVAC / electrical / plumbing capex.
- Climate carrying-cost: major wind risk, 67% chance of damaging wind over 30y; major wildfire risk; extreme-heat days projected 7→22/yr by 2055 (HVAC capex compounding) — expect insurance premiums to compound above CPI over the hold.
Questions for the listing agent
- It's been on market 43 days. Have you received any prior offers? Is the seller open to a 3% concession, seller financing, or rate buy-down credit?
- Built in 1946 — when were the roof, HVAC, electrical panel, plumbing, and water heater last replaced?
- Is there a deadline driving the sale (1031 exchange, divorce, estate, relocation)? That informs how much negotiation room exists.
- Schools are D-rated, which usually means shorter tenancies and higher turnover. Who's the typical renter profile here, and what's been the actual vacancy rate?
- What's the average days-on-market for RENTAL listings here right now (not sales)? A rising rental-DOM trend means longer vacancies and softer asking-rent achievability than the comps imply.
- What's the recent tenant-quality profile in this submarket — average credit score on applications, eviction rate, late-payment / NSF rate, and stable-employment percentage? A property-management company in the area should have these aggregated.
- How much new for-sale + rental construction is in the pipeline within 1–3 miles? Heavy new supply typically softens prices + rents 12–24 months out; constrained supply supports both.
Investment metrics
- 1% rule
- 1.58% ✓
- Cap rate
- 13.81%
- Cash-on-cash
- 26.86%
- DSCR
- 2.19
- GRM
- 5.3
CMA / ARV
No comps found within radius.
Projected returns pro-forma
1.15% appreciation · 3.0% rent growth · sell at horizon
- IRR
- 29.4%
- Equity multiple
- 2.52×
- Total profit
- $36,126
- Equity at exit
- $29,685
- IRR
- 31.7%
- Equity multiple
- 4.86×
- Total profit
- $91,817
- Equity at exit
- $39,970
Cash invested: $23,800 (down + closing). Projections, not guarantees.
Landlord ↔ Tenant lean methodology
- Overall (STATE)
- 87 Strongly Landlord-Friendly
- State Texas
- 87 Strongly Landlord-Friendly · R+5
- County
- — inherits STATE
- City
- — inherits STATE
ZIP-level market 76693
- Home prices YoY
- 0.7%
- Active inventory
- 45
- Price-to-rent
- 5.3×
Monthly cashflow live
- Estimated rent
- $1,344 medium interval (Pro) →
- Mortgage (P&I)
- −$446
- Tax from tax record
- −$48 /mo · $578/yr
- Insurance
- −$35
- HOA
- −$0
- Vacancy / Maint / Mgmt
- −$282
- Net cashflow
- $533
Break-even live
UW: 25.0% down · 7.5% · 30yr · 1.5% tax · 5.0% vac · 8.0% maint · 8.0% mgmt
Financing live
Cash to close
- Down payment
- $21,250
- Closing costs
- $2,550
- Reserves months
- —
- Total cash needed
- —
Loan-product check · same deal, 3 products live
Conventional
25% down · 7.5% · 30yr
- Down + closing
- —
- Monthly P&I
- —
- Monthly cashflow
- —
- DSCR
- —
- Eligible?
- —
Personal DTI + credit; lowest rate.
DSCR
20% down · 8.5% · 30yr
- Down + closing
- —
- Monthly P&I
- —
- Monthly cashflow
- —
- DSCR
- —
- Eligible?
- —
No personal income docs; deal must DSCR.
Hard money
10% down · 12.0% · 12mo
- Down + closing
- —
- Monthly P&I
- —
- Monthly cashflow
- —
- DSCR
- —
- Eligible?
- —
Short-term bridge; refi at stabilization.
Listing history 16 events
-
2026-06-18days on market $85,000 Active 43 DOM
-
2026-06-17days on market $85,000 Active 42 DOM
-
2026-06-16days on market $85,000 Active 41 DOM
-
2026-06-15days on market $85,000 Active 40 DOM
-
2026-06-13days on market $85,000 Active 38 DOM
-
2026-06-12days on market $85,000 Active 37 DOM
-
2026-06-09days on market $85,000 Active 34 DOM
-
2026-06-08days on market $85,000 Active 33 DOM
-
2026-06-08days on market $85,000 Active 32 DOM
-
2026-06-05days on market $85,000 Active 30 DOM
-
2026-06-03days on market $85,000 Active 28 DOM
-
2026-06-02days on market $85,000 Active 27 DOM
-
2026-06-01days on market $85,000 Active 26 DOM
-
2026-05-31days on market $85,000 Active 25 DOM
-
2026-05-06$85,000 Active 831-char remark
-
2000-03-09soldstatus
ⓘ Source: listings_history table (triggers on properties + properties_extension) + one-shot
backfill from property_details.listing_events for pre-trigger history.
Tax reassessment forecast TX · Resets to sale price
- Current annual tax
- $578 · $48/mo
- Projected year-2 tax
- $1,556 · $130/mo
- Expected delta
- +$977/yr (+$81/mo · 168.9%)
ⓘ Screening estimate from a state-policy table — verify with the county assessor before closing.
Climate risk First Street
- Flood 1/10 Low FEMA zone X (unshaded) · 0% chance over 30 yrs
- Wildfire 6/10 Major
- Heat 7/10 Severe 7 d/yr ≥109°F today · 22 d/yr by 30 yrs out
- Wind 6/10 Major 67% chance of damaging wind over 30 yrs
- Air quality 2/10 Low 0 unhealthy d/yr today · 1 by 30 yrs out
Nearby sold comps map
Loading sold comps map…
Walkable amenities ~0.75 mi
Loading nearby amenities…
Taxation est. · year 1
- Rental income
- $16,132
- − Mortgage interest
- −$4,761
- − Property taxes
- −$578
- − Insurance
- −$425
- − Repairs & maintenance
- −$1,291
- − Management
- −$1,291
- − Depreciation
- −$2,473
- Taxable income
- $5,313
- Est. tax owed @ 24.0%
- −$1,275
- After-tax cash flow
- $5,117/yr
For passive investors: Depreciation is non-cash, so a rental often shows a tax loss while cash-flowing — sheltering income. Rental losses are passive: they offset passive income freely, and up to $25,000/yr can offset ordinary (W-2) income if you actively participate and your MAGI is under $100k (phasing out to $0 by $150k); unused losses carry forward. On sale, claimed depreciation is recaptured at up to 25%, and gains may owe capital-gains tax (a 1031 exchange can defer both). Figures are a year-1 estimate at your 24.0% rate — not tax advice; consult a CPA.
Schools (NCES district)
- District
- Coolidge ISD
- NCES district ID
- 4815120
- Math proficiency
- 55% ▼ -5.00%
- Reading proficiency
- 45% ▬ 0.00%
- Median HH income
- $35,923
- Composite
- 43.48/100
- National rank
- #6464
- State rank
- #407 of 1141 in TX
Livability — Coolidge
- Score
- 62/100
- State rank
- #904
- US rank
- #16198
Category grades
Schools grade is shown separately in the Schools card above.
Census & demographics
- Census place
- Coolidge, TX
- Population (ZIP)
- 1,966
Population outlook (Limestone County) Hauer SSP2
- Today (2025)
- 23,396 people
- By 2030
- 23,214 · -0.8%
- By 2040
- 22,829 · -2.4%
- By 2050
- 22,516 · -3.8%
- By 2075
- 22,088 · -5.6%
- By 2100
- 20,354 · -13.0%
Race, ethnicity, and origin ACS 2023
- Neighborhood character
- Diverse neighborhood (Simpson 0.62)
- Race & ethnicity
- White 56% Two or more races 19% Hispanic / Latino 18% Black 17%
- Hispanic origin (detail)
- Mexican 17%
- Common ancestry
- Lithuanian 13% Serbian 6% Slovak 6%
- Foreign-born
- 4% · Canada
- Languages at home
- 92% English-only · Spanish 8%
Political lean MEDSL · Limestone
- 2024 margin
- Solid R (+56.9) · D 21.2% · R 78.1%
- 2008→2024 swing
- -23.4pp toward R · 2008: -33.5pp · 2024: -56.9pp
- All cycles
- 2024: R+56.9 2020: R+50.3 2016: R+52.3 2012: R+40.7 2008: R+33.5
Not yet ingested
- Civics
- —
Market trends
- HPI YoY
- ▲ 1.15%
- Current HPI
- 173.19
- Rent YoY
- —
- Metro
- —
- State GDP YoY
- ▲ 3.95%
- F500 in state
- 110
Industry mix (Fortune 500 HQ in TX)
| Industry | F500 HQs | Revenue |
|---|---|---|
| Energy | 16 | $1,198B |
|
||
| Technology | 5 | $198B |
|
||
| Engineering / Construction | 4 | $72B |
|
||
| Energy Services | 3 | $60B |
|
||
| Utilities | 3 | $41B |
|
||
| Healthcare | 2 | $330B |
|
||
Price history
2 events — show timeline
- 2026-05-06 Listed $85,000 NTREIS
- 2000-03-09 Sold (Public Records) — Public Records
Property tax history
-1.4%/yrLatest (2025): $578 · +10.1% YoY. Source: county tax records.
Cash-flow waterfall
monthlySold comps — $/sqft
last 12 mo · ≤1 miLoading sold comps…