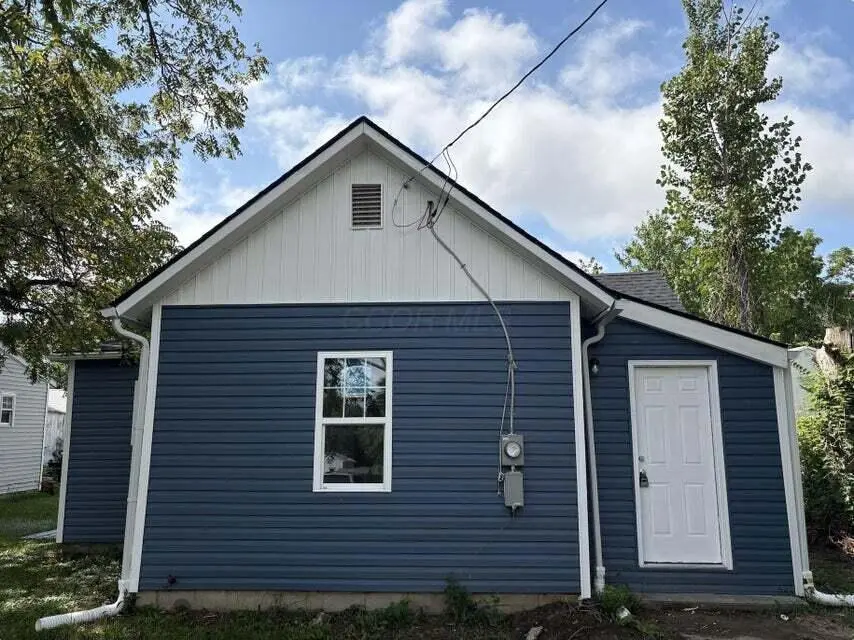
197 Harrison St · Marion, OH
Flood risk 1/10 · Minimal
- FEMA flood zone
- X (unshaded)
- Chance of flooding over 30 yrs
- 0.0%
- Est. flood insurance / yr
- $473 – $860
Fire risk 1/10 · Minimal
- Est. fire insurance / yr
- $713 – $1,323
Heat risk 3/10 · Minor
- Hot days now (above 100°F)
- 7 days/yr
- Hot days in 30 yrs
- 17 days/yr
Wind risk 2/10 · Minimal
- Chance of severe wind over 30 yrs
- —
Air-quality risk 2/10 · Minimal
- Unhealthy air days now
- 1 days/yr
- Unhealthy air days in 30 yrs
- 1 days/yr
Risk factors via First Street. Map © Google.
Why this score? — see what drove the C grade
The composite is a weighted blend of 9 inputs, each scored 0–100. Each bar is that input's sub-score; the figure is the points it added to the 100-point composite (weight × sub-score).
- Cash flow +21.5/30.0
- ARV discount +13.4/15.0
- DSCR +6.9/10.0
- 1% rule +4.3/10.0
- Livability +3.2/5.0
- Rent growth +2.5/5.0
- Condition / age +2.5/5.0
- Schools +2.2/10.0
- Appreciation +0.0/10.0
$111,900
🖨 Deal sheet (PDF) 📄 Offer letter ✓ Due diligence
Listing remarks MLS
Welcome to this beautifully renovated 2-bedroom, 1-bath ranch-style home located just steps from the Marion County Fairgrounds! This charming home offers convenience, comfort, and modern updates throughout. Enjoy peace of mind with a brand-new roof, furnace, AC, and water heater—all recently installed as part of a full renovation. The updated interior features a spacious layout, refreshed finishes, and a bright, functional kitchen perfect for everyday living.
Key facts
- New furnace
- New water heater
- Updated interior
Tags
Neighborhood map
What this means for you Summary
Snapshot
- This is a 1-bed/1.0-bath single-family listed at $112k.
Deal economics
- At list price, monthly cash flow is $169 ($2k/yr) — positive.
- The deal already cash-flows at list — no discount required.
- To meet the 1% rule (rent ≥ 1% of price), the offer needs to be $104k (6.8% below list).
- Recommended offer: $104k (6.8% below list) — sets the bar for 1% rule.
Location & tenants
- Location reads 65/100 on livability (#704 in OH) — a middle-class / working-renter tenant base. Strengths: cost of living A+, housing A+; Watch: schools D+, crime D+, amenities F.
- Marion City (town): math 22% / reading 31% proficiency, ranked #600 of 656 in OH (top 92%) — low school quality limits family demand, transient renter base, plan for 1-2y turnover; 67% free/reduced lunch — lower-income household profile, screen leases tightly.
- Market conditions: 210 active listings in the ZIP; 1 comparable units currently listed for rent nearby; 53 units permitted in Marion County in 2024 (0 in 5+ unit buildings).
Forward outlook
- Local home prices are declining (-3.0%/yr); year-one equity from $774 of loan paydown is wiped out by about $3k of value loss. Plan a longer hold.
- Marion County population projected at -18% by 2050 — secular population decline; favor cash flow + early exit over multi-decade hold.
Negotiation context
- It's been on market 80 days — a 6% lower offer ($105k) is reasonable based on typical stale-listing flexibility.
- 5 sale attempts since 5y ago with the ask held roughly flat each time — persistent listings suggest the price (not the market) is what's stuck; bring a comps-based counter.
- Current owner paid $12k; list at $112k implies a 832% gain — meaningful room to come down on a strong offer.
Risks & watch-outs
- Watch-outs: built in 1900 — expect roof / HVAC / electrical / plumbing capex.
Questions for the listing agent
- It's been on market 80 days. Have you received any prior offers? Is the seller open to a 7% concession, seller financing, or rate buy-down credit?
- Built in 1900 — when were the roof, HVAC, electrical panel, plumbing, and water heater last replaced?
- Why hasn't it sold? Are there any deal-killer items the seller is aware of (foundation, flood, title, zoning, code violations)?
- Is there a deadline driving the sale (1031 exchange, divorce, estate, relocation)? That informs how much negotiation room exists.
- Schools are D-rated, which usually means shorter tenancies and higher turnover. Who's the typical renter profile here, and what's been the actual vacancy rate?
- Crime grade is D in this area — have there been break-ins, vandalism, or insurance claims at this property in the last 3 years? What carrier currently insures it and at what premium?
- What's the average days-on-market for RENTAL listings here right now (not sales)? A rising rental-DOM trend means longer vacancies and softer asking-rent achievability than the comps imply.
- What's the recent tenant-quality profile in this submarket — average credit score on applications, eviction rate, late-payment / NSF rate, and stable-employment percentage? A property-management company in the area should have these aggregated.
- How much new for-sale + rental construction is in the pipeline within 1–3 miles? Heavy new supply typically softens prices + rents 12–24 months out; constrained supply supports both.
Investment metrics
- 1% rule
- 0.93% ✗
- Cap rate
- 8.10%
- Cash-on-cash
- 6.47%
- DSCR
- 1.29
- GRM
- 8.9
CMA / ARV
- ARV (median comp)
- $128,899
- List price
- $111,900
- Delta
- -13.19%
- Verdict
- UNDERPRICED
- Comps
- 20 within 1.0 mi
Show comp detail 8 sales within ~0.75 mi
| Address | Dist | Beds/Ba | Sqft | Sold | Price | $/sf | Match |
|---|---|---|---|---|---|---|---|
| 279 E Fairground St | 0.14mi | 2/1.0 (+1) | 1,168 (+4%) | 2mo | $163,000 | $140 | 80 |
| 532 N Prospect St | 0.31mi | 2/1.0 (+1) | 1,056 (-6%) | 1mo | $124,900 | $118 | 70 |
| 519 Oak St | 0.40mi | 2/1.0 (+1) | 1,036 (-7%) | 13mo | $132,000 | $127 | 53 |
| 464 Ballentine Ave | 0.38mi | 2/1.0 (+1) | 1,280 (+14%) | 5mo | $135,000 | $105 | 49 |
| 989 Robinson St | 0.63mi | 2/1.0 (+1) | 1,008 (-10%) | 14mo | $153,900 | $153 | 37 |
| 492 N Prospect St | 0.36mi | 2/1.0 (+1) | 972 (-13%) | 23mo | $60,000 | $62 | 37 |
| 236 Silver St | 0.63mi | 2/1.0 (+1) | 1,272 (+14%) | 8mo | $70,000 | $55 | 37 |
| 748 Robinson St | 0.62mi | 2/1.0 (+1) | 1,024 (-8%) | 21mo | $150,000 | $146 | 34 |
Match score weights: distance 35% · size 25% · config 20% · recency 20%. Top-matched comps best support the ARV.
Projected returns pro-forma
-3.0% appreciation · 3.0% rent growth · sell at horizon
- IRR
- -6.4%
- Equity multiple
- 0.76×
- Total profit
- $-7,434
- Equity at exit
- $16,685
- IRR
- 3.2%
- Equity multiple
- 1.23×
- Total profit
- $7,143
- Equity at exit
- $9,675
Cash invested: $31,332 (down + closing). Projections, not guarantees.
Landlord ↔ Tenant lean methodology
- Overall (STATE)
- 73 Landlord-Friendly
- State Ohio
- 73 Landlord-Friendly · R+6
- County
- — inherits STATE
- City
- — inherits STATE
ZIP-level market 43302
- Home prices YoY
- -33.9%
- Active inventory
- 210
- Price-to-rent
- 8.9×
Monthly cashflow live
- Estimated rent
- $1,042 medium interval (Pro) →
- Mortgage (P&I)
- −$587
- Tax from tax record
- −$21 /mo · $255/yr
- Insurance
- −$47
- HOA
- −$0
- Vacancy / Maint / Mgmt
- −$219
- Net cashflow
- $169
Break-even live
Sensitivity live
| Price | -10% $232 | -5% $201 | +0% $169 | +5% $137 | +10% $106 |
|---|---|---|---|---|---|
| Rent | -10% $87 | -5% $128 | +0% $169 | +5% $210 | +10% $251 |
| Rate | -1.0pp $225 | -0.5pp $197 | base $169 | +0.5pp $140 | +1.0pp $110 |
UW: 25.0% down · 7.5% · 30yr · 1.5% tax · 5.0% vac · 8.0% maint · 8.0% mgmt
Financing live
Cash to close
- Down payment
- $27,975
- Closing costs
- $3,357
- Reserves months
- —
- Total cash needed
- —
Loan-product check · same deal, 3 products live
Conventional
25% down · 7.5% · 30yr
- Down + closing
- —
- Monthly P&I
- —
- Monthly cashflow
- —
- DSCR
- —
- Eligible?
- —
Personal DTI + credit; lowest rate.
DSCR
20% down · 8.5% · 30yr
- Down + closing
- —
- Monthly P&I
- —
- Monthly cashflow
- —
- DSCR
- —
- Eligible?
- —
No personal income docs; deal must DSCR.
Hard money
10% down · 12.0% · 12mo
- Down + closing
- —
- Monthly P&I
- —
- Monthly cashflow
- —
- DSCR
- —
- Eligible?
- —
Short-term bridge; refi at stabilization.
Rent comps 1 comps
| Address | Beds | Baths | Sqft | Rent | $/sqft | DOM | Units | Dist |
|---|---|---|---|---|---|---|---|---|
| 133 Garden St Unit 131 Marion, OH | 2.0 | 1.0 | 752 | $900 | $1.20 | 44d | 1 | 1.01mi |
Listing history 35 events
-
2026-06-19days on market $111,900 Active 80 DOM
-
2026-06-18days on market $111,900 Active 79 DOM
-
2026-06-17days on market $111,900 Active 78 DOM
-
2026-06-16days on market $111,900 Active 77 DOM
-
2026-06-15days on market $111,900 Active 76 DOM
-
2026-06-14days on market $111,900 Active 74 DOM
-
2026-06-12days on market $111,900 Active 73 DOM
-
2026-06-09days on market $111,900 Active 70 DOM
-
2026-06-08days on market $111,900 Active 69 DOM
-
2026-06-07pricedays on market $111,900 Active 68 DOM
-
2026-06-05days on market $114,000 Active 65 DOM
-
2026-06-03days on market $114,000 Active 64 DOM
-
2026-06-02days on market $114,000 Active 63 DOM
-
2026-06-01days on market $114,000 Active 62 DOM
-
2026-05-31days on market $114,000 Active 61 DOM
-
2026-05-30days on market $114,000 Active 60 DOM
-
2026-03-31$114,000 Active 469-char remark
Show marketing remark (469 chars)
Welcome to this beautifully renovated 2-bedroom, 1-bath ranch-style home located just steps from the Marion County Fairgrounds! This charming home offers convenience, comfort, and modern updates throughout. Enjoy peace of mind with a brand-new roof, furnace, AC, and water heater—all recently installed as part of a full renovation. The updated interior features a spacious layout, refreshed finishes, and a bright, functional kitchen perfect for everyday living.
-
2026-03-24historical
-
2026-01-02price $114,000
-
2026-01-02status Active
-
2026-01-01historical
-
2025-09-09price $119,000
-
2025-08-28price $124,000
-
2025-08-20price $129,000
-
2025-08-13price $139,900
-
2025-08-04price $149,900
-
2025-07-28$169,900 Active
-
2025-07-26historical
-
2022-06-10soldstatus $12,000 Closed
-
2022-05-31status Pending
-
2022-05-14$14,900 Active
-
2022-02-14historical
-
2022-01-27price $14,900
-
2021-12-17price $19,900
-
2021-11-15$27,900 Active
ⓘ Source: listings_history table (triggers on properties + properties_extension) + one-shot
backfill from property_details.listing_events for pre-trigger history.
Tax reassessment forecast OH · Partial reset (capped growth)
- Current annual tax
- $255 · $21/mo
- Projected year-2 tax
- $1,000 · $83/mo
- Expected delta
- +$746/yr (+$62/mo · 292.8%)
ⓘ Screening estimate from a state-policy table — verify with the county assessor before closing.
Climate risk First Street
- Flood 1/10 Low FEMA zone X (unshaded) · 0% chance over 30 yrs
- Wildfire 1/10 Low
- Heat 3/10 Moderate 7 d/yr ≥100°F today · 17 d/yr by 30 yrs out
- Wind 2/10 Low
- Air quality 2/10 Low 1 unhealthy d/yr today · 1 by 30 yrs out
Nearby sold comps map
Loading sold comps map…
Walkable amenities ~0.75 mi
Loading nearby amenities…
Taxation est. · year 1
- Rental income
- $12,509
- − Mortgage interest
- −$6,268
- − Property taxes
- −$255
- − Insurance
- −$560
- − Repairs & maintenance
- −$1,001
- − Management
- −$1,001
- − Depreciation
- −$3,255
- Taxable income
- $170
- Est. tax owed @ 24.0%
- −$41
- After-tax cash flow
- $1,986/yr
For passive investors: Depreciation is non-cash, so a rental often shows a tax loss while cash-flowing — sheltering income. Rental losses are passive: they offset passive income freely, and up to $25,000/yr can offset ordinary (W-2) income if you actively participate and your MAGI is under $100k (phasing out to $0 by $150k); unused losses carry forward. On sale, claimed depreciation is recaptured at up to 25%, and gains may owe capital-gains tax (a 1031 exchange can defer both). Figures are a year-1 estimate at your 24.0% rate — not tax advice; consult a CPA.
Schools (NCES district)
- District
- Marion City
- NCES district ID
- 3904433
- Math proficiency
- 22% ▼ -17.00%
- Reading proficiency
- 31% ▼ -8.00%
- Median HH income
- $32,327
- Composite
- 21.58/100
- National rank
- #8306
- State rank
- #600 of 656 in OH
Livability — Marion
- Score
- 65/100
- State rank
- #704
- US rank
- #12605
Category grades
Schools grade is shown separately in the Schools card above.
Census & demographics
- Census place
- Marion, OH
- County
- Marion County · 53,702 people
- City population
- 53,702
- Metro
- Marion, OH
- Population (ZIP)
- 53,702
- Household income
- $55,057
- Rent vs Own
- Severe rent burden
- 1554.0
Population outlook (Marion County) Hauer SSP2
- Today (2025)
- 62,078 people
- By 2030
- 60,049 · -3.3%
- By 2040
- 55,413 · -10.7%
- By 2050
- 50,604 · -18.5%
- By 2075
- 40,162 · -35.3%
- By 2100
- 29,105 · -53.1%
Race, ethnicity, and origin ACS 2023
- Neighborhood character
- Predominantly White (85%)
- Race & ethnicity
- White 85% Black 6% Two or more races 6% Hispanic / Latino 3%
- Common ancestry
- Slovak 2% Romanian 2% Lithuanian 2%
- Foreign-born
- 2% · Canada
- Languages at home
- 96% English-only · Spanish 2% Arabic 1%
Political lean MEDSL · Marion
- 2024 margin
- Solid R (+41.4) · D 28.9% · R 70.3%
- 2008→2024 swing
- -32.5pp toward R · 2008: -8.9pp · 2024: -41.4pp
- All cycles
- 2024: R+41.4 2020: R+38.6 2016: R+34.4 2012: R+7.6 2008: R+8.9
Not yet ingested
- Civics
- —
Market trends
- HPI YoY
- ▼ -114.52%
- Current HPI
- 223.5344
- Rent YoY
- —
- Metro
- Marion, OH
- State GDP YoY
- ▲ 1.98%
- F500 in state
- 48
Industry mix (Fortune 500 HQ in OH)
| Industry | F500 HQs | Revenue |
|---|---|---|
| Insurance | 3 | $145B |
|
||
| Industrial Machinery | 3 | $49B |
|
||
| Financial Services | 3 | $24B |
|
||
| Consumer Goods | 2 | $93B |
|
||
| Aerospace / Defense | 2 | $47B |
|
||
| Utilities | 2 | $33B |
|
||
Price history
+308.6% since first listed19 events — show timeline
- 2026-03-31 Listed $114,000 CBRMLS
- 2026-03-24 Listing Removed — CBRMLS
- 2026-01-02 Price Changed $114,000 CBRMLS
- 2026-01-02 Relisted — CBRMLS
- 2026-01-01 Listing Removed — CBRMLS
- 2025-09-09 Price Changed $119,000 CBRMLS
- 2025-08-28 Price Changed $124,000 CBRMLS
- 2025-08-20 Price Changed $129,000 CBRMLS
- 2025-08-13 Price Changed $139,900 CBRMLS
- 2025-08-04 Price Changed $149,900 CBRMLS
- 2025-07-28 Listed $169,900 CBRMLS
- 2025-07-26 Coming Soon — CBRMLS
- 2022-06-10 Sold (MLS) $12,000 CBRMLS
- 2022-05-31 Pending — CBRMLS
- 2022-05-14 Listed $14,900 CBRMLS
- 2022-02-14 Listing Removed — CBRMLS
- 2022-01-27 Price Changed $14,900 CBRMLS
- 2021-12-17 Price Changed $19,900 CBRMLS
- 2021-11-15 Listed $27,900 CBRMLS
Property tax history
+1.9%/yrLatest (2025): $255 · +0.0% YoY. Source: county tax records.
Cash-flow waterfall
monthlySold comps — $/sqft
last 12 mo · ≤1 miLoading sold comps…