379 Westwoods · Amherst, OH
Flood risk 1/10 · Minimal
- FEMA flood zone
- X (unshaded)
- Chance of flooding over 30 yrs
- 0.0%
- Est. flood insurance / yr
- $473 – $860
Fire risk 1/10 · Minimal
- Est. fire insurance / yr
- $713 – $1,323
Heat risk 3/10 · Minor
- Hot days now (above 98°F)
- 7 days/yr
- Hot days in 30 yrs
- 17 days/yr
Wind risk 1/10 · Minimal
- Chance of severe wind over 30 yrs
- —
Air-quality risk 3/10 · Minor
- Unhealthy air days now
- 3 days/yr
- Unhealthy air days in 30 yrs
- 4 days/yr
Risk factors via First Street. Map © Google.
Why this score? — see what drove the B grade
The composite is a weighted blend of 9 inputs, each scored 0–100. Each bar is that input's sub-score; the figure is the points it added to the 100-point composite (weight × sub-score).
- Cash flow +30.0/30.0
- 1% rule +10.0/10.0
- DSCR +10.0/10.0
- Schools +5.9/10.0
- ARV discount +5.7/15.0
- Livability +4.0/5.0
- Rent growth +2.5/5.0
- Condition / age +2.2/5.0
- Appreciation +0.0/10.0
$60,000
🖨 Deal sheet 📄 Offer letter ✓ Due diligence
Listing remarks MLS
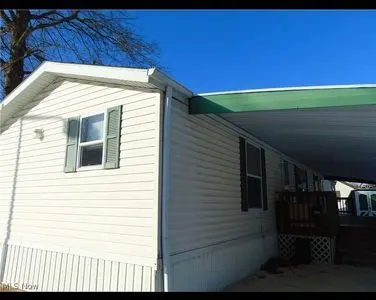
Low maintenance living can be found in this three bedroom, two full bath 60x16 Schult 2002 Manufactured home. Large kitchen offers all appliances, plenty of cabinet and countertop space, open to large living room with newer neutral color carpeting that also leads to the back bedrooms which are of nice size. Large Master bedroom has walk in closet, double doors to master bath with tub / shower, vanity, both bedroom and bath have newer vinyl plank flooring. Laundry room supplies newer washer, gas dryer and storage cabinets. Large deck with awning to relax on in the warm days of Summer, storage shed for your extras, this home is located at the end of the street so does supply a little more privacy. Range in kitchen is electric, gas is available, Hot water tank also gas approximately 2 years old. Buyers must be approved by park. Schedule your showing today.
Key facts
- Large deck
- Large kitchen
- Storage shed
Tags
Neighborhood map
What this means for you Summary
Snapshot
- This is a 3-bed/2.0-bath single-family listed at $60k. Condition is rated fair.
Deal economics
- At list price, monthly cash flow is $1k ($13k/yr) — positive.
- The deal already cash-flows at list — no discount required.
- Meets the 1% rule at list price ($2k rent vs $60k).
- Cap rate 27.6% vs local median 3.9% in Amherst — top-decile yield for the area; either an underpriced asset or a hidden risk that comps aren't pricing in. Stress-test before assuming the spread holds.
Location & tenants
- Location reads 81/100 on livability (#100 in OH, #1,523 nationally) — a professional / high-income tenant draw. Strengths: schools A+, cost of living A+, housing A+; Watch: amenities D-, commute F.
- Amherst Exempted Village (suburban): math 66% / reading 69% proficiency, ranked #160 of 656 in OH (top 24%) — acceptable for families but not a draw, mixed tenant base, ~2y average lease; only 18% free/reduced lunch — higher-income household profile.
- Market conditions: 116 active listings in the ZIP; 1 comparable units currently listed for rent nearby; solid renter incomes; 1,098 units permitted in Lorain County in 2024 (20 in 5+ unit buildings).
Forward outlook
- Local home prices are declining (-3.0%/yr); year-one equity from $415 of loan paydown is wiped out by about $2k of value loss. Plan a longer hold.
- At projected returns (-3.0% appreciation + 3.0% rent growth), your $17k cash investment doubles in ~2 years — after that, you're playing with house money.
Negotiation context
- Only 12 days on market — expect competitive offers; lowballing is unlikely to land.
- 2 sale attempts since 4y ago with the ask held roughly flat each time — persistent listings suggest the price (not the market) is what's stuck; bring a comps-based counter.
- Current owner paid $34k; list at $60k implies a 79% gain — meaningful room to come down on a strong offer.
Questions for the listing agent
- Have any recent inspections been done? Can we get a copy of the seller's disclosures and any deferred-maintenance estimates?
- Is there a deadline driving the sale (1031 exchange, divorce, estate, relocation)? That informs how much negotiation room exists.
- Schools are A-rated — typically a magnet for longer-tenancy family renters. What's the average tenant stay here, and is there a school-zone premium baked into asking?
- What's the average days-on-market for RENTAL listings here right now (not sales)? A rising rental-DOM trend means longer vacancies and softer asking-rent achievability than the comps imply.
- What's the recent tenant-quality profile in this submarket — average credit score on applications, eviction rate, late-payment / NSF rate, and stable-employment percentage? A property-management company in the area should have these aggregated.
- How much new for-sale + rental construction is in the pipeline within 1–3 miles? Heavy new supply typically softens prices + rents 12–24 months out; constrained supply supports both.
Investment metrics
- 1% rule
- 3.12% ✓
- Cap rate
- 27.59%
- Cash-on-cash
- 76.07%
- DSCR
- 4.38
- GRM
- 2.7
CMA / ARV
- ARV (on-the-fly)
- $57,664
- Comps found
- 5
Show comp detail 5 sales within ~0.75 mi
| Address | Dist | Beds/Ba | Sqft | Sold | Price | $/sf | Match |
|---|---|---|---|---|---|---|---|
| 311 Westwoods #311 | 0.13mi | 3/2.0 | 1,080 (-1%) | 6mo | $57,500 | $53 | 87 |
| 210 Westwoods | 0.13mi | 2/2.0 (-1) | 992 (-9%) | 6mo | $30,000 | $30 | 69 |
| 216 Westwoods Lot 216 | 0.26mi | 2/1.0 (-1) | 952 (-12%) | 1mo | $19,500 | $20 | 57 |
| 459 S Lake St | 0.54mi | 2/1.0 (-1) | 1,092 (+0%) | 14mo | $165,500 | $152 | 54 |
| 632 S Lake St | 0.48mi | 4/3.0 (+1) | 975 (-10%) | 18mo | $267,000 | $274 | 36 |
Match score weights: distance 35% · size 25% · config 20% · recency 20%. Top-matched comps best support the ARV.
Projected returns pro-forma
-3.0% appreciation · 3.0% rent growth · sell at horizon
- IRR
- 76.0%
- Equity multiple
- 4.46×
- Total profit
- $58,138
- Equity at exit
- $8,946
- IRR
- 79.7%
- Equity multiple
- 9.22×
- Total profit
- $138,084
- Equity at exit
- $5,188
Cash invested: $16,800 (down + closing). Projections, not guarantees.
Landlord ↔ Tenant lean methodology
- Overall (STATE)
- 73 Landlord-Friendly
- State Ohio
- 73 Landlord-Friendly · R+6
- County
- — inherits STATE
- City
- — inherits STATE
ZIP-level market 44001
- Active inventory
- 116
- Price-to-rent
- 2.7×
Monthly cashflow live
- Estimated rent
- $1,873 medium interval (Pro) →
- Mortgage (P&I)
- −$315
- Tax est. 1.5%
- −$75 /mo · $900/yr
- Insurance
- −$25
- HOA
- −$0
- Vacancy / Maint / Mgmt
- −$393
- Net cashflow
- $1,065
Break-even live
UW: 25.0% down · 7.5% · 30yr · 1.5% tax · 5.0% vac · 8.0% maint · 8.0% mgmt
Financing live
Cash to close
- Down payment
- $15,000
- Closing costs
- $1,800
- Reserves months
- —
- Total cash needed
- —
Loan-product check · same deal, 3 products live
Conventional
25% down · 7.5% · 30yr
- Down + closing
- —
- Monthly P&I
- —
- Monthly cashflow
- —
- DSCR
- —
- Eligible?
- —
Personal DTI + credit; lowest rate.
DSCR
20% down · 8.5% · 30yr
- Down + closing
- —
- Monthly P&I
- —
- Monthly cashflow
- —
- DSCR
- —
- Eligible?
- —
No personal income docs; deal must DSCR.
Hard money
10% down · 12.0% · 12mo
- Down + closing
- —
- Monthly P&I
- —
- Monthly cashflow
- —
- DSCR
- —
- Eligible?
- —
Short-term bridge; refi at stabilization.
Rent comps 1 comps
| Address | Beds | Baths | Sqft | Rent | $/sqft | DOM | Units | Dist |
|---|---|---|---|---|---|---|---|---|
| 275 Cornell Ave Amherst, OH | 3.0 | 1.5 | 1201 | $1,873 | $1.56 | 7d | 1 | 1.46mi |
Listing history 10 events
-
2026-06-18days on market $60,000 Active 12 DOM
-
2026-06-17days on market $60,000 Active 11 DOM
-
2026-06-16days on market $60,000 Active 10 DOM
-
2026-06-15days on market $60,000 Active 9 DOM
-
2026-06-13days on market $60,000 Active 7 DOM
-
2026-06-13days on market $60,000 Active 6 DOM
-
2026-06-09days on market $60,000 Active 3 DOM
-
2026-06-08days on market $60,000 Active 2 DOM
-
2026-06-07remarks 699-char remark
-
2026-06-07$60,000 Active 1 DOM
ⓘ Source: listings_history table (triggers on properties + properties_extension) + one-shot
backfill from property_details.listing_events for pre-trigger history.
Climate risk First Street
- Flood 1/10 Low FEMA zone X (unshaded) · 0% chance over 30 yrs
- Wildfire 1/10 Low
- Heat 3/10 Moderate 7 d/yr ≥98°F today · 17 d/yr by 30 yrs out
- Wind 1/10 Low
- Air quality 3/10 Moderate 3 unhealthy d/yr today · 4 by 30 yrs out
Nearby sold comps map
Loading sold comps map…
Walkable amenities ~0.75 mi
Loading nearby amenities…
Taxation est. · year 1
- Rental income
- $22,476
- − Mortgage interest
- −$3,361
- − Property taxes
- −$900
- − Insurance
- −$300
- − Repairs & maintenance
- −$1,798
- − Management
- −$1,798
- − Depreciation
- −$1,745
- Taxable income
- $12,573
- Est. tax owed @ 24.0%
- −$3,018
- After-tax cash flow
- $9,763/yr
For passive investors: Depreciation is non-cash, so a rental often shows a tax loss while cash-flowing — sheltering income. Rental losses are passive: they offset passive income freely, and up to $25,000/yr can offset ordinary (W-2) income if you actively participate and your MAGI is under $100k (phasing out to $0 by $150k); unused losses carry forward. On sale, claimed depreciation is recaptured at up to 25%, and gains may owe capital-gains tax (a 1031 exchange can defer both). Figures are a year-1 estimate at your 24.0% rate — not tax advice; consult a CPA.
Condition & rehab AI · 2 photos
This manufactured home requires moderate repairs to its exterior and roof, but has good interior and systems. Painting and roof repair would significantly increase its resale and rental value.
Repairs flagged
- Major siding and paint — Severe weathering and peeling
- Moderate roof — Siding condition suggests potential water damage
Value-add opportunities
- Both painting and repainting the siding — Enhances curb appeal and value
- Both roof repair — Prevents water damage and extends home life
Renovation cost estimate screening
| Repair item | Severity | Est. cost |
|---|---|---|
| siding and paint · Severe weathering and peeling | Major | $15,000–50,000 |
| roof · Siding condition suggests potential water damage | Moderate | $3,000–15,000 |
| Total estimated repair cost · 2 items | $18,000–65,000 |
Value-add ROI direction
- Both painting and repainting the siding — Enhances curb appeal and value ↑
- Both roof repair — Prevents water damage and extends home life ↑
ⓘ Cost ranges are severity-bucket heuristics (US national rule-of-thumb). Get contractor quotes + a written scope before underwriting a rehab budget.
Schools (NCES district)
- District
- Amherst Exempted Village
- NCES district ID
- 3904519
- Math proficiency
- 66% ▼ -15.00%
- Reading proficiency
- 69% ▼ -11.00%
- Median HH income
- $63,459
- Composite
- 58.58/100
- National rank
- #988
- State rank
- #160 of 656 in OH
Livability — Amherst
- Score
- 81/100
- State rank
- #100
- US rank
- #1523
Category grades
Schools grade is shown separately in the Schools card above.
Census & demographics
- County
- Lorain · 305,041 people
- Metro
- Cleveland, OH
- Population (ZIP)
- 21,123
- Household income
- $91,050
- Rent vs Own
- Severe rent burden
- 11.6
Population outlook (Lorain County) Hauer SSP2
- Today (2025)
- 314,924 people
- By 2030
- 317,546 · +0.8%
- By 2040
- 317,962 · +1.0%
- By 2050
- 312,872 · -0.7%
- By 2075
- 301,806 · -4.2%
- By 2100
- 278,271 · -11.6%
Race, ethnicity, and origin ACS 2023
- Neighborhood character
- Predominantly White (87%)
- Race & ethnicity
- White 87% Hispanic / Latino 6% Two or more races 6% Asian 2% Black 1%
- Hispanic origin (detail)
- Mexican 2% Puerto Rican 3%
- Common ancestry
- Romanian 10% Slovak 3% Lithuanian 2%
- Foreign-born
- 3% · Canada, China
- Languages at home
- 96% English-only · Spanish 1% Chinese 1% Other Indo-European 1%
Political lean MEDSL · Lorain
- 2024 margin
- Lean R (+5.7) · D 46.7% · R 52.4%
- 2008→2024 swing
- -23.6pp toward R · 2008: 17.9pp · 2024: -5.7pp
- All cycles
- 2024: R+5.7 2020: R+2.5 2016: R+0.3 2012: D+14.4 2008: D+17.9
Not yet ingested
- Civics
- —
Market trends
- HPI YoY
- ▼ -113.43%
- Current HPI
- 194.6753
- Rent YoY
- —
- Metro
- —
- State GDP YoY
- ▲ 1.98%
- F500 in state
- 48
Industry mix (Fortune 500 HQ in OH)
| Industry | F500 HQs | Revenue |
|---|---|---|
| Insurance | 3 | $145B |
|
||
| Industrial Machinery | 3 | $49B |
|
||
| Financial Services | 3 | $24B |
|
||
| Consumer Goods | 2 | $93B |
|
||
| Aerospace / Defense | 2 | $47B |
|
||
| Utilities | 2 | $33B |
|
||
Price history
+33.3% since first listed5 events — show timeline
- 2026-06-07 Listed $60,000 FSBO.com
- 2022-04-28 Sold (MLS) $33,500 MLSNOW
- 2022-04-01 Contingent — MLSNOW
- 2022-03-02 Price Changed $39,900 MLSNOW
- 2022-01-21 Listed $45,000 MLSNOW
Cash-flow waterfall
monthlySold comps — $/sqft
last 12 mo · ≤1 miLoading sold comps…