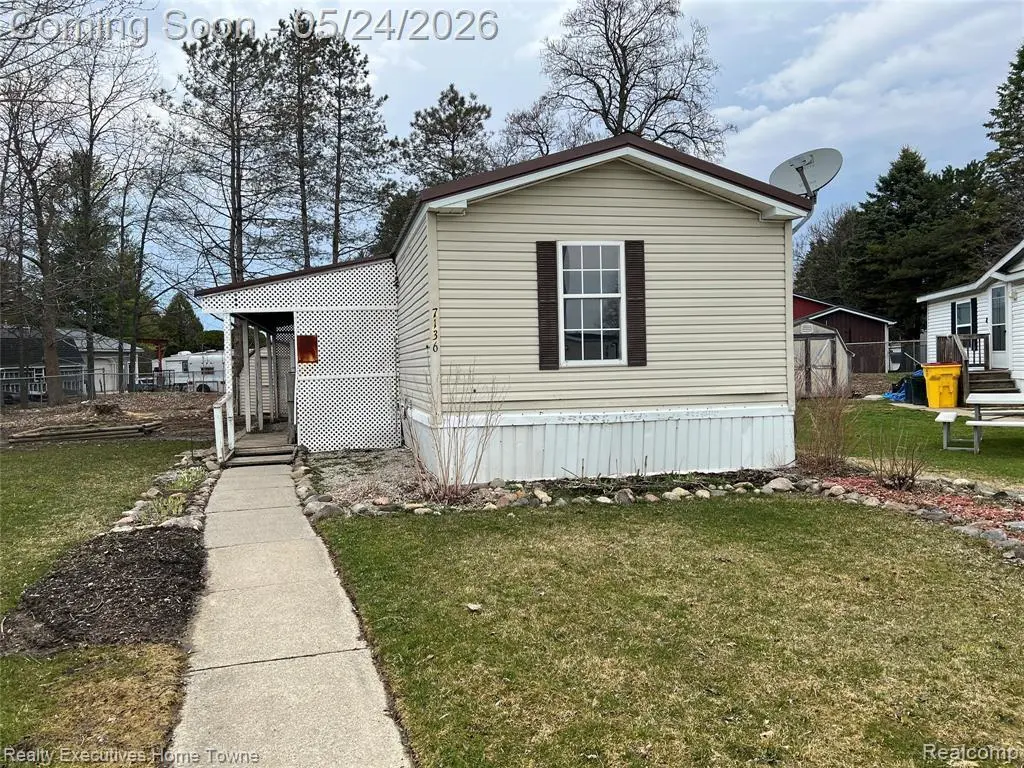
7136 Mapleview Cir W #65 · Brown City, MI
Flood risk No data
- FEMA flood zone
- —
- Chance of flooding over 30 yrs
- —
- Est. flood insurance / yr
- —
Fire risk No data
- Est. fire insurance / yr
- —
Heat risk No data
- Hot days now (above threshold)
- —
- Hot days in 30 yrs
- —
Wind risk No data
- Chance of severe wind over 30 yrs
- —
Air-quality risk No data
- Unhealthy air days now
- —
- Unhealthy air days in 30 yrs
- —
Risk factors via First Street. Map © Google.
Why this score? — see what drove the C+ grade
The composite is a weighted blend of 9 inputs, each scored 0–100. Each bar is that input's sub-score; the figure is the points it added to the 100-point composite (weight × sub-score).
- Cash flow +30.0/30.0
- 1% rule +10.0/10.0
- DSCR +10.0/10.0
- Condition / age +3.8/5.0
- Livability +3.2/5.0
- Schools +2.7/10.0
- Rent growth +2.5/5.0
- ARV discount +0.0/15.0
- Appreciation +0.0/10.0
$54,900
🖨 Deal sheet 📄 Offer letter ✓ Due diligence
Listing remarks
1992 HOLLY PARK Manufactured Home Vin # 01FR26286 on leased land in Maple-view Estates commonly know as 7136 Mapleview Circle West, # 65, Brown City, MI 48416 , on leased land in the community. . It has had recent upgrades new paint flooring and carpet, newer Furnace & Air , fresh paint, new carpeting and flooring were upgraded. Home has a large corner lot a covered entrance and a Metal roof It does not have any mineral rights included in the sale in Maple view Estates, This Home in Maple view Estates MHP is an all-family park with a community center and off-street parking, Lot Rents are currently $360 a month. Municipal water and sewers are provided and billed separately by Bro
Key facts
- 4,000 sq ft lot
- Built 1992
- Listed 15 days
Property features AI
Finance
- Financial info: Not provided
- HOA & community: Community clubhouse
Exterior
- Parking: No specific parking details provided
- Utilities: Public water; Natural gas; Electric water heater; Forced air heating
- Home design: Manufactured home in a park (MH Park); 1-story; Built in 1992; Located on leased land in Maple-view Estates (park lot)
- Construction: Vinyl siding exterior; Crawl space and piers foundation
- Exterior features: Vinyl siding; Paved street access; Frontage approximately 50 feet
Interior
- Kitchen: Kitchen (Entry level) — 8 x 10, laminate flooring; Range/Oven; Refrigerator
- Bedrooms: Bedroom 1 (Entry level) — 10 x 10, carpet; Bedroom 2 (Entry level) — 8 x 10, carpet
- Flooring: Laminate flooring in living room, dining room, kitchen, laundry, and one bathroom; Carpet in bedrooms; Other flooring in primary bathroom
- Bathrooms: 2 full bathrooms; Bathroom 1 (Entry level) — approximately 7 x 8, other flooring; Bathroom 2 (Entry level) — approximately 6 x 8, laminate flooring
- Heating & cooling: Forced air heating; Natural gas fuel; Electric water heater
- Interior features: 8 total rooms
- Laundry & utility: Laundry room (Entry level) — 8 x 5, laminate flooring
Neighborhood map
What this means for you Summary
Snapshot
- This is a 2-bed/2.0-bath single-family listed at $55k. Condition is rated good.
Deal economics
- At list price, monthly cash flow is $371 ($4k/yr) — positive.
- The deal already cash-flows at list — no discount required.
- Meets the 1% rule at list price ($950 rent vs $55k).
- Recommended offer: $54k (1.5% below list) — sets the bar for market timing.
Location & tenants
- Location reads 63/100 on livability (#512 in MI) — a middle-class / working-renter tenant base. Strengths: cost of living A+, housing A+, crime A; Watch: schools C-, amenities F, commute F.
- Brown City Community Schools (rural): math 25% / reading 39% proficiency, ranked #336 of 540 in MI (top 62%) — families likely to look elsewhere, expect single-tenant / working-renter base with shorter leases.
- Market conditions: 43 active listings in the ZIP; 1 comparable units currently listed for rent nearby; 63 units permitted in Sanilac County in 2024 (0 in 5+ unit buildings).
Forward outlook
- Local home prices are declining (-3.0%/yr); year-one equity from $380 of loan paydown is wiped out by about $2k of value loss. Plan a longer hold.
- Sanilac County population projected at -31% by 2050 — secular population decline; favor cash flow + early exit over multi-decade hold.
- At projected returns (-3.0% appreciation + 3.0% rent growth), your $15k cash investment doubles in ~5 years — after that, you're playing with house money.
Negotiation context
- It's been on market 15 days — a 2% lower offer ($54k) is reasonable based on typical stale-listing flexibility.
Questions for the listing agent
- Is there a deadline driving the sale (1031 exchange, divorce, estate, relocation)? That informs how much negotiation room exists.
- What's the average days-on-market for RENTAL listings here right now (not sales)? A rising rental-DOM trend means longer vacancies and softer asking-rent achievability than the comps imply.
- What's the recent tenant-quality profile in this submarket — average credit score on applications, eviction rate, late-payment / NSF rate, and stable-employment percentage? A property-management company in the area should have these aggregated.
- How much new for-sale + rental construction is in the pipeline within 1–3 miles? Heavy new supply typically softens prices + rents 12–24 months out; constrained supply supports both.
Investment metrics
- 1% rule
- 1.73% ✓
- Cap rate
- 14.40%
- Cash-on-cash
- 28.97%
- DSCR
- 2.29
- GRM
- 4.8
CMA / ARV
- ARV (on-the-fly)
- $43,428
- Comps found
- 7
Show comp detail 7 sales within ~0.75 mi
| Address | Dist | Beds/Ba | Sqft | Sold | Price | $/sf | Match |
|---|---|---|---|---|---|---|---|
| 4085 Mapleview Ct E | 0.02mi | 2/2.0 | 924 (0%) | 12mo | $45,000 | $49 | 89 |
| 7168 Mapleview Cir W | 0.08mi | 3/2.0 (+1) | 950 (+3%) | 10mo | $35,000 | $37 | 78 |
| 4101 Mapleview Ct E | 0.02mi | 3/2.0 (+1) | 1,000 (+8%) | 4mo | $41,500 | $42 | 77 |
| 7134 Mapleview Circle East Cir | 0.04mi | 2/2.0 | 980 (+6%) | 13mo | $39,900 | $41 | 77 |
| 7113 Mapleview Cir E | 0.09mi | 3/2.0 (+1) | 980 (+6%) | 9mo | $46,000 | $47 | 73 |
| 4183 Second St | 0.43mi | 2/1.5 | 1,000 (+8%) | 4mo | $187,000 | $187 | 61 |
| 4297 Maple St | 0.45mi | 2/1.0 | 1,025 (+11%) | 18mo | $97,000 | $95 | 42 |
Match score weights: distance 35% · size 25% · config 20% · recency 20%. Top-matched comps best support the ARV.
Projected returns pro-forma
-3.0% appreciation · 3.0% rent growth · sell at horizon
- IRR
- 23.3%
- Equity multiple
- 1.96×
- Total profit
- $14,754
- Equity at exit
- $8,186
- IRR
- 31.3%
- Equity multiple
- 3.82×
- Total profit
- $43,340
- Equity at exit
- $4,747
Cash invested: $15,372 (down + closing). Projections, not guarantees.
Landlord ↔ Tenant lean methodology
- Overall (STATE)
- 62 Landlord-Friendly
- State Michigan
- 62 Landlord-Friendly · EVEN
- County
- — inherits STATE
- City
- — inherits STATE
ZIP-level market 48416
- Home prices YoY
- -16.8%
- Active inventory
- 43
- Price-to-rent
- 4.8×
Monthly cashflow live
- Estimated rent
- $950 medium interval (Pro) →
- Mortgage (P&I)
- −$288
- Tax est. 1.5%
- −$69 /mo · $824/yr
- Insurance
- −$23
- HOA
- −$0
- Vacancy / Maint / Mgmt
- −$200
- Net cashflow
- $371
Break-even live
UW: 25.0% down · 7.5% · 30yr · 1.5% tax · 5.0% vac · 8.0% maint · 8.0% mgmt
Financing live
Cash to close
- Down payment
- $13,725
- Closing costs
- $1,647
- Reserves months
- —
- Total cash needed
- —
Loan-product check · same deal, 3 products live
Conventional
25% down · 7.5% · 30yr
- Down + closing
- —
- Monthly P&I
- —
- Monthly cashflow
- —
- DSCR
- —
- Eligible?
- —
Personal DTI + credit; lowest rate.
DSCR
20% down · 8.5% · 30yr
- Down + closing
- —
- Monthly P&I
- —
- Monthly cashflow
- —
- DSCR
- —
- Eligible?
- —
No personal income docs; deal must DSCR.
Hard money
10% down · 12.0% · 12mo
- Down + closing
- —
- Monthly P&I
- —
- Monthly cashflow
- —
- DSCR
- —
- Eligible?
- —
Short-term bridge; refi at stabilization.
Rent comps 1 comps
| Address | Beds | Baths | Sqft | Rent | $/sqft | DOM | Units | Dist |
|---|---|---|---|---|---|---|---|---|
| 7201 Maple Valley Rd Brown City, MI | 2.0 | 1.0 | 850 | $950 | $1.12 | 1d | 1 | 0.43mi |
Listing history 7 events
-
2026-06-07days on market $54,900 Active 15 DOM
-
2026-06-04days on market $54,900 Active 12 DOM
-
2026-06-03days on market $54,900 Active 11 DOM
-
2026-06-02days on market $54,900 Active 10 DOM
-
2026-06-01days on market $54,900 Active 9 DOM
-
2026-05-31days on market $54,900 Active 8 DOM
-
2026-05-23historical $54,900
ⓘ Source: listings_history table (triggers on properties + properties_extension) + one-shot
backfill from property_details.listing_events for pre-trigger history.
Nearby sold comps map
Loading sold comps map…
Walkable amenities ~0.75 mi
Loading nearby amenities…
Taxation est. · year 1
- Rental income
- $11,400
- − Mortgage interest
- −$3,075
- − Property taxes
- −$824
- − Insurance
- −$274
- − Repairs & maintenance
- −$912
- − Management
- −$912
- − Depreciation
- −$1,597
- Taxable income
- $3,806
- Est. tax owed @ 24.0%
- −$913
- After-tax cash flow
- $3,540/yr
For passive investors: Depreciation is non-cash, so a rental often shows a tax loss while cash-flowing — sheltering income. Rental losses are passive: they offset passive income freely, and up to $25,000/yr can offset ordinary (W-2) income if you actively participate and your MAGI is under $100k (phasing out to $0 by $150k); unused losses carry forward. On sale, claimed depreciation is recaptured at up to 25%, and gains may owe capital-gains tax (a 1031 exchange can defer both). Figures are a year-1 estimate at your 24.0% rate — not tax advice; consult a CPA.
Condition & rehab AI · 1 photo
This manufactured home is in good condition with recent upgrades, making it move-in ready with a good resale and rental value.
Value-add opportunities
- Both Paint exterior siding — Enhances curb appeal and protects siding
- Both Replace satellite dish — Improves aesthetics and functionality
- Both Upgrade landscaping — Enhances curb appeal and adds value
Renovation cost estimate screening
Value-add ROI direction
- Both Paint exterior siding — Enhances curb appeal and protects siding ↑
- Both Replace satellite dish — Improves aesthetics and functionality ↑
- Both Upgrade landscaping — Enhances curb appeal and adds value ↑
ⓘ Cost ranges are severity-bucket heuristics (US national rule-of-thumb). Get contractor quotes + a written scope before underwriting a rehab budget.
Schools (NCES district)
- District
- Brown City Community Schools
- NCES district ID
- 2607040
- Math proficiency
- 25% ▼ -8.00%
- Reading proficiency
- 39% ▼ -5.00%
- Median HH income
- $44,588
- Composite
- 27.29/100
- National rank
- #7002
- State rank
- #336 of 540 in MI
Livability — Brown City
- Score
- 63/100
- State rank
- #512
- US rank
- #15324
Category grades
Schools grade is shown separately in the Schools card above.
Census & demographics
- Census place
- Brown City, MI
- City population
- 5,216
- Population (ZIP)
- 5,216
Population outlook (Sanilac County) Hauer SSP2
- Today (2025)
- 37,948 people
- By 2030
- 35,772 · -5.7%
- By 2040
- 30,996 · -18.3%
- By 2050
- 26,280 · -30.7%
- By 2075
- 17,471 · -54.0%
- By 2100
- 10,572 · -72.1%
Race, ethnicity, and origin ACS 2023
- Neighborhood character
- Predominantly White (93%)
- Race & ethnicity
- White 93% Hispanic / Latino 4% Two or more races 3%
- Common ancestry
- Romanian 12% Lithuanian 2% Iranian 2%
- Foreign-born
- 2% · Canada
- Languages at home
- 89% English-only · German/W. Germanic 9% Spanish 1% Russian/Polish/Slavic 0%
Political lean MEDSL · Sanilac
- 2024 margin
- Solid R (+47.7) · D 25.5% · R 73.2% · Other 1.3%
- 2008→2024 swing
- -39.6pp toward R · 2008: -8.1pp · 2024: -47.7pp
- All cycles
- 2024: R+47.7 2020: R+45.6 2016: R+44.5 2012: R+20.4 2008: R+8.1
Not yet ingested
- Civics
- —
Market trends
- HPI YoY
- ▼ -41.42%
- Current HPI
- 205.2258
- Rent YoY
- —
- Metro
- —
- State GDP YoY
- ▲ 1.37%
- F500 in state
- 28
Industry mix (Fortune 500 HQ in MI)
| Industry | F500 HQs | Revenue |
|---|---|---|
| Automotive Parts | 3 | $48B |
|
||
| Automotive | 2 | $372B |
|
||
| Chemicals | 1 | $45B |
|
||
| Automotive Retail | 1 | $29B |
|
||
| Healthcare / Medical Devices | 1 | $23B |
|
||
| Automotive Technology | 1 | $20B |
|
||
Price history
1 event — show timeline
- 2026-05-23 Coming Soon $54,900 MiRealSource-MiMLS
Cash-flow waterfall
monthlySold comps — $/sqft
last 12 mo · ≤1 miLoading sold comps…