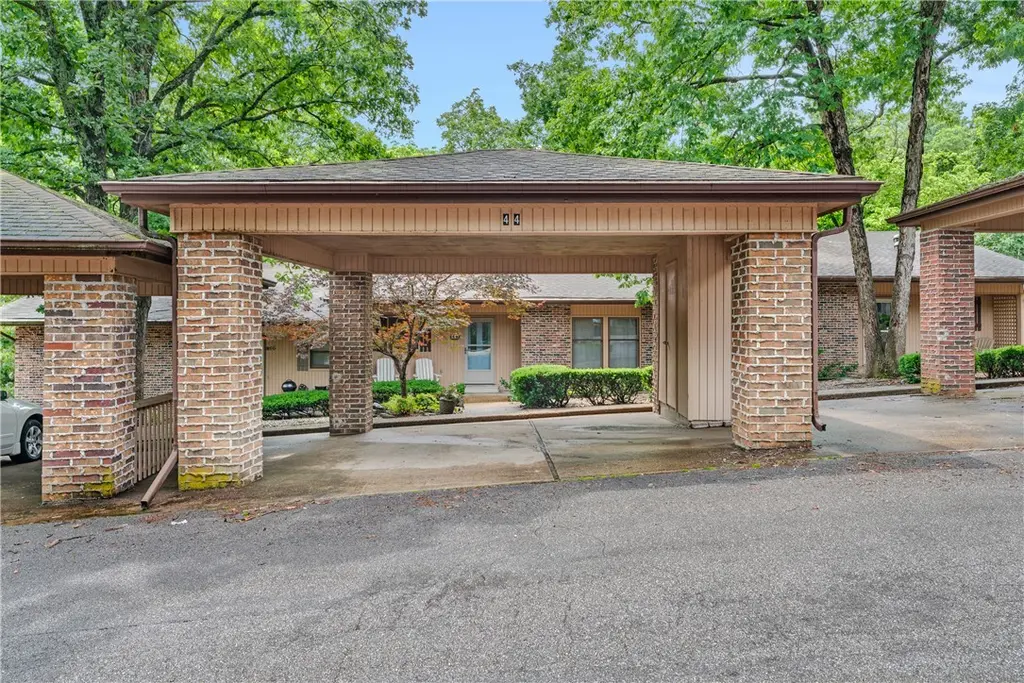
44 Abingdon Ln · Bella Vista, AR
Flood risk 1/10 · Minimal
- FEMA flood zone
- X (unshaded)
- Chance of flooding over 30 yrs
- 0.0%
- Est. flood insurance / yr
- $473 – $860
Fire risk 3/10 · Minor
- Est. fire insurance / yr
- $1,499 – $2,785
Heat risk 5/10 · Moderate
- Hot days now (above 105°F)
- 7 days/yr
- Hot days in 30 yrs
- 21 days/yr
Wind risk 2/10 · Minimal
- Chance of severe wind over 30 yrs
- 2.0%
Air-quality risk 2/10 · Minimal
- Unhealthy air days now
- 0 days/yr
- Unhealthy air days in 30 yrs
- 1 days/yr
Risk factors via First Street. Map © Google.
Why this score? — see what drove the C+ grade
The composite is a weighted blend of 9 inputs, each scored 0–100. Each bar is that input's sub-score; the figure is the points it added to the 100-point composite (weight × sub-score).
- Cash flow +23.2/30.0
- ARV discount +10.6/15.0
- DSCR +7.5/10.0
- 1% rule +5.2/10.0
- Schools +5.2/10.0
- Livability +3.4/5.0
- Rent growth +2.5/5.0
- Condition / age +2.5/5.0
- Appreciation +0.0/10.0
$225,000
🖨 Deal sheet 📄 Offer letter ✓ Due diligence
Listing remarks MLS
Come home to this comfortable 3 bedroom townhouse, featuring a sunny screened-in porch to enjoy your backyard view of woods & wild life! Enjoy updates; ceramic floors in entryway, kitchen, & baths, as well as wood laminate floors, a new dining-room ceiling light, new front storm-door, a new 2016 roof on entire carport & half of townhouse. The sellers are willing to include selling much of the furniture as well! Golf, club house, trails, pools, and tennis are just some of community's amenities!
Key facts
- Screened porch
- 1,742 sq ft lot
- 2 parking spots
Tags
Property features AI
Finance
- HOA & community: Homeowners association (Bella Vista POA) with monthly fees; Association fees include structure maintenance; Community amenities: biking, clubhouse, park, pool, tennis courts, trails/paths; near fire station and schools
Exterior
- Parking: Detached carport; 2 covered parking spaces
- Utilities: Public water; Sewer available; Electricity available; Cable available; Phone available
- Home design: 2-story home
- Construction: Brick and Masonite exterior; Asphalt shingle roof; Block foundation
- Exterior features: Concrete driveway; Covered patio/porch; Deck; Screened porch; Community pool; Landscaped lot; Subdivision setting; Wooded lot; Public road frontage; Paved road
Interior
- Kitchen: Dishwasher; Electric range
- Bedrooms: Includes a bonus room
- Flooring: Carpet; Laminate; Tile
- Bathrooms: 2 full bathrooms
- Heating & cooling: Electric heating; Central air conditioning
- Interior features: Built-in features; Ceiling fans; Storage space; Workshop; Double pane windows
- Laundry & utility: Washer hookup; Dryer hookup; Electric water heater
Neighborhood map
What this means for you Summary
Snapshot
- This is a 2-bed/2.0-bath single-family listed at $225k.
Deal economics
- At list price, monthly cash flow is $408 ($5k/yr) — positive.
- The deal already cash-flows at list — no discount required.
- Meets the 1% rule at list price ($2k rent vs $225k).
- Cap rate 8.5% vs local median 3.6% in Bella Vista — top-decile yield for the area; either an underpriced asset or a hidden risk that comps aren't pricing in. Stress-test before assuming the spread holds.
Location & tenants
- Location reads 67/100 on livability (#111 in AR) — a middle-class / working-renter tenant base. Strengths: cost of living A+, housing A+, schools A; Watch: amenities F, commute F, health & safety F.
- Bentonville School District (urban): math 59% / reading 59% proficiency, ranked #3 of 238 in AR (top 1%) — acceptable for families but not a draw, mixed tenant base, ~2y average lease.
- Market conditions: 827 active listings in the ZIP; 7 comparable units currently listed for rent nearby; rentals at typical pace (median 24d on market — plan ~3-4 weeks tenant-placement turnaround); solid renter incomes; 4,359 units permitted in Benton County in 2024 (402 in 5+ unit buildings).
- This rent runs 34% of the median local income ($82k/yr) — at the standard rent-burdened threshold; future hikes will face affordability resistance.
Forward outlook
- Local home prices are declining (-3.0%/yr); year-one equity from $2k of loan paydown is wiped out by about $7k of value loss. Plan a longer hold.
- Benton County population projected at +56% by 2050 — long-run rental-demand tailwind backs the buy-and-hold thesis.
Negotiation context
- Only 3 days on market — expect competitive offers; lowballing is unlikely to land.
- 3 sale attempts since 11y ago with the ask held roughly flat each time — persistent listings suggest the price (not the market) is what's stuck; bring a comps-based counter.
- Current owner paid $104k; list at $225k implies a 116% gain — meaningful room to come down on a strong offer.
Risks & watch-outs
- Climate carrying-cost: extreme-heat days projected 7→21/yr by 2055 (HVAC capex compounding) — expect insurance premiums to compound above CPI over the hold.
Questions for the listing agent
- Is there a deadline driving the sale (1031 exchange, divorce, estate, relocation)? That informs how much negotiation room exists.
- Schools are A-rated — typically a magnet for longer-tenancy family renters. What's the average tenant stay here, and is there a school-zone premium baked into asking?
- What's the average days-on-market for RENTAL listings here right now (not sales)? A rising rental-DOM trend means longer vacancies and softer asking-rent achievability than the comps imply.
- What's the recent tenant-quality profile in this submarket — average credit score on applications, eviction rate, late-payment / NSF rate, and stable-employment percentage? A property-management company in the area should have these aggregated.
- How much new for-sale + rental construction is in the pipeline within 1–3 miles? Heavy new supply typically softens prices + rents 12–24 months out; constrained supply supports both.
Investment metrics
- 1% rule
- 1.02% ✓
- Cap rate
- 8.47%
- Cash-on-cash
- 7.77%
- DSCR
- 1.35
- GRM
- 8.1
CMA / ARV
- ARV (on-the-fly)
- $241,536
- Comps found
- 6
Show comp detail 6 sales within ~0.75 mi
| Address | Dist | Beds/Ba | Sqft | Sold | Price | $/sf | Match |
|---|---|---|---|---|---|---|---|
| 9 Brighstone Ln | 0.56mi | 2/2.0 | 1,088 (0%) | 8mo | $185,300 | $170 | 67 |
| 3 Roding Cir | 0.19mi | 2/2.0 | 1,196 (+10%) | 9mo | $265,000 | $222 | 67 |
| 1 Gidney Cir | 0.41mi | 2/2.0 | 1,209 (+11%) | 4mo | $268,000 | $222 | 59 |
| 3 Cummings Ln | 0.34mi | 2/2.0 | 1,144 (+5%) | 23mo | $267,500 | $234 | 56 |
| 8 Brompton Ln | 0.35mi | 2/2.5 | 1,134 (+4%) | 23mo | $224,000 | $198 | 56 |
| 4 Rea Cir | 0.56mi | 3/2.0 (+1) | 1,200 (+10%) | 9mo | $295,000 | $246 | 45 |
Match score weights: distance 35% · size 25% · config 20% · recency 20%. Top-matched comps best support the ARV.
Projected returns pro-forma
-3.0% appreciation · 3.0% rent growth · sell at horizon
- IRR
- -4.5%
- Equity multiple
- 0.83×
- Total profit
- $-10,547
- Equity at exit
- $33,548
- IRR
- 5.2%
- Equity multiple
- 1.38×
- Total profit
- $24,037
- Equity at exit
- $19,454
Cash invested: $63,000 (down + closing). Projections, not guarantees.
Landlord ↔ Tenant lean methodology
- Overall (STATE)
- 92 Strongly Landlord-Friendly
- State Arkansas
- 92 Strongly Landlord-Friendly · R+14
- County
- — inherits STATE
- City
- — inherits STATE
ZIP-level market 72715
- Home prices YoY
- -6.6%
- Active inventory
- 827
- Price-to-rent
- 8.1×
Monthly cashflow live
- Estimated rent
- $2,305 high interval (Pro) →
- Mortgage (P&I)
- −$1,180
- Tax from tax record
- −$139 /mo · $1,672/yr
- Insurance
- −$94
- HOA
- −$0
- Vacancy / Maint / Mgmt
- −$484
- Net cashflow
- $408
Break-even live
UW: 25.0% down · 7.5% · 30yr · 1.5% tax · 5.0% vac · 8.0% maint · 8.0% mgmt
Financing live
Cash to close
- Down payment
- $56,250
- Closing costs
- $6,750
- Reserves months
- —
- Total cash needed
- —
Loan-product check · same deal, 3 products live
Conventional
25% down · 7.5% · 30yr
- Down + closing
- —
- Monthly P&I
- —
- Monthly cashflow
- —
- DSCR
- —
- Eligible?
- —
Personal DTI + credit; lowest rate.
DSCR
20% down · 8.5% · 30yr
- Down + closing
- —
- Monthly P&I
- —
- Monthly cashflow
- —
- DSCR
- —
- Eligible?
- —
No personal income docs; deal must DSCR.
Hard money
10% down · 12.0% · 12mo
- Down + closing
- —
- Monthly P&I
- —
- Monthly cashflow
- —
- DSCR
- —
- Eligible?
- —
Short-term bridge; refi at stabilization.
Rent comps 7 comps
| Address | Beds | Baths | Sqft | Rent | $/sqft | DOM | Units | Dist |
|---|---|---|---|---|---|---|---|---|
| 9 August Ln Unit 1363327P Bella Vista, AR | 2.0 | 1.5 | 1173 | $3,153 | $2.69 | 14d | 1 | 0.34mi |
| 6 Connie Ln Bella Vista, AR | 3.0 | 2.0 | 1440 | $2,250 | $1.56 | 23d | 1 | 0.45mi |
| 4 Kemble Cir Bella Vista, AR | 3.0 | 2.0 | 1376 | $1,850 | $1.34 | 23d | 1 | 0.90mi |
| 10 Riordan Rd Unit 1221880P Bella Vista, AR | 2.0 | 2.0 | 882 | $4,248 | $4.82 | 23d | 1 | 1.00mi |
| 2 Felton Ln Unit 1241295P Bella Vista, AR | 2.0 | 2.0 | 1388 | $2,815 | $2.03 | 14d | 1 | 1.03mi |
| 71 London Dr Bella Vista, AR | 3.0 | 2.0 | 1490 | $2,100 | $1.41 | 23d | 1 | 1.19mi |
| 1 Endon Cir Bella Vista, AR | 2.0 | 1.5 | 1040 | $1,295 | $1.25 | 14d | 1 | 1.22mi |
Listing history 3 events
-
2026-06-14statusdays on market $225,000 Pending 3 DOM
-
2026-06-10remarks 693-char remark
-
2026-06-10$225,000 Active 1 DOM
ⓘ Source: listings_history table (triggers on properties + properties_extension) + one-shot
backfill from property_details.listing_events for pre-trigger history.
Tax reassessment forecast AR · Resets to sale price
- Current annual tax
- $1,672 · $139/mo
- Projected year-2 tax
- $1,672 · $139/mo
- Expected delta
- $0/yr ($0/mo · 0.0%)
ⓘ Screening estimate from a state-policy table — verify with the county assessor before closing.
Climate risk First Street
- Flood 1/10 Low FEMA zone X (unshaded) · 0% chance over 30 yrs
- Wildfire 3/10 Moderate
- Heat 5/10 Major 7 d/yr ≥105°F today · 21 d/yr by 30 yrs out
- Wind 2/10 Low 2% chance of damaging wind over 30 yrs
- Air quality 2/10 Low 0 unhealthy d/yr today · 1 by 30 yrs out
Nearby sold comps map
Loading sold comps map…
Walkable amenities ~0.75 mi
Loading nearby amenities…
Taxation est. · year 1
- Rental income
- $27,656
- − Mortgage interest
- −$12,603
- − Property taxes
- −$1,672
- − Insurance
- −$1,125
- − Repairs & maintenance
- −$2,212
- − Management
- −$2,212
- − Depreciation
- −$6,545
- Taxable income
- $1,285
- Est. tax owed @ 24.0%
- −$308
- After-tax cash flow
- $4,584/yr
For passive investors: Depreciation is non-cash, so a rental often shows a tax loss while cash-flowing — sheltering income. Rental losses are passive: they offset passive income freely, and up to $25,000/yr can offset ordinary (W-2) income if you actively participate and your MAGI is under $100k (phasing out to $0 by $150k); unused losses carry forward. On sale, claimed depreciation is recaptured at up to 25%, and gains may owe capital-gains tax (a 1031 exchange can defer both). Figures are a year-1 estimate at your 24.0% rate — not tax advice; consult a CPA.
Schools (NCES district)
- District
- Bentonville School District
- NCES district ID
- 0503060
- Math proficiency
- 59% ▼ -8.00%
- Reading proficiency
- 59% ▼ -6.00%
- Median HH income
- $66,721
- Composite
- 51.85/100
- National rank
- #1661
- State rank
- #3 of 238 in AR
Livability — Bella Vista
- Score
- 67/100
- State rank
- #111
- US rank
- #11129
Category grades
Schools grade is shown separately in the Schools card above.
Census & demographics
- Census place
- Bella Vista, AR
- County
- Benton County · 259,241 people
- City population
- 31,638
- Metro
- Fayetteville-Springdale-Rogers, AR
- Population (ZIP)
- 17,288
- Household income
- $82,447
- Rent vs Own
- Severe rent burden
- 107.0
Population outlook (Benton County) Hauer SSP2
- Today (2025)
- 318,683 people
- By 2030
- 353,481 · +10.9%
- By 2040
- 425,280 · +33.4%
- By 2050
- 497,239 · +56.0%
- By 2075
- 662,114 · +107.8%
- By 2100
- 776,431 · +143.6%
Race, ethnicity, and origin ACS 2023
- Neighborhood character
- Predominantly White (84%)
- Race & ethnicity
- White 84% Two or more races 12% Hispanic / Latino 6% Asian 1%
- Hispanic origin (detail)
- Mexican 2% Dominican 2%
- Common ancestry
- Lithuanian 4% Slovak 4% Portuguese 2%
- Foreign-born
- 3% · Canada
- Languages at home
- 97% English-only · Spanish 2%
Political lean MEDSL · Benton
- 2024 margin
- Strong R (+27.0) · D 35.2% · R 62.1% · Other 2.7%
- 2008→2024 swing
- +9.6pp toward D · 2008: -36.5pp · 2024: -27.0pp
- All cycles
- 2024: R+27.0 2020: R+26.4 2016: R+34.9 2012: R+40.4 2008: R+36.5
Not yet ingested
- Civics
- —
Market trends
- HPI YoY
- ▼ -21.53%
- Current HPI
- 304.946
- Rent YoY
- —
- Metro
- Fayetteville-Springdale-Rogers, AR
- State GDP YoY
- ▲ 3.80%
- F500 in state
- 10
Industry mix (Fortune 500 HQ in AR)
| Industry | F500 HQs | Revenue |
|---|---|---|
| Retail | 1 | $681B |
|
||
| Food / Agriculture | 1 | $53B |
|
||
| Retail / Energy | 1 | $22B |
|
||
| Transportation / Logistics | 1 | $12B |
|
||
| Energy | 1 | $4B |
|
||
Price history
+161.6% since first listed8 events — show timeline
- 2026-06-09 Listed $225,000 NWARMLS
- 2018-01-16 Sold (MLS) $104,000 NWARMLS
- 2017-11-28 Listed $104,500 NWARMLS
- 2015-05-11 Sold (Public Records) $98,000 Public Records
- 2015-05-08 Sold (MLS) $98,000 NWARMLS
- 2015-02-16 Listed $103,000 NWARMLS
- 2008-05-27 Sold (Public Records) $110,000 Public Records
- 2004-05-24 Sold (Public Records) $86,000 Public Records
Property tax history
+6.3%/yrLatest (2025): $1,672 · +9.8% YoY. Source: county tax records.
Cash-flow waterfall
monthlySold comps — $/sqft
last 12 mo · ≤1 miLoading sold comps…