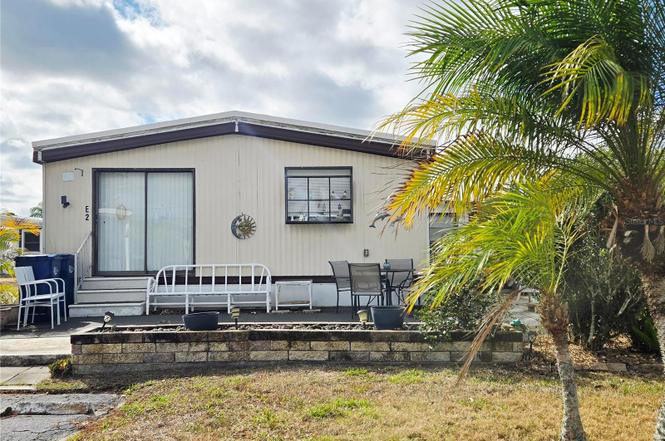
5316 53rd Ave E Unit E2 · Bradenton, FL
Flood risk 4/10 · Minor
- FEMA flood zone
- X (unshaded)
- Chance of flooding over 30 yrs
- 0.21%
- Est. flood insurance / yr
- $507 – $1,088
Fire risk 1/10 · Minimal
- Est. fire insurance / yr
- $947 – $1,759
Heat risk 10/10 · Severe
- Hot days now (above 108°F)
- 7 days/yr
- Hot days in 30 yrs
- 30 days/yr
Wind risk 10/10 · Severe
- Chance of severe wind over 30 yrs
- 99.0%
Air-quality risk 2/10 · Minimal
- Unhealthy air days now
- 1 days/yr
- Unhealthy air days in 30 yrs
- 1 days/yr
Risk factors via First Street. Map © Google.
Why this score? — see what drove the B+ grade
The composite is a weighted blend of 9 inputs, each scored 0–100. Each bar is that input's sub-score; the figure is the points it added to the 100-point composite (weight × sub-score).
- Cash flow +30.0/30.0
- ARV discount +12.9/15.0
- 1% rule +10.0/10.0
- DSCR +10.0/10.0
- Schools +4.4/10.0
- Livability +4.0/5.0
- Condition / age +2.5/5.0
- Rent growth +2.3/5.0
- Appreciation +0.0/10.0
$79,750
🖨 Deal sheet (PDF) 📄 Offer letter ✓ Due diligence
Listing remarks
Move right into your new Turnkey Home and start enjoying all of the Amenities that Westwinds has to Offer! Great Porch to sit and relax on and say HI to the Neighbors! There is a private patio on the side surrounded by great foiliage. Relax in the spacious Living Room with an Electric Fireplace. This Home is ready for its new Owners!
Key facts
- 3,284 sq ft lot
- Community pool
- Built 1977
Property features AI
Finance
- Other: Turnkey furnished option indicated; Community features include clubhouse, community mailbox, and association-owned recreation
- Financial info: Total monthly fees listed as $322; Total annual fees listed as $3,864; Lease restrictions apply
- HOA & community: Has HOA (association name: Lou Paul); Monthly association fee of $322; Association fee includes cable TV, common area taxes, pool, escrow reserves, fidelity bond, grounds maintenance, management, private road, recreational facilities, sewer, trash and water; Association amenities: clubhouse, laundry, shuffleboard court, storage; vehicle and fence restrictions; Buyer/association approval required; Senior community with deed restrictions; pets allowed with restrictions
Exterior
- Parking: Parking details not specified
- Security: No specific security features listed
- Utilities: Public water; Public sewer; Electricity connected; Cable connected; Sewer connected; Water connected; Underground utilities
- Home design: Manufactured home (double wide); One level; Northwest facing
- Construction: Metal siding and frame construction; Membrane roof; Crawlspace foundation; Built on a 0.08-acre lot
- Exterior features: Porch; Sliding doors; Asphalt/paved road access
Interior
- Kitchen: Range; Microwave; Refrigerator; Dishwasher not listed
- Bedrooms: 2 bedrooms
- Flooring: Carpet; Ceramic tile; Linoleum
- Bathrooms: 2 full bathrooms
- Heating & cooling: Central heating (electric); Central air conditioning
- Interior features: Ceiling fans; Thermostat; Window treatments; Electric fireplace in living room; Tankless and electric water heaters
- Laundry & utility: Washer; Dryer; Laundry facilities (community/association listed)
Neighborhood map
What this means for you Summary
Snapshot
- This is a 2-bed/1.0-bath manufactured listed at $80k.
Deal economics
- At list price, monthly cash flow is $605 ($7k/yr) — positive.
- The deal already cash-flows at list — no discount required.
- Meets the 1% rule at list price ($2k rent vs $80k).
- Recommended offer: $75k (6.0% below list) — sets the bar for market timing.
- Cap rate 15.4% vs local median 3.6% in Bradenton — top-decile yield for the area; either an underpriced asset or a hidden risk that comps aren't pricing in. Stress-test before assuming the spread holds.
Location & tenants
- Location reads 81/100 on livability (#101 in FL, #1,528 nationally) — a professional / high-income tenant draw. Strengths: commute A+, cost of living A+, housing A+; Watch: employment D+, crime D, amenities F.
- Manatee (suburban): math 54% / reading 50% proficiency, ranked #26 of 73 in FL (top 36%) — acceptable for families but not a draw, mixed tenant base, ~2y average lease.
- Zoned schools: Tara Elementary School (math 79% / reading 66%, grade A, #281 of 2,144 statewide, top 13%, 559 students, 52% FRL); Braden River High School (math 44% / reading 52%, grade D, #201 of 667 statewide, top 30%, 1,774 students, 45% FRL) — zoned schools at 48% FRL track the district average.
- Market conditions: Rents soft (-1.0%/yr); 387 active listings in the ZIP; 7,472 units permitted in Manatee County in 2024 (1,782 in 5+ unit buildings).
- This rent runs 32% of the median local income ($71k/yr) — at the standard rent-burdened threshold; future hikes will face affordability resistance.
Forward outlook
- Local home prices are declining (-3.0%/yr); year-one equity from $552 of loan paydown is wiped out by about $2k of value loss. Plan a longer hold.
- Manatee County population projected at +43% by 2050 — long-run rental-demand tailwind backs the buy-and-hold thesis.
- At projected returns (-3.0% appreciation + 0.0% rent growth), your $22k cash investment doubles in ~5 years — after that, you're playing with house money.
Negotiation context
- It's been on market 79 days — a 6% lower offer ($75k) is reasonable based on typical stale-listing flexibility.
- 6 sale attempts since 2y ago with the ask held roughly flat each time — persistent listings suggest the price (not the market) is what's stuck; bring a comps-based counter.
- Current owner paid $30k; list at $80k implies a 166% gain — meaningful room to come down on a strong offer.
Risks & watch-outs
- Climate carrying-cost: severe wind risk, 99% chance of damaging wind over 30y; extreme-heat days projected 7→30/yr by 2055 (HVAC capex compounding) — expect insurance premiums to compound above CPI over the hold.
Questions for the listing agent
- It's been on market 79 days. Have you received any prior offers? Is the seller open to a 6% concession, seller financing, or rate buy-down credit?
- Built in 1977 — when were the roof, HVAC, electrical panel, plumbing, and water heater last replaced?
- What does the HOA fee cover, when was the last increase, and are there any pending special assessments or reserve-fund shortfalls?
- Why hasn't it sold? Are there any deal-killer items the seller is aware of (foundation, flood, title, zoning, code violations)?
- Is there a deadline driving the sale (1031 exchange, divorce, estate, relocation)? That informs how much negotiation room exists.
- Crime grade is D in this area — have there been break-ins, vandalism, or insurance claims at this property in the last 3 years? What carrier currently insures it and at what premium?
- What's the average days-on-market for RENTAL listings here right now (not sales)? A rising rental-DOM trend means longer vacancies and softer asking-rent achievability than the comps imply.
- What's the recent tenant-quality profile in this submarket — average credit score on applications, eviction rate, late-payment / NSF rate, and stable-employment percentage? A property-management company in the area should have these aggregated.
- How much new for-sale + rental construction is in the pipeline within 1–3 miles? Heavy new supply typically softens prices + rents 12–24 months out; constrained supply supports both.
Investment metrics
- 1% rule
- 2.35% ✓
- Cap rate
- 15.40%
- Cash-on-cash
- 32.54%
- DSCR
- 2.45
- GRM
- 3.5
CMA / ARV
- ARV (on-the-fly)
- $90,528
- Comps found
- 12
Show comp detail 12 sales within ~0.75 mi
| Address | Dist | Beds/Ba | Sqft | Sold | Price | $/sf | Match |
|---|---|---|---|---|---|---|---|
| 5316 53rd Ave E Unit E2 | 0.00mi | 2/2.0 | 736 (0%) | 1mo | $75,000 | $102 | 95 |
| 5316 53rd Ave E Unit I10 | 0.26mi | 2/1.5 | 744 (+1%) | 8mo | $98,000 | $132 | 77 |
| 5316 53 Ave E Unit I5 | 0.23mi | 2/1.0 | 690 (-6%) | 3mo | $84,900 | $123 | 76 |
| 5316 53rd Ave E Unit A3 | 0.05mi | 2/2.0 | 768 (+4%) | 12mo | $65,000 | $85 | 76 |
| 5316 53rd Ave E Unit B6 | 0.10mi | 2/1.0 | 672 (-9%) | 10mo | $50,000 | $74 | 72 |
| 5316 53rd Ave E Unit M4 | 0.25mi | 2/1.0 | 672 (-9%) | 3mo | $73,000 | $109 | 71 |
| 5316 53rd Ave E Unit F40 | 0.15mi | 2/2.0 | 792 (+8%) | 9mo | $108,000 | $136 | 69 |
| 5316 53rd Ave E Unit Q6 | 0.23mi | 2/1.0 | 672 (-9%) | 10mo | $80,000 | $119 | 67 |
| 5316 53rd Ave E Unit Q8 | 0.24mi | 2/1.0 | 672 (-9%) | 12mo | $99,000 | $147 | 64 |
| 5316 53rd Ave E Unit K29 | 0.26mi | 2/2.0 | 672 (-9%) | 10mo | $111,000 | $165 | 61 |
| 5707 45th St E #81 | 0.68mi | 2/2.0 | 736 (0%) | 6mo | $105,000 | $143 | 59 |
| 5316 53rd Ave E Unit K4 | 0.25mi | 3/2.0 (+1) | 792 (+8%) | 12mo | $85,000 | $107 | 57 |
Match score weights: distance 35% · size 25% · config 20% · recency 20%. Top-matched comps best support the ARV.
Projected returns pro-forma
-3.0% appreciation · 0.0% rent growth · sell at horizon
- IRR
- 23.3%
- Equity multiple
- 1.91×
- Total profit
- $20,371
- Equity at exit
- $11,891
- IRR
- 28.7%
- Equity multiple
- 3.11×
- Total profit
- $47,077
- Equity at exit
- $6,895
Cash invested: $22,330 (down + closing). Projections, not guarantees.
Landlord ↔ Tenant lean methodology
- Overall (STATE)
- 87 Strongly Landlord-Friendly
- State Florida
- 87 Strongly Landlord-Friendly · R+3
- County
- — inherits STATE
- City
- — inherits STATE
ZIP-level market 34203
- Home prices YoY
- -24.5%
- Rents YoY
- -1.0%
- Active inventory
- 387
- Price-to-rent
- 3.5×
Monthly cashflow live
- Estimated rent
- $1,876 medium interval (Pro) →
- Mortgage (P&I)
- −$418
- Tax from tax record
- −$103 /mo · $1,236/yr
- Insurance
- −$33
- HOA
- −$322
- Vacancy / Maint / Mgmt
- −$394
- Net cashflow
- $605
Break-even live
Sensitivity live
| Price | -10% $651 | -5% $628 | +0% $605 | +5% $583 | +10% $560 |
|---|---|---|---|---|---|
| Rent | -10% $457 | -5% $531 | +0% $605 | +5% $680 | +10% $754 |
| Rate | -1.0pp $646 | -0.5pp $626 | base $605 | +0.5pp $585 | +1.0pp $564 |
UW: 25.0% down · 7.5% · 30yr · 1.5% tax · 5.0% vac · 8.0% maint · 8.0% mgmt
Financing live
Cash to close
- Down payment
- $19,938
- Closing costs
- $2,392
- Reserves months
- —
- Total cash needed
- —
Loan-product check · same deal, 3 products live
Conventional
25% down · 7.5% · 30yr
- Down + closing
- —
- Monthly P&I
- —
- Monthly cashflow
- —
- DSCR
- —
- Eligible?
- —
Personal DTI + credit; lowest rate.
DSCR
20% down · 8.5% · 30yr
- Down + closing
- —
- Monthly P&I
- —
- Monthly cashflow
- —
- DSCR
- —
- Eligible?
- —
No personal income docs; deal must DSCR.
Hard money
10% down · 12.0% · 12mo
- Down + closing
- —
- Monthly P&I
- —
- Monthly cashflow
- —
- DSCR
- —
- Eligible?
- —
Short-term bridge; refi at stabilization.
HOA detail
- Monthly dues
- $322 · $3,864/yr
- Likely covers
- electric
Listing history 20 events
-
2026-05-07status Pending
-
2026-02-20historical
-
2026-02-17$79,750 Active
-
2026-01-26status Active
-
2026-01-26price $95,000
-
2026-01-22historical
-
2025-08-22$105,000 Active
-
2025-06-07historical
-
2025-01-07status Active
-
2025-01-03historical
-
2024-11-11price $105,000
-
2024-09-19price $130,000
-
2024-09-10status Active
-
2024-09-09historical
-
2024-07-29price $125,000
-
2024-03-10$140,000 Active
-
2009-04-08soldstatus $30,000
-
1997-12-22soldstatus $25,000
-
1994-12-19soldstatus $23,000
-
1991-12-12soldstatus $20,000
ⓘ Source: listings_history table (triggers on properties + properties_extension) + one-shot
backfill from property_details.listing_events for pre-trigger history.
Tax reassessment forecast FL · Resets to sale price
- Current annual tax
- $1,236 · $103/mo
- Projected year-2 tax
- $1,236 · $103/mo
- Expected delta
- $0/yr ($0/mo · 0.0%)
ⓘ Screening estimate from a state-policy table — verify with the county assessor before closing.
Climate risk First Street
- Flood 4/10 Moderate FEMA zone X (unshaded) · 21% chance over 30 yrs
- Wildfire 1/10 Low
- Heat 10/10 Extreme 7 d/yr ≥108°F today · 30 d/yr by 30 yrs out
- Wind 10/10 Extreme 99% chance of damaging wind over 30 yrs
- Air quality 2/10 Low 1 unhealthy d/yr today · 1 by 30 yrs out
Nearby sold comps map
Loading sold comps map…
Walkable amenities ~0.75 mi
Loading nearby amenities…
Taxation est. · year 1
- Rental income
- $22,511
- − Mortgage interest
- −$4,467
- − Property taxes
- −$1,236
- − Insurance
- −$399
- − Repairs & maintenance
- −$1,801
- − Management
- −$1,801
- − HOA
- −$3,864
- − Depreciation
- −$2,320
- Taxable income
- $6,623
- Est. tax owed @ 24.0%
- −$1,589
- After-tax cash flow
- $5,676/yr
For passive investors: Depreciation is non-cash, so a rental often shows a tax loss while cash-flowing — sheltering income. Rental losses are passive: they offset passive income freely, and up to $25,000/yr can offset ordinary (W-2) income if you actively participate and your MAGI is under $100k (phasing out to $0 by $150k); unused losses carry forward. On sale, claimed depreciation is recaptured at up to 25%, and gains may owe capital-gains tax (a 1031 exchange can defer both). Figures are a year-1 estimate at your 24.0% rate — not tax advice; consult a CPA.
Schools (NCES district)
- District
- Manatee
- NCES district ID
- 1201230
- Math proficiency
- 54% ▼ -6.00%
- Reading proficiency
- 50% ▼ -2.00%
- Median HH income
- $49,607
- Composite
- 44.43/100
- National rank
- #2806
- State rank
- #26 of 73 in FL
Livability — Bradenton
- Score
- 81/100
- State rank
- #101
- US rank
- #1528
Category grades
Schools grade is shown separately in the Schools card above.
Census & demographics
- County
- Manatee County · 416,364 people
- City population
- 227,091
- Metro
- North Port-Sarasota-Bradenton, FL
- Population (ZIP)
- 40,618
- Household income
- $70,761
- Rent vs Own
- Severe rent burden
- 1469.0
Population outlook (Manatee County) Hauer SSP2
- Today (2025)
- 447,342 people
- By 2030
- 488,911 · +9.3%
- By 2040
- 567,934 · +27.0%
- By 2050
- 637,995 · +42.6%
- By 2075
- 781,970 · +74.8%
- By 2100
- 848,272 · +89.6%
Race, ethnicity, and origin ACS 2023
- Neighborhood character
- Predominantly White (65%)
- Race & ethnicity
- White 65% Hispanic / Latino 19% Two or more races 12% Black 9% Asian 5%
- Hispanic origin (detail)
- Mexican 9% Puerto Rican 3% Cuban 2% Dominican 1%
- Common ancestry
- Lithuanian 3% Romanian 3% Slovak 2%
- Foreign-born
- 17% · Canada, Vietnam, Dominican Republic
- Languages at home
- 76% English-only · Spanish 16% Vietnamese 2% Other Indo-European 1%
Political lean MEDSL · Manatee
- 2024 margin
- Strong R (+23.5) · D 37.9% · R 61.4%
- 2008→2024 swing
- -16.5pp toward R · 2008: -7.0pp · 2024: -23.5pp
- All cycles
- 2024: R+23.5 2020: R+16.1 2016: R+17.1 2012: R+12.5 2008: R+7.0
Not yet ingested
- Civics
- —
Market trends
- HPI YoY
- ▼ -95.87%
- Current HPI
- 295.8871
- Rent YoY
- ▼ -0.97%
- Metro
- North Port-Sarasota-Bradenton, FL
- State GDP YoY
- ▲ 3.28%
- F500 in state
- 36
Industry mix (Fortune 500 HQ in FL)
| Industry | F500 HQs | Revenue |
|---|---|---|
| Industrial Technology | 2 | $29B |
|
||
| Insurance | 2 | $17B |
|
||
| Retail | 1 | $60B |
|
||
| Technology Distribution | 1 | $58B |
|
||
| Homebuilding | 1 | $35B |
|
||
| Technology Manufacturing | 1 | $35B |
|
||
Price history
+298.8% since first listed20 events — show timeline
- 2026-05-07 Pending — Stellar MLS as Distributed by MLS Grid
- 2026-02-20 Listing Removed — Stellar MLS as Distributed by MLS Grid
- 2026-02-17 Listed $79,750 Stellar MLS as Distributed by MLS Grid
- 2026-01-26 Relisted — Stellar MLS as Distributed by MLS Grid
- 2026-01-26 Price Changed $95,000 Stellar MLS as Distributed by MLS Grid
- 2026-01-22 Listing Removed — Stellar MLS as Distributed by MLS Grid
- 2025-08-22 Listed $105,000 Stellar MLS as Distributed by MLS Grid
- 2025-06-07 Listing Removed — Stellar MLS as Distributed by MLS Grid
- 2025-01-07 Relisted — Stellar MLS as Distributed by MLS Grid
- 2025-01-03 Listing Removed — Stellar MLS as Distributed by MLS Grid
- 2024-11-11 Price Changed $105,000 Stellar MLS as Distributed by MLS Grid
- 2024-09-19 Price Changed $130,000 Stellar MLS as Distributed by MLS Grid
- 2024-09-10 Relisted — Stellar MLS as Distributed by MLS Grid
- 2024-09-09 Listing Removed — Stellar MLS as Distributed by MLS Grid
- 2024-07-29 Price Changed $125,000 Stellar MLS as Distributed by MLS Grid
- 2024-03-10 Listed $140,000 Stellar MLS as Distributed by MLS Grid
- 2009-04-08 Sold (Public Records) $30,000 Public Records
- 1997-12-22 Sold (Public Records) $25,000 Public Records
- 1994-12-19 Sold (Public Records) $23,000 Public Records
- 1991-12-12 Sold (Public Records) $20,000 Public Records
Property tax history
+5.3%/yrLatest (2025): $1,236 · -2.8% YoY. Source: county tax records.
Cash-flow waterfall
monthlySold comps — $/sqft
last 12 mo · ≤1 miLoading sold comps…