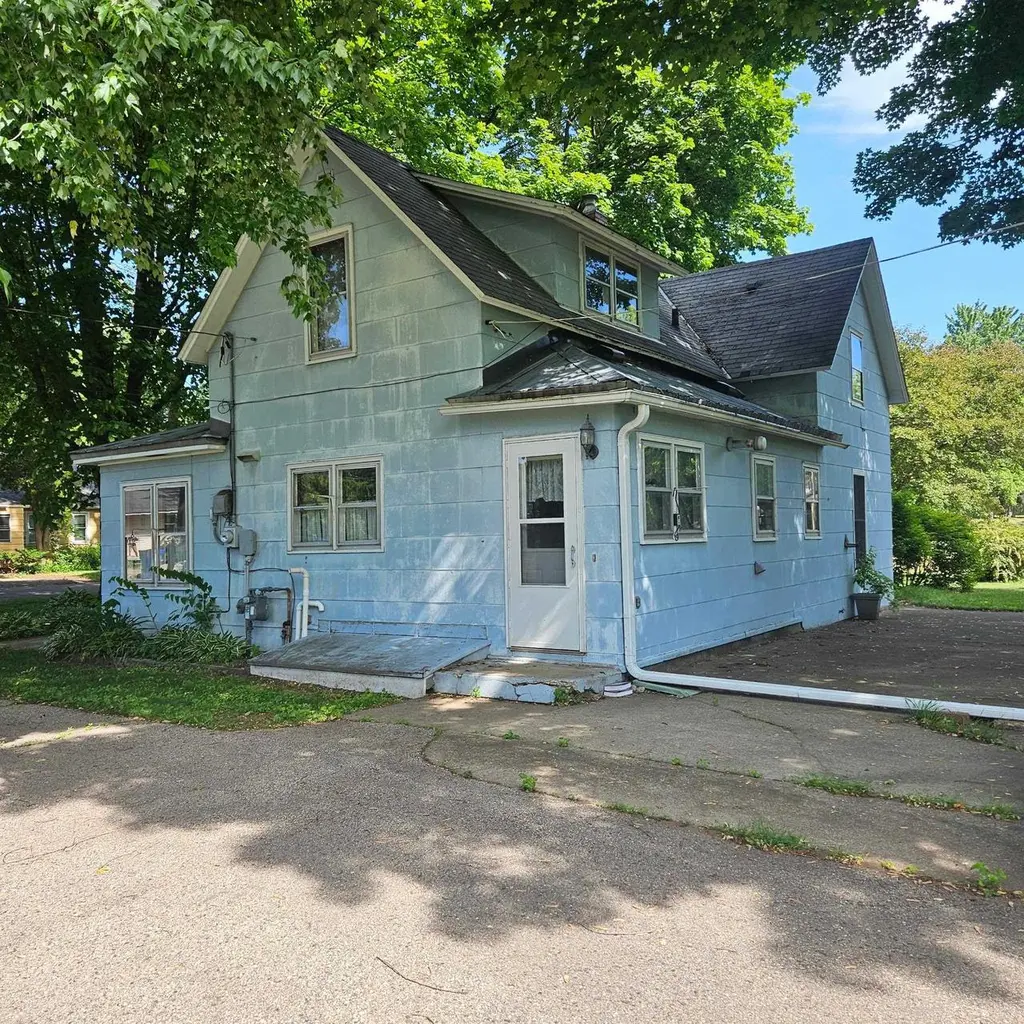
224 N Madison St · Coloma, WI
Flood risk 1/10 · Minimal
- FEMA flood zone
- X (unshaded)
- Chance of flooding over 30 yrs
- 0.0%
- Est. flood insurance / yr
- $473 – $860
Fire risk 3/10 · Minor
- Est. fire insurance / yr
- $636 – $1,182
Heat risk 1/10 · Minimal
- Hot days now (above 98°F)
- 7 days/yr
- Hot days in 30 yrs
- 13 days/yr
Wind risk 2/10 · Minimal
- Chance of severe wind over 30 yrs
- —
Air-quality risk 2/10 · Minimal
- Unhealthy air days now
- 0 days/yr
- Unhealthy air days in 30 yrs
- 1 days/yr
Risk factors via First Street. Map © Google.
Why this score? — see what drove the D grade
The composite is a weighted blend of 9 inputs, each scored 0–100. Each bar is that input's sub-score; the figure is the points it added to the 100-point composite (weight × sub-score).
- ARV discount +10.0/15.0
- Appreciation +10.0/10.0
- Cash flow +8.5/30.0
- Schools +3.3/10.0
- Livability +3.2/5.0
- Rent growth +2.5/5.0
- Condition / age +2.5/5.0
- DSCR +2.3/10.0
- 1% rule +2.0/10.0
$175,000
🖨 Deal sheet 📄 Offer letter ✓ Due diligence
Listing remarks MLS
Welcome to this 3 bedroom, 2 bathroom home located in the heart of Coloma. Situated on a beautiful corner lot, this property offers space, functionality, and small-town charm. This move-in ready home has been well kept over the years and offers a great opportunity for someone looking to add their own updates and modern touches. With a little TLC, you can truly make it your own while enjoying it comfortably from day one. The home is being offered semi-furnished, adding convenience and value for the next owner. Ample garage space featuring both a 1-car garage and an additional 2-car garage?room for vehicles, storage, hobbies, or a workshop setup. The paved driveways provide easy access and added curb appeal. Other Remarks -EF is Slate Buyer to verify measurements if material.
Key facts
- Den office space
- Four-season room
- Corner lot
Tags
Property features AI
Finance
- Other: Property located in the Village of Coloma
Exterior
- Parking: Detached garage with opener included; Total of 3 garage parking spaces (1-car and 2-car configurations listed)
- Utilities: Municipal water; Municipal sewer
- Home design: 1.5-story single-family home; Estimated finished above-grade area falls in 1501-1750 range; Built: see remarks; Zoned residential
- Construction: Information on year built listed as 'Other - See Remarks'
- Exterior features: Sun room (main level, approx. 19 x 8); Other exterior material/type
Interior
- Kitchen: Kitchen on the main level (approx. 20 x 11); Stove; Microwave
- Bedrooms: Master bedroom on the main level (approx. 9 x 14); Second bedroom on the upper level (approx. 12 x 15); Third bedroom on the upper level (approx. 11 x 14)
- Bathrooms: Two full bathrooms; No master bath
- Heating & cooling: Forced air heating; Natural gas heat
- Interior features: Crawl space
- Laundry & utility: Washer and dryer included
Neighborhood map
What this means for you Summary
Snapshot
- This is a 3-bed/2.0-bath single-family listed at $175k.
Deal economics
- At list price, monthly cash flow is $-155 ($-2k/yr) — negative.
- To cash-flow at today's rent, offer at most $148k (15.6% below list).
- To meet the 1% rule (rent ≥ 1% of price), the offer needs to be $123k (29.6% below list).
- Recommended offer: $123k (29.6% below list) — sets the bar for 1% rule.
Location & tenants
- Location reads 65/100 on livability (#509 in WI) — a middle-class / working-renter tenant base. Strengths: cost of living A+, housing A+; Watch: crime C-, health & safety D, amenities F.
- Westfield School District (rural): math 39% / reading 37% proficiency, ranked #195 of 342 in WI (top 57%) — families likely to look elsewhere, expect single-tenant / working-renter base with shorter leases.
- Market conditions: 18 active listings in the ZIP; 127 units permitted in Waushara County in 2024 (15 in 5+ unit buildings).
Forward outlook
- In year one you build about $19k of equity ($1k loan paydown + $18k appreciation (10.0% local appreciation)).
- Waushara County population projected at -25% by 2050 — secular population decline; favor cash flow + early exit over multi-decade hold.
- By year 2, paydown + projected appreciation supports a ~$30k cash-out refi (75% LTV) — recoverable capital for the next deal without selling this one.
Negotiation context
- Only 10 days on market — expect competitive offers; lowballing is unlikely to land.
- 3 sale attempts with the ask held roughly flat each time — persistent listings suggest the price (not the market) is what's stuck; bring a comps-based counter.
- Current owner paid $50k; list at $175k implies a 250% gain — meaningful room to come down on a strong offer.
Risks & watch-outs
- Watch-outs: built in 1900 — expect roof / HVAC / electrical / plumbing capex.
Questions for the listing agent
- What do current leases actually rent for vs. the listed asking? Can we see a recent rent roll and the last 12 months of T-12 income?
- Built in 1900 — when were the roof, HVAC, electrical panel, plumbing, and water heater last replaced?
- Is there a deadline driving the sale (1031 exchange, divorce, estate, relocation)? That informs how much negotiation room exists.
- The area grade is low — what's the realistic commute time and amenity access for the typical tenant pool here? Any planned neighborhood developments (good or bad) we should know about?
- What's the average days-on-market for RENTAL listings here right now (not sales)? A rising rental-DOM trend means longer vacancies and softer asking-rent achievability than the comps imply.
- What's the recent tenant-quality profile in this submarket — average credit score on applications, eviction rate, late-payment / NSF rate, and stable-employment percentage? A property-management company in the area should have these aggregated.
- How much new for-sale + rental construction is in the pipeline within 1–3 miles? Heavy new supply typically softens prices + rents 12–24 months out; constrained supply supports both.
Investment metrics
- 1% rule
- 0.70% ✗
- Cap rate
- 5.23%
- Cash-on-cash
- -3.78%
- DSCR
- 0.83
- GRM
- 11.8
CMA / ARV
- ARV (on-the-fly)
- $185,460
- Comps found
- 5
Show comp detail 5 sales within ~0.75 mi
| Address | Dist | Beds/Ba | Sqft | Sold | Price | $/sf | Match |
|---|---|---|---|---|---|---|---|
| 307 E Follett St | 0.08mi | 3/1.5 | 1,520 (-10%) | 15mo | $153,000 | $101 | 65 |
| 315 E Main St | 0.11mi | 4/1.0 (+1) | 1,800 (+7%) | 20mo | $145,000 | $81 | 58 |
| 309 N Rogers Rd | 0.26mi | 4/1.0 (+1) | 1,448 (-14%) | 2mo | $160,000 | $110 | 54 |
| 325 N Front St | 0.20mi | 3/1.0 | 1,504 (-11%) | 22mo | $180,000 | $120 | 50 |
| 330 E Parkway Dr | 0.55mi | 3/2.0 | 1,456 (-14%) | 22mo | $275,000 | $189 | 33 |
Match score weights: distance 35% · size 25% · config 20% · recency 20%. Top-matched comps best support the ARV.
Projected returns pro-forma
10.0% appreciation · 3.0% rent growth · sell at horizon
- IRR
- 21.6%
- Equity multiple
- 2.74×
- Total profit
- $85,437
- Equity at exit
- $157,654
- IRR
- 19.5%
- Equity multiple
- 6.29×
- Total profit
- $259,275
- Equity at exit
- $339,987
Cash invested: $49,000 (down + closing). Projections, not guarantees.
Landlord ↔ Tenant lean methodology
- Overall (STATE)
- 73 Landlord-Friendly
- State Wisconsin
- 73 Landlord-Friendly · R+2
- County
- — inherits STATE
- City
- — inherits STATE
ZIP-level market 54930
- Home prices YoY
- 14.5%
- Active inventory
- 18
- Price-to-rent
- 11.8×
Monthly cashflow live
- Estimated rent
- $1,233 medium interval (Pro) →
- Mortgage (P&I)
- −$918
- Tax from tax record
- −$138 /mo · $1,654/yr
- Insurance
- −$73
- HOA
- −$0
- Vacancy / Maint / Mgmt
- −$259
- Net cashflow
- $-155
Break-even live
UW: 25.0% down · 7.5% · 30yr · 1.5% tax · 5.0% vac · 8.0% maint · 8.0% mgmt
Financing live
Cash to close
- Down payment
- $43,750
- Closing costs
- $5,250
- Reserves months
- —
- Total cash needed
- —
Loan-product check · same deal, 3 products live
Conventional
25% down · 7.5% · 30yr
- Down + closing
- —
- Monthly P&I
- —
- Monthly cashflow
- —
- DSCR
- —
- Eligible?
- —
Personal DTI + credit; lowest rate.
DSCR
20% down · 8.5% · 30yr
- Down + closing
- —
- Monthly P&I
- —
- Monthly cashflow
- —
- DSCR
- —
- Eligible?
- —
No personal income docs; deal must DSCR.
Hard money
10% down · 12.0% · 12mo
- Down + closing
- —
- Monthly P&I
- —
- Monthly cashflow
- —
- DSCR
- —
- Eligible?
- —
Short-term bridge; refi at stabilization.
Listing history 8 events
-
2026-06-18days on market $175,000 Active 10 DOM
-
2026-06-17days on market $175,000 Active 9 DOM
-
2026-06-16days on market $175,000 Active 8 DOM
-
2026-06-15days on market $175,000 Active 7 DOM
-
2026-06-14days on market $175,000 Active 5 DOM
-
2026-06-10days on market $175,000 Active 2 DOM
-
2026-06-09remarks 699-char remark
-
2026-06-09$175,000 Active 1 DOM
ⓘ Source: listings_history table (triggers on properties + properties_extension) + one-shot
backfill from property_details.listing_events for pre-trigger history.
Tax reassessment forecast WI · Partial reset (capped growth)
- Current annual tax
- $1,654 · $138/mo
- Projected year-2 tax
- $2,446 · $204/mo
- Expected delta
- +$792/yr (+$66/mo · 47.9%)
ⓘ Screening estimate from a state-policy table — verify with the county assessor before closing.
Climate risk First Street
- Flood 1/10 Low FEMA zone X (unshaded) · 0% chance over 30 yrs
- Wildfire 3/10 Moderate
- Heat 1/10 Low 7 d/yr ≥98°F today · 13 d/yr by 30 yrs out
- Wind 2/10 Low
- Air quality 2/10 Low 0 unhealthy d/yr today · 1 by 30 yrs out
Nearby sold comps map
Loading sold comps map…
Walkable amenities ~0.75 mi
Loading nearby amenities…
Taxation est. · year 1
- Rental income
- $14,794
- − Mortgage interest
- −$9,803
- − Property taxes
- −$1,654
- − Insurance
- −$875
- − Repairs & maintenance
- −$1,184
- − Management
- −$1,184
- − Depreciation
- −$5,091
- Taxable loss
- −$4,996
- Est. tax savings @ 24.0%
- +$1,199
- After-tax cash flow
- $-655/yr
For passive investors: Depreciation is non-cash, so a rental often shows a tax loss while cash-flowing — sheltering income. Rental losses are passive: they offset passive income freely, and up to $25,000/yr can offset ordinary (W-2) income if you actively participate and your MAGI is under $100k (phasing out to $0 by $150k); unused losses carry forward. On sale, claimed depreciation is recaptured at up to 25%, and gains may owe capital-gains tax (a 1031 exchange can defer both). Figures are a year-1 estimate at your 24.0% rate — not tax advice; consult a CPA.
Schools (NCES district)
- District
- Westfield School District
- NCES district ID
- 5516440
- Math proficiency
- 39% ▲ 4.00%
- Reading proficiency
- 37% ▬ 0.00%
- Median HH income
- $46,419
- Composite
- 32.51/100
- National rank
- #5702
- State rank
- #195 of 342 in WI
Livability — Coloma
- Score
- 65/100
- State rank
- #509
- US rank
- #12861
Category grades
Schools grade is shown separately in the Schools card above.
Census & demographics
- Census place
- Coloma, WI
- Population (ZIP)
- 1,835
Population outlook (Waushara County) Hauer SSP2
- Today (2025)
- 22,669 people
- By 2030
- 21,697 · -4.3%
- By 2040
- 19,329 · -14.7%
- By 2050
- 17,051 · -24.8%
- By 2075
- 13,928 · -38.6%
- By 2100
- 11,483 · -49.3%
Race, ethnicity, and origin ACS 2023
- Neighborhood character
- Predominantly White (94%)
- Race & ethnicity
- White 94% Two or more races 4% Hispanic / Latino 2%
- Common ancestry
- Romanian 7% Portuguese 4% Lithuanian 1%
- Foreign-born
- 2%
- Languages at home
- 82% English-only · German/W. Germanic 14% Spanish 2%
Political lean MEDSL · Waushara
- 2024 margin
- Solid R (+35.2) · D 31.8% · R 67.0% · Other 1.1%
- 2008→2024 swing
- -36.0pp toward R · 2008: 0.8pp · 2024: -35.2pp
- All cycles
- 2024: R+35.2 2020: R+34.1 2016: R+32.3 2012: R+10.2 2008: D+0.8
Not yet ingested
- Civics
- —
Market trends
- HPI YoY
- ▲ 32.56%
- Current HPI
- 257.539
- Rent YoY
- —
- Metro
- —
- State GDP YoY
- ▲ 2.10%
- F500 in state
- 20
Industry mix (Fortune 500 HQ in WI)
| Industry | F500 HQs | Revenue |
|---|---|---|
| Industrial Machinery | 4 | $23B |
|
||
| Industrial Technology | 2 | $36B |
|
||
| Insurance | 1 | $36B |
|
||
| Professional Services | 1 | $19B |
|
||
| Utilities | 1 | $9B |
|
||
| Consumer Goods | 1 | $3B |
|
||
Price history
+250.0% since first listed7 events — show timeline
- 2026-06-07 Listed $175,000 SCWMLS
- 2026-05-11 Listing Removed — RANW
- 2026-04-09 Relisted — RANW
- 2026-03-24 Contingent — RANW
- 2026-03-17 Price Changed $175,000 RANW
- 2026-03-03 Listed $190,000 RANW
- 2009-08-21 Sold (Public Records) $50,000 Public Records
Property tax history
+2.2%/yrLatest (2025): $1,654 · +6.4% YoY. Source: county tax records.
Cash-flow waterfall
monthlySold comps — $/sqft
last 12 mo · ≤1 miLoading sold comps…