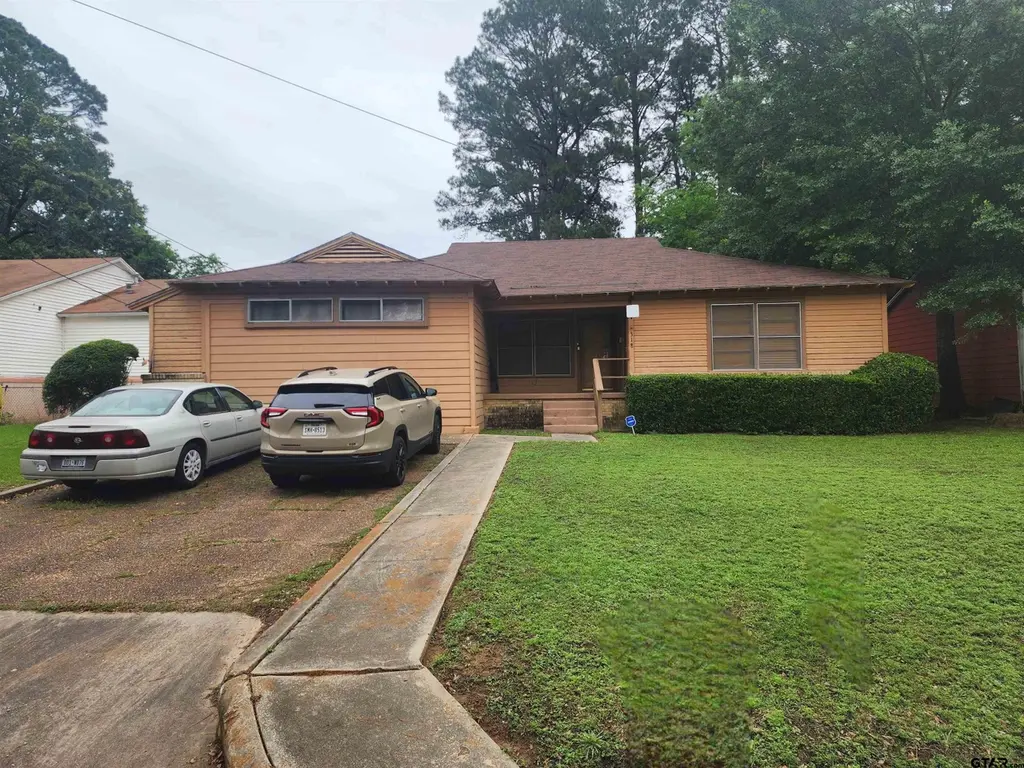
318 Milligan Dr · Pittsburg, TX
Flood risk 1/10 · Minimal
- FEMA flood zone
- X
- Chance of flooding over 30 yrs
- 0.0%
- Est. flood insurance / yr
- $507 – $1,088
Fire risk 5/10 · Moderate
- Est. fire insurance / yr
- $1,222 – $2,270
Heat risk 7/10 · Major
- Hot days now (above 111°F)
- 7 days/yr
- Hot days in 30 yrs
- 24 days/yr
Wind risk 6/10 · Moderate
- Chance of severe wind over 30 yrs
- 27.0%
Air-quality risk 2/10 · Minimal
- Unhealthy air days now
- 1 days/yr
- Unhealthy air days in 30 yrs
- 1 days/yr
Risk factors via First Street. Map © Google.
Why this score? — see what drove the B+ grade
The composite is a weighted blend of 9 inputs, each scored 0–100. Each bar is that input's sub-score; the figure is the points it added to the 100-point composite (weight × sub-score).
- Cash flow +30.0/30.0
- ARV discount +15.0/15.0
- 1% rule +10.0/10.0
- DSCR +10.0/10.0
- Schools +4.1/10.0
- Livability +3.8/5.0
- Rent growth +2.5/5.0
- Condition / age +2.5/5.0
- Appreciation +0.0/10.0
$139,999
🖨 Deal sheet 📄 Offer letter ✓ Due diligence
Listing remarks
This versatile property is currently a 4-bedroom, 2-bath home but was originally designed as a duplex, featuring two separate 2-bedroom, 1-bath units. Each side still maintains its own kitchen, bathroom, and private exterior entrance, making it easy to convert back if desired. Whether you’re looking for a spacious home for a large family or a great investment opportunity, this property offers endless possibilities. Live in one side and rent out the other, or maximize income by restoring it to a full duplex—this one is full of potential!
Key facts
- Built 1956
- Listed 49 days
Property features AI
Exterior
- Parking: Concrete parking
- Security: Smoke detector(s)
- Utilities: Public water; Public sewer
- Home design: Single family detached residence; Single-story
- Exterior features: Porch; Chain link fencing; Composition roof
Interior
- Kitchen: Electric oven; Electric range
- Flooring: Carpet
- Bathrooms: 2 full bathrooms
- Heating & cooling: Central heating (natural gas); Central air conditioning
- Interior features: Electric oven and electric range; Ceiling fans; Smoke detectors
Neighborhood map
What this means for you Summary
Snapshot
- This is a 4-bed/2.0-bath single-family listed at $140k.
Deal economics
- At list price, monthly cash flow is $861 ($10k/yr) — positive.
- The deal already cash-flows at list — no discount required.
- Meets the 1% rule at list price ($2k rent vs $140k).
- Recommended offer: $136k (3.0% below list) — sets the bar for market timing.
- Cap rate 13.7% vs local median 5.1% in Pittsburg — top-decile yield for the area; either an underpriced asset or a hidden risk that comps aren't pricing in. Stress-test before assuming the spread holds.
Location & tenants
- Location reads 75/100 on livability (#144 in TX, #4,098 nationally) — a middle-class / working-renter tenant base. Strengths: cost of living A+, housing A+, health & safety A; Watch: crime C-, amenities D+, employment D+.
- Pittsburg ISD (town): math 54% / reading 44% proficiency, ranked #216 of 826 in TX (top 26%) — families likely to look elsewhere, expect single-tenant / working-renter base with shorter leases; 68% free/reduced lunch — lower-income household profile, screen leases tightly.
- Zoned schools: Pittsburg El (math 34% / reading 35%, grade F, #1,995 of 4,322 statewide, top 50%, 545 students, 80% FRL); Pittsburg J H (math 48% / reading 43%, grade D+, #470 of 1,662 statewide, top 29%, 349 students, 82% FRL); Pittsburg H S (math 62% / reading 52%, grade C, #333 of 1,632 statewide, top 22%, 726 students, 78% FRL).
- Market conditions: 313 active listings in the ZIP; 1 comparable units currently listed for rent nearby; 3 units permitted in Camp County in 2024 (0 in 5+ unit buildings).
Forward outlook
- Local home prices are declining (-3.0%/yr); year-one equity from $968 of loan paydown is wiped out by about $4k of value loss. Plan a longer hold.
- Camp County population projected at +13% by 2050 — modest demand growth; plan on rents tracking national, not racing it.
- At projected returns (-3.0% appreciation + 3.0% rent growth), your $39k cash investment doubles in ~5 years — after that, you're playing with house money.
Negotiation context
- It's been on market 50 days — a 3% lower offer ($136k) is reasonable based on typical stale-listing flexibility.
- 5 sale attempts since 3y ago with the ask held roughly flat each time — persistent listings suggest the price (not the market) is what's stuck; bring a comps-based counter.
Risks & watch-outs
- Watch-outs: built in 1956 — expect roof / HVAC / electrical / plumbing capex.
- Climate carrying-cost: major wind risk, 27% chance of damaging wind over 30y; moderate wildfire risk; extreme-heat days projected 7→24/yr by 2055 (HVAC capex compounding) — expect insurance premiums to compound above CPI over the hold.
Questions for the listing agent
- It's been on market 50 days. Have you received any prior offers? Is the seller open to a 3% concession, seller financing, or rate buy-down credit?
- Built in 1956 — when were the roof, HVAC, electrical panel, plumbing, and water heater last replaced?
- Is there a deadline driving the sale (1031 exchange, divorce, estate, relocation)? That informs how much negotiation room exists.
- Schools are B-rated — typically a magnet for longer-tenancy family renters. What's the average tenant stay here, and is there a school-zone premium baked into asking?
- What's the average days-on-market for RENTAL listings here right now (not sales)? A rising rental-DOM trend means longer vacancies and softer asking-rent achievability than the comps imply.
- What's the recent tenant-quality profile in this submarket — average credit score on applications, eviction rate, late-payment / NSF rate, and stable-employment percentage? A property-management company in the area should have these aggregated.
- How much new for-sale + rental construction is in the pipeline within 1–3 miles? Heavy new supply typically softens prices + rents 12–24 months out; constrained supply supports both.
Investment metrics
- 1% rule
- 1.64% ✓
- Cap rate
- 13.67%
- Cash-on-cash
- 26.35%
- DSCR
- 2.17
- GRM
- 5.1
CMA / ARV
- ARV (median comp)
- $210,759
- List price
- $139,999
- Delta
- -33.57%
- Verdict
- UNDERPRICED
- Comps
- 16 within 1.0 mi
Show comp detail 2 sales within ~0.75 mi
| Address | Dist | Beds/Ba | Sqft | Sold | Price | $/sf | Match |
|---|---|---|---|---|---|---|---|
| 608 Lafayette | 0.29mi | 3/2.0 (-1) | 1,844 (-8%) | 16mo | $100,000 | $54 | 55 |
| 117 Mockingbird Ln | 0.54mi | 3/4.0 (-1) | 2,200 (+10%) | 15mo | $419,000 | $190 | 33 |
Match score weights: distance 35% · size 25% · config 20% · recency 20%. Top-matched comps best support the ARV.
Projected returns pro-forma
-3.0% appreciation · 3.0% rent growth · sell at horizon
- IRR
- 20.1%
- Equity multiple
- 1.82×
- Total profit
- $32,168
- Equity at exit
- $20,874
- IRR
- 28.4%
- Equity multiple
- 3.52×
- Total profit
- $98,721
- Equity at exit
- $12,105
Cash invested: $39,200 (down + closing). Projections, not guarantees.
Landlord ↔ Tenant lean methodology
- Overall (STATE)
- 87 Strongly Landlord-Friendly
- State Texas
- 87 Strongly Landlord-Friendly · R+5
- County
- — inherits STATE
- City
- — inherits STATE
ZIP-level market 75686
- Home prices YoY
- -21.6%
- Active inventory
- 313
- Price-to-rent
- 5.1×
Monthly cashflow live
- Estimated rent
- $2,300 medium interval (Pro) →
- Mortgage (P&I)
- −$734
- Tax from tax record
- −$164 /mo · $1,964/yr
- Insurance
- −$58
- HOA
- −$0
- Vacancy / Maint / Mgmt
- −$483
- Net cashflow
- $861
Break-even live
UW: 25.0% down · 7.5% · 30yr · 1.5% tax · 5.0% vac · 8.0% maint · 8.0% mgmt
Financing live
Cash to close
- Down payment
- $35,000
- Closing costs
- $4,200
- Reserves months
- —
- Total cash needed
- —
Loan-product check · same deal, 3 products live
Conventional
25% down · 7.5% · 30yr
- Down + closing
- —
- Monthly P&I
- —
- Monthly cashflow
- —
- DSCR
- —
- Eligible?
- —
Personal DTI + credit; lowest rate.
DSCR
20% down · 8.5% · 30yr
- Down + closing
- —
- Monthly P&I
- —
- Monthly cashflow
- —
- DSCR
- —
- Eligible?
- —
No personal income docs; deal must DSCR.
Hard money
10% down · 12.0% · 12mo
- Down + closing
- —
- Monthly P&I
- —
- Monthly cashflow
- —
- DSCR
- —
- Eligible?
- —
Short-term bridge; refi at stabilization.
Rent comps 1 comps
| Address | Beds | Baths | Sqft | Rent | $/sqft | DOM | Units | Dist |
|---|---|---|---|---|---|---|---|---|
| 421 Mount Pleasant St Pittsburg, TX | 3.0 | 2.0 | 2305 | $2,300 | $1.00 | 13d | 1 | 0.95mi |
Listing history 28 events
-
2026-06-19days on market $139,999 Active 50 DOM
-
2026-06-18days on market $139,999 Active 49 DOM
-
2026-06-17days on market $139,999 Active 48 DOM
-
2026-06-16days on market $139,999 Active 47 DOM
-
2026-06-15days on market $139,999 Active 46 DOM
-
2026-06-14days on market $139,999 Active 44 DOM
-
2026-06-12days on market $139,999 Active 43 DOM
-
2026-06-09days on market $139,999 Active 40 DOM
-
2026-06-08days on market $139,999 Active 39 DOM
-
2026-06-07days on market $139,999 Active 38 DOM
-
2026-06-05days on market $139,999 Active 36 DOM
-
2026-06-03days on market $139,999 Active 34 DOM
-
2026-06-02days on market $139,999 Active 33 DOM
-
2026-06-01days on market $139,999 Active 32 DOM
-
2026-05-31days on market $139,999 Active 31 DOM
-
2026-05-30days on market $139,999 Active 30 DOM
-
2026-04-30$139,999 Active 554-char remark
-
2026-03-23historical
-
2026-03-17price $138,000
-
2026-03-09$140,000 Active
-
2024-10-23historical
-
2024-10-23historical
-
2024-02-16$199,900 Active
-
2024-01-31$199,900 Active
-
2024-01-24historical
-
2023-12-05price $199,900
-
2023-10-21$250,000 Active
-
2007-06-15soldstatus
ⓘ Source: listings_history table (triggers on properties + properties_extension) + one-shot
backfill from property_details.listing_events for pre-trigger history.
Tax reassessment forecast TX · Resets to sale price
- Current annual tax
- $1,964 · $164/mo
- Projected year-2 tax
- $2,562 · $213/mo
- Expected delta
- +$598/yr (+$50/mo · 30.4%)
ⓘ Screening estimate from a state-policy table — verify with the county assessor before closing.
Climate risk First Street
- Flood 1/10 Low FEMA zone X · 0% chance over 30 yrs
- Wildfire 5/10 Major
- Heat 7/10 Severe 7 d/yr ≥111°F today · 24 d/yr by 30 yrs out
- Wind 6/10 Major 27% chance of damaging wind over 30 yrs
- Air quality 2/10 Low 1 unhealthy d/yr today · 1 by 30 yrs out
Nearby sold comps map
Loading sold comps map…
Walkable amenities ~0.75 mi
Loading nearby amenities…
Taxation est. · year 1
- Rental income
- $27,600
- − Mortgage interest
- −$7,842
- − Property taxes
- −$1,964
- − Insurance
- −$700
- − Repairs & maintenance
- −$2,208
- − Management
- −$2,208
- − Depreciation
- −$4,073
- Taxable income
- $8,605
- Est. tax owed @ 24.0%
- −$2,065
- After-tax cash flow
- $8,265/yr
For passive investors: Depreciation is non-cash, so a rental often shows a tax loss while cash-flowing — sheltering income. Rental losses are passive: they offset passive income freely, and up to $25,000/yr can offset ordinary (W-2) income if you actively participate and your MAGI is under $100k (phasing out to $0 by $150k); unused losses carry forward. On sale, claimed depreciation is recaptured at up to 25%, and gains may owe capital-gains tax (a 1031 exchange can defer both). Figures are a year-1 estimate at your 24.0% rate — not tax advice; consult a CPA.
Schools (NCES district)
- District
- Pittsburg ISD
- NCES district ID
- 4835010
- Math proficiency
- 54% ▼ -16.00%
- Reading proficiency
- 44% ▼ -16.00%
- Median HH income
- $38,136
- Composite
- 40.87/100
- National rank
- #3627
- State rank
- #216 of 826 in TX
Livability — Pittsburg
- Score
- 75/100
- State rank
- #144
- US rank
- #4098
Category grades
Schools grade is shown separately in the Schools card above.
Census & demographics
- Census place
- Pittsburg, TX
- Population (ZIP)
- 13,427
Population outlook (Camp County) Hauer SSP2
- Today (2025)
- 13,403 people
- By 2030
- 13,741 · +2.5%
- By 2040
- 14,436 · +7.7%
- By 2050
- 15,135 · +12.9%
- By 2075
- 16,836 · +25.6%
- By 2100
- 17,582 · +31.2%
Race, ethnicity, and origin ACS 2023
- Neighborhood character
- Diverse neighborhood (Simpson 0.63)
- Race & ethnicity
- White 52% Hispanic / Latino 28% Two or more races 16% Black 14% Asian 1%
- Hispanic origin (detail)
- Mexican 25%
- Common ancestry
- Slovak 1% Scottish 1% Serbian 1%
- Foreign-born
- 11% · Canada, Vietnam, Dominican Republic
- Languages at home
- 79% English-only · Spanish 20% Vietnamese 1%
Political lean MEDSL · Camp
- 2024 margin
- Solid R (+53.6) · D 22.9% · R 76.5%
- 2008→2024 swing
- -30.3pp toward R · 2008: -23.3pp · 2024: -53.6pp
- All cycles
- 2024: R+53.6 2020: R+44.1 2016: R+42.7 2012: R+33.5 2008: R+23.3
Not yet ingested
- Civics
- —
Market trends
- HPI YoY
- ▼ -50.12%
- Current HPI
- 181.5522
- Rent YoY
- —
- Metro
- —
- State GDP YoY
- ▲ 3.95%
- F500 in state
- 110
Industry mix (Fortune 500 HQ in TX)
| Industry | F500 HQs | Revenue |
|---|---|---|
| Energy | 16 | $1,198B |
|
||
| Technology | 5 | $198B |
|
||
| Engineering / Construction | 4 | $72B |
|
||
| Energy Services | 3 | $60B |
|
||
| Utilities | 3 | $41B |
|
||
| Healthcare | 2 | $330B |
|
||
Price history
-44.0% since first listed12 events — show timeline
- 2026-04-30 Listed $139,999 GTAR
- 2026-03-23 Listing Removed — NTREIS
- 2026-03-17 Price Changed $138,000 NTREIS
- 2026-03-09 Listed $140,000 NTREIS
- 2024-10-23 Listing Removed — NTREIS
- 2024-10-23 Listing Removed — NTREIS
- 2024-02-16 Listed $199,900 NTREIS
- 2024-01-31 Listed $199,900 NTREIS
- 2024-01-24 Listing Removed — NTREIS
- 2023-12-05 Price Changed $199,900 NTREIS
- 2023-10-21 Listed $250,000 NTREIS
- 2007-06-15 Sold (Public Records) — Public Records
Property tax history
+2.2%/yrLatest (2025): $1,964 · +10.1% YoY. Source: county tax records.
Cash-flow waterfall
monthlySold comps — $/sqft
last 12 mo · ≤1 miLoading sold comps…