2 Barker Dr · Duluth, MN
Flood risk 1/10 · Minimal
- FEMA flood zone
- X
- Chance of flooding over 30 yrs
- 0.0%
- Est. flood insurance / yr
- $507 – $1,088
Fire risk 3/10 · Minor
- Est. fire insurance / yr
- $888 – $1,650
Heat risk 2/10 · Minimal
- Hot days now (above 90°F)
- 7 days/yr
- Hot days in 30 yrs
- 13 days/yr
Wind risk 1/10 · Minimal
- Chance of severe wind over 30 yrs
- —
Air-quality risk 1/10 · Minimal
- Unhealthy air days now
- 0 days/yr
- Unhealthy air days in 30 yrs
- 0 days/yr
Risk factors via First Street. Map © Google.
Why this score? — see what drove the F grade
The composite is a weighted blend of 9 inputs, each scored 0–100. Each bar is that input's sub-score; the figure is the points it added to the 100-point composite (weight × sub-score).
- Cash flow +12.6/30.0
- Schools +4.2/10.0
- Livability +4.1/5.0
- DSCR +3.7/10.0
- 1% rule +3.6/10.0
- Rent growth +2.5/5.0
- Condition / age +2.2/5.0
- ARV discount +2.1/15.0
- Appreciation +0.0/10.0
$169,900
🖨 Deal sheet (PDF) 📄 Offer letter ✓ Due diligence
Listing remarks
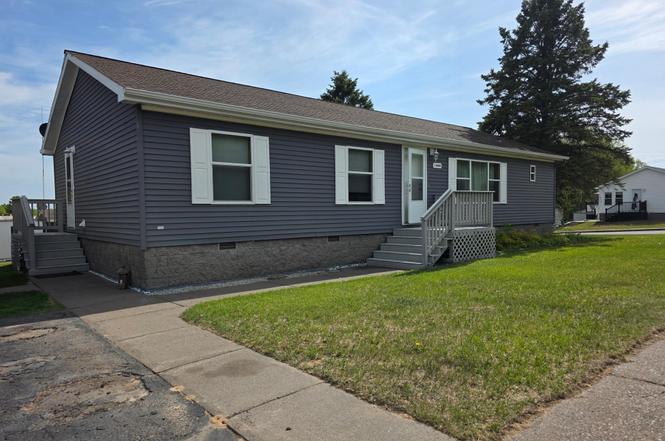
2007 3 bedroom, 2 bath manufactured Home in Vintage Acres awaits its new owner. The home features a kitchen island & pantry, large master suite, & laundry of the side door. Outside you'll find a large deck off your dining room & a nice 3-car garage on a corner lot. Home is close by playgrounds. Park approval required. Call for your appointment today.
Key facts
- Pantry
- Large deck
- Close by playgrounds
Tags
Property features AI
Finance
- Other: Above-grade finished living area approximately 1,404 square feet; Main-level finished area approximately 1,404 square feet
- HOA & community: Land is leased (land lease fee listed separately)
Exterior
- Parking: Asphalt driveway; 3-car detached garage (garage dimensions approximately 28 x 32)
- Utilities: City water connected; City sewer connected; Natural gas service
- Home design: Residential single-story manufactured home; One level; Slab foundation; Entry faces unspecified direction
- Construction: Asphalt roof; Foundation dimensions approximately 27 x 52
- Exterior features: Vinyl siding; Deck; Corner lot; Paved street frontage
Interior
- Kitchen: Dishwasher; Microwave; Range; Refrigerator; Electric water heater
- Bedrooms: 3 bedrooms, all on the main level
- Bathrooms: 2 full bathrooms (including a full primary and a main-floor full bath)
- Heating & cooling: Forced air heat; No central air
- Interior features: Open kitchen/dining area; Crawl space basement; No internal stairs (single-level living)
- Laundry & utility: Washer and dryer; Main-level laundry in hall
Neighborhood map
What this means for you Summary
Snapshot
- This is a 3-bed/2.0-bath single-family listed at $170k. Condition is rated fair.
Deal economics
- At list price, monthly cash flow is $-23 ($-276/yr) — negative.
- To cash-flow at today's rent, offer at most $167k (2.0% below list).
- To meet the 1% rule (rent ≥ 1% of price), the offer needs to be $146k (14.2% below list).
- Recommended offer: $146k (14.2% below list) — sets the bar for 1% rule.
- Cap rate 6.1% vs local median 4.9% in Duluth — meaningfully above typical; check what's discounted (condition, days-on-market, listing class) to confirm the premium yield is real.
Location & tenants
- Location reads 82/100 on livability (#36 in MN, #1,060 nationally) — a professional / high-income tenant draw. Strengths: commute A+, cost of living A+, housing A+; Watch: amenities F.
- Duluth Public School District (urban): math 44% / reading 55% proficiency, ranked #132 of 301 in MN (top 44%) — families likely to look elsewhere, expect single-tenant / working-renter base with shorter leases.
- Zoned schools: Stowe Elementary (math 37% / reading 52%, grade F, #534 of 857 statewide, top 66%, 239 students, 70% FRL); Lincoln Park Middle School (math 26% / reading 39%, grade F, #186 of 258 statewide, top 72%, 524 students, 66% FRL); Denfeld High School (math 32% / reading 42%, grade F, #282 of 471 statewide, top 63%, 940 students, 56% FRL) — zoned schools average 64% FRL vs 39% district-wide (25 pts higher); higher-poverty schools than district average — tighter screening recommended.
- Market conditions: 36 active listings in the ZIP; 639 units permitted in St. Louis County in 2024 (338 in 5+ unit buildings).
Forward outlook
- Local home prices are declining (-3.0%/yr); year-one equity from $1k of loan paydown is wiped out by about $5k of value loss. Plan a longer hold.
Negotiation context
- Only 3 days on market — expect competitive offers; lowballing is unlikely to land.
- 2 sale attempts with the ask held roughly flat each time — persistent listings suggest the price (not the market) is what's stuck; bring a comps-based counter.
Questions for the listing agent
- What do current leases actually rent for vs. the listed asking? Can we see a recent rent roll and the last 12 months of T-12 income?
- Have any recent inspections been done? Can we get a copy of the seller's disclosures and any deferred-maintenance estimates?
- Is there a deadline driving the sale (1031 exchange, divorce, estate, relocation)? That informs how much negotiation room exists.
- Schools are B-rated — typically a magnet for longer-tenancy family renters. What's the average tenant stay here, and is there a school-zone premium baked into asking?
- The area grade is low — what's the realistic commute time and amenity access for the typical tenant pool here? Any planned neighborhood developments (good or bad) we should know about?
- What's the average days-on-market for RENTAL listings here right now (not sales)? A rising rental-DOM trend means longer vacancies and softer asking-rent achievability than the comps imply.
- What's the recent tenant-quality profile in this submarket — average credit score on applications, eviction rate, late-payment / NSF rate, and stable-employment percentage? A property-management company in the area should have these aggregated.
- How much new for-sale + rental construction is in the pipeline within 1–3 miles? Heavy new supply typically softens prices + rents 12–24 months out; constrained supply supports both.
Investment metrics
- 1% rule
- 0.86% ✗
- Cap rate
- 6.13%
- Cash-on-cash
- -0.58%
- DSCR
- 0.97
- GRM
- 9.7
CMA / ARV
- ARV (on-the-fly)
- $151,632
- Comps found
- 8
Show comp detail 8 sales within ~0.75 mi
| Address | Dist | Beds/Ba | Sqft | Sold | Price | $/sf | Match |
|---|---|---|---|---|---|---|---|
| 801 W Stowe St | 0.18mi | 3/2.0 | 1,344 (-4%) | 7mo | $145,000 | $108 | 79 |
| 5 Barker Dr | 0.04mi | 3/2.0 | 1,280 (-9%) | 10mo | $48,900 | $38 | 75 |
| 9 Bubalo Dr | 0.12mi | 3/2.0 | 1,228 (-12%) | 17mo | $53,000 | $43 | 59 |
| 1123 104th Ave Ave W | 0.56mi | 2/2.0 (-1) | 1,451 (+3%) | 8mo | $193,000 | $133 | 57 |
| 24 George Pine Cr Cir | 0.34mi | 3/2.0 | 1,216 (-13%) | 6mo | $57,000 | $47 | 57 |
| 1127 104th Ave Ave W | 0.57mi | 2/2.0 (-1) | 1,398 (-0%) | 22mo | $197,000 | $141 | 49 |
| 13 Griak Dr | 0.39mi | 3/2.0 | 1,216 (-13%) | 22mo | $65,000 | $53 | 41 |
| 1311 104th Ave Ave W | 0.70mi | 2/1.5 (-1) | 1,319 (-6%) | 20mo | $210,000 | $159 | 33 |
Match score weights: distance 35% · size 25% · config 20% · recency 20%. Top-matched comps best support the ARV.
Projected returns pro-forma
-3.0% appreciation · 3.0% rent growth · sell at horizon
- IRR
- -17.2%
- Equity multiple
- 0.39×
- Total profit
- $-28,977
- Equity at exit
- $25,333
- IRR
- -9.2%
- Equity multiple
- 0.43×
- Total profit
- $-27,032
- Equity at exit
- $14,690
Cash invested: $47,572 (down + closing). Projections, not guarantees.
Landlord ↔ Tenant lean methodology
- Overall (STATE)
- 46 Balanced
- State Minnesota
- 46 Balanced · D+2
- County
- — inherits STATE
- City
- — inherits STATE
ZIP-level market 55808
- Home prices YoY
- -29.8%
- Active inventory
- 36
- Price-to-rent
- 9.7×
Monthly cashflow live
- Estimated rent
- $1,457 medium interval (Pro) →
- Mortgage (P&I)
- −$891
- Tax est. 1.5%
- −$212 /mo · $2,548/yr
- Insurance
- −$71
- HOA
- −$0
- Vacancy / Maint / Mgmt
- −$306
- Net cashflow
- $-23
Break-even live
Sensitivity live
| Price | -10% $94 | -5% $36 | +0% $-23 | +5% $-82 | +10% $-140 |
|---|---|---|---|---|---|
| Rent | -10% $-138 | -5% $-81 | +0% $-23 | +5% $35 | +10% $92 |
| Rate | -1.0pp $63 | -0.5pp $20 | base $-23 | +0.5pp $-67 | +1.0pp $-112 |
UW: 25.0% down · 7.5% · 30yr · 1.5% tax · 5.0% vac · 8.0% maint · 8.0% mgmt
Financing live
Cash to close
- Down payment
- $42,475
- Closing costs
- $5,097
- Reserves months
- —
- Total cash needed
- —
Loan-product check · same deal, 3 products live
Conventional
25% down · 7.5% · 30yr
- Down + closing
- —
- Monthly P&I
- —
- Monthly cashflow
- —
- DSCR
- —
- Eligible?
- —
Personal DTI + credit; lowest rate.
DSCR
20% down · 8.5% · 30yr
- Down + closing
- —
- Monthly P&I
- —
- Monthly cashflow
- —
- DSCR
- —
- Eligible?
- —
No personal income docs; deal must DSCR.
Hard money
10% down · 12.0% · 12mo
- Down + closing
- —
- Monthly P&I
- —
- Monthly cashflow
- —
- DSCR
- —
- Eligible?
- —
Short-term bridge; refi at stabilization.
Listing history 3 events
-
2026-06-21days on market $169,900 Active 3 DOM
-
2026-06-19remarks 357-char remark
-
2026-06-19$169,900 Active 1 DOM
ⓘ Source: listings_history table (triggers on properties + properties_extension) + one-shot
backfill from property_details.listing_events for pre-trigger history.
Climate risk First Street
- Flood 1/10 Low FEMA zone X · 0% chance over 30 yrs
- Wildfire 3/10 Moderate
- Heat 2/10 Low 7 d/yr ≥90°F today · 13 d/yr by 30 yrs out
- Wind 1/10 Low
- Air quality 1/10 Low 0 unhealthy d/yr today · 0 by 30 yrs out
Nearby sold comps map
Loading sold comps map…
Walkable amenities ~0.75 mi
Loading nearby amenities…
Taxation est. · year 1
- Rental income
- $17,485
- − Mortgage interest
- −$9,517
- − Property taxes
- −$2,548
- − Insurance
- −$850
- − Repairs & maintenance
- −$1,399
- − Management
- −$1,399
- − Depreciation
- −$4,943
- Taxable loss
- −$3,170
- Est. tax savings @ 24.0%
- +$761
- After-tax cash flow
- $484/yr
For passive investors: Depreciation is non-cash, so a rental often shows a tax loss while cash-flowing — sheltering income. Rental losses are passive: they offset passive income freely, and up to $25,000/yr can offset ordinary (W-2) income if you actively participate and your MAGI is under $100k (phasing out to $0 by $150k); unused losses carry forward. On sale, claimed depreciation is recaptured at up to 25%, and gains may owe capital-gains tax (a 1031 exchange can defer both). Figures are a year-1 estimate at your 24.0% rate — not tax advice; consult a CPA.
Condition & rehab AI · 2 photos
This single-family home requires moderate renovations, focusing on roof replacement, exterior repairs, and landscaping to significantly enhance its value.
Repairs flagged
- Major roof — Signs of wear and tear
- Major siding — Weathered and peeling
- Major fencing — Old and in need of repair
Value-add opportunities
- Both Landscaping and fencing repair — Enhances curb appeal and property value
- Both Roof replacement — Critical for structural integrity and long-term value
Renovation cost estimate screening
| Repair item | Severity | Est. cost |
|---|---|---|
| roof · Signs of wear and tear | Major | $15,000–50,000 |
| siding · Weathered and peeling | Major | $15,000–50,000 |
| fencing · Old and in need of repair | Major | $15,000–50,000 |
| Total estimated repair cost · 3 items | $45,000–150,000 |
Value-add ROI direction
- Both Landscaping and fencing repair — Enhances curb appeal and property value ↑
- Both Roof replacement — Critical for structural integrity and long-term value ↑
ⓘ Cost ranges are severity-bucket heuristics (US national rule-of-thumb). Get contractor quotes + a written scope before underwriting a rehab budget.
Schools (NCES district)
- District
- Duluth Public School District
- NCES district ID
- 2711040
- Math proficiency
- 44% ▼ -10.00%
- Reading proficiency
- 55% ▼ -6.00%
- Median HH income
- $45,692
- Composite
- 41.92/100
- National rank
- #3360
- State rank
- #132 of 301 in MN
Livability — Duluth
- Score
- 82/100
- State rank
- #36
- US rank
- #1060
Category grades
Schools grade is shown separately in the Schools card above.
Census & demographics
- Census place
- Duluth, MN
- City population
- 71,097
- Population (ZIP)
- 5,325
Population outlook (St. Louis County) Hauer SSP2
- Today (2025)
- 202,411 people
- By 2030
- 203,234 · +0.4%
- By 2040
- 202,520 · +0.1%
- By 2050
- 200,853 · -0.8%
- By 2075
- 200,943 · -0.7%
- By 2100
- 192,058 · -5.1%
Race, ethnicity, and origin ACS 2023
- Neighborhood character
- Predominantly White (90%)
- Race & ethnicity
- White 90% Two or more races 6% Native American 3% Hispanic / Latino 1%
- Common ancestry
- Portuguese 14% Romanian 8% Lithuanian 5%
- Foreign-born
- 1% · Canada
Political lean MEDSL · St. Louis
- 2024 margin
- D (+13.7) · D 55.9% · R 42.2% · Other 1.8%
- 2008→2024 swing
- -18.8pp toward R · 2008: 32.5pp · 2024: 13.7pp
- All cycles
- 2024: D+13.7 2020: D+15.6 2016: D+11.8 2012: D+29.6 2008: D+32.5
Not yet ingested
- Civics
- —
Market trends
- HPI YoY
- ▼ -100.66%
- Current HPI
- 237.4607
- Rent YoY
- —
- Metro
- —
- State GDP YoY
- ▲ 2.41%
- F500 in state
- 34
Industry mix (Fortune 500 HQ in MN)
| Industry | F500 HQs | Revenue |
|---|---|---|
| Healthcare | 2 | $407B |
|
||
| Retail | 2 | $150B |
|
||
| Consumer Goods | 2 | $32B |
|
||
| Industrial Machinery | 2 | $6B |
|
||
| Agriculture | 1 | $40B |
|
||
| Healthcare / Medical Devices | 1 | $32B |
|
||
Price history
+0.0% since first listed2 events — show timeline
- 2026-06-18 Listed $169,900 LSAR
- 2026-06-18 Listed $169,900 NORTHSTARMLS as Distributed by MLS Grid
Cash-flow waterfall
monthlySold comps — $/sqft
last 12 mo · ≤1 miLoading sold comps…