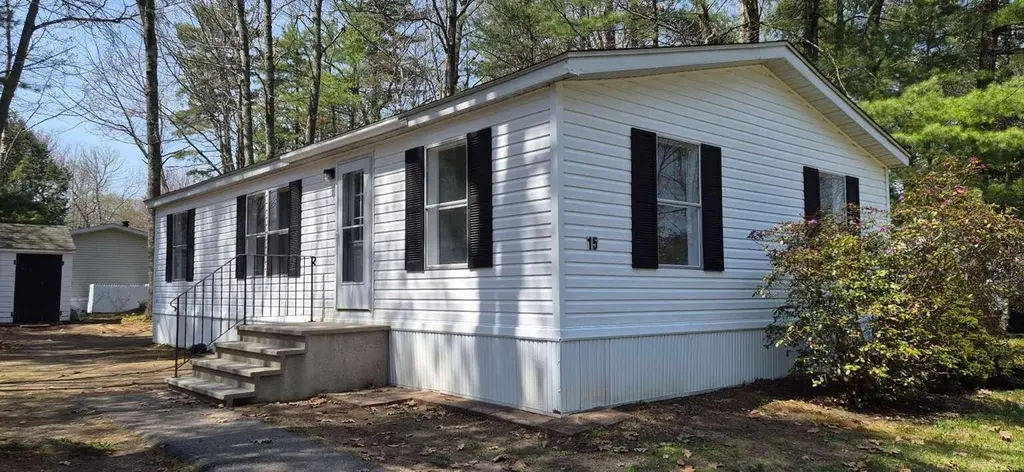
15 Deer Isle Dr · Old Orchard Beach, ME
Flood risk 1/10 · Minimal
- FEMA flood zone
- X
- Chance of flooding over 30 yrs
- 0.0%
- Est. flood insurance / yr
- $507 – $1,088
Fire risk 1/10 · Minimal
- Est. fire insurance / yr
- $669 – $1,243
Heat risk 4/10 · Minor
- Hot days now (above 89°F)
- 7 days/yr
- Hot days in 30 yrs
- 17 days/yr
Wind risk 6/10 · Moderate
- Chance of severe wind over 30 yrs
- 65.0%
Air-quality risk 2/10 · Minimal
- Unhealthy air days now
- 1 days/yr
- Unhealthy air days in 30 yrs
- 1 days/yr
Risk factors via First Street. Map © Google.
Why this score? — see what drove the B grade
The composite is a weighted blend of 9 inputs, each scored 0–100. Each bar is that input's sub-score; the figure is the points it added to the 100-point composite (weight × sub-score).
- Cash flow +26.2/30.0
- ARV discount +12.9/15.0
- 1% rule +10.0/10.0
- DSCR +8.9/10.0
- Schools +6.7/10.0
- Rent growth +3.7/5.0
- Livability +3.4/5.0
- Condition / age +2.5/5.0
- Appreciation +0.0/10.0
$129,000
🖨 Deal sheet 📄 Offer letter ✓ Due diligence
Listing remarks
Freshly updated, this 3-bedroom, 2-bath home offers affordable living in a convenient Old Orchard Beach location. Featuring a bright open layout, recent cosmetic updates, and a functional single-level floor plan, this home is ideal for year-round living or a low-maintenance coastal retreat. The spacious primary bedroom includes a private full bath, while the additional bedrooms offer flexibility for guests, or a home office. Enjoy easy access to local beaches, shopping, restaurants, schools, and downtown Old Orchard Beach, all while tucked into a quiet neighborhood setting. Whether you're looking for an affordable primary residence, downsizing opportunity, or investment property, this refre
Key facts
- Private full bath
- Parking
- Built 1996
Tags
Property features AI
Finance
- HOA & community: Association present with monthly fee of $687; Pets allowed with breed restrictions; Land lease in place
Exterior
- Parking: Paved parking with 1–4 spaces
- Utilities: Public water; Public sewer; Electric service with circuit breakers; Electric water heater
- Home design: Mobile home (Double Wide); Sunhaven model by Skyline; Built in 1996; Entry level on first floor
- Construction: Wood frame with vinyl siding; Block foundation; Shingle roof
- Exterior features: Deck; Subdivided, wooded lot
Interior
- Kitchen: Electric range; Gas range; Dishwasher
- Bedrooms: Primary bedroom on the first floor; Bedroom 2 on the first floor; Bedroom 3 on the first floor
- Flooring: Carpet; Laminate
- Bathrooms: 2 full bathrooms
- Heating & cooling: Forced air heating
- Interior features: First-floor primary bedroom with full bath; Total of 4 rooms
- Laundry & utility: Washer
Neighborhood map
What this means for you Summary
Snapshot
- This is a 3-bed/2.0-bath manufactured listed at $129k.
Deal economics
- At list price, monthly cash flow is $329 ($4k/yr) — positive.
- The deal already cash-flows at list — no discount required.
- Meets the 1% rule at list price ($2k rent vs $129k).
- Cap rate 9.4% vs local median 2.1% in Old Orchard Beach — top-decile yield for the area; either an underpriced asset or a hidden risk that comps aren't pricing in. Stress-test before assuming the spread holds.
Location & tenants
- Location reads 68/100 on livability (#88 in ME) — a middle-class / working-renter tenant base. Strengths: crime A+, housing A+, cost of living B+; Watch: schools D, amenities F, commute F.
- RSU 23 (suburban): math 78% / reading 80% proficiency, ranked #87 of 112 in ME (top 78%) — strong family-tenant draw, lease renewals of 3-5y typical.
- Market conditions: Rents rising fast (+4.9%/yr); 171 active listings in the ZIP; 2 comparable units currently listed for rent nearby; 1,386 units permitted in York County in 2024 (338 in 5+ unit buildings).
- At $2,358/mo this rent would consume 47% of the median local household income ($60k/yr) (locally 441% of renters already pay >50% of income on rent) — very limited rent-growth headroom before tenants either downsize or default.
Forward outlook
- Local home prices are declining (-3.0%/yr); year-one equity from $892 of loan paydown is wiped out by about $4k of value loss. Plan a longer hold.
- At projected returns (-3.0% appreciation + 4.9% rent growth), your $36k cash investment doubles in ~8 years — after that, you're playing with house money.
Negotiation context
- Only 5 days on market — expect competitive offers; lowballing is unlikely to land.
Risks & watch-outs
- Watch-outs: HOA is 29% of rent.
- Climate carrying-cost: major wind risk, 65% chance of damaging wind over 30y — expect insurance premiums to compound above CPI over the hold.
Questions for the listing agent
- What does the HOA fee cover, when was the last increase, and are there any pending special assessments or reserve-fund shortfalls?
- Is there a deadline driving the sale (1031 exchange, divorce, estate, relocation)? That informs how much negotiation room exists.
- Schools are D-rated, which usually means shorter tenancies and higher turnover. Who's the typical renter profile here, and what's been the actual vacancy rate?
- What's the average days-on-market for RENTAL listings here right now (not sales)? A rising rental-DOM trend means longer vacancies and softer asking-rent achievability than the comps imply.
- What's the recent tenant-quality profile in this submarket — average credit score on applications, eviction rate, late-payment / NSF rate, and stable-employment percentage? A property-management company in the area should have these aggregated.
- How much new for-sale + rental construction is in the pipeline within 1–3 miles? Heavy new supply typically softens prices + rents 12–24 months out; constrained supply supports both.
Investment metrics
- 1% rule
- 1.83% ✓
- Cap rate
- 9.35%
- Cash-on-cash
- 10.93%
- DSCR
- 1.49
- GRM
- 4.6
CMA / ARV
- ARV (median comp)
- $146,500
- List price
- $129,000
- Delta
- -11.95%
- Verdict
- UNDERPRICED
- Comps
- 9 within 1.0 mi
Show comp detail 8 sales within ~0.75 mi
| Address | Dist | Beds/Ba | Sqft | Sold | Price | $/sf | Match |
|---|---|---|---|---|---|---|---|
| 15 Deer Isle Dr | 0.00mi | 3/2.0 | 960 (0%) | 1mo | $136,000 | $142 | 100 |
| 5 Wilson Dr | 0.34mi | 3/2.0 | 980 (+2%) | 6mo | $105,000 | $107 | 76 |
| 2 Wilson Dr | 0.34mi | 2/2.0 (-1) | 924 (-4%) | 3mo | $149,900 | $162 | 71 |
| 2 Stackpole Dr | 0.45mi | 2/2.0 (-1) | 924 (-4%) | 2mo | $146,500 | $159 | 66 |
| 11 Wilson Dr | 0.34mi | 3/2.0 | 1,064 (+11%) | 8mo | $133,000 | $125 | 60 |
| 1 Bayberry Dr | 0.38mi | 2/1.0 (-1) | 924 (-4%) | 23mo | $72,000 | $78 | 48 |
| 9 Freshwater Dr | 0.66mi | 2/2.0 (-1) | 924 (-4%) | 24mo | $189,000 | $205 | 38 |
| 15 Ryefield Dr | 0.75mi | 2/2.0 (-1) | 924 (-4%) | 23mo | $158,500 | $172 | 35 |
Match score weights: distance 35% · size 25% · config 20% · recency 20%. Top-matched comps best support the ARV.
Projected returns pro-forma
-3.0% appreciation · 4.93% rent growth · sell at horizon
- IRR
- 3.6%
- Equity multiple
- 1.14×
- Total profit
- $5,156
- Equity at exit
- $19,234
- IRR
- 15.8%
- Equity multiple
- 2.47×
- Total profit
- $53,153
- Equity at exit
- $11,154
Cash invested: $36,120 (down + closing). Projections, not guarantees.
Landlord ↔ Tenant lean methodology
- Overall (STATE)
- 41 Moderately Tenant-Leaning
- State Maine
- 41 Moderately Tenant-Leaning · D+2
- County
- — inherits STATE
- City
- — inherits STATE
ZIP-level market 04064
- Home prices YoY
- -11.6%
- Rents YoY
- 4.9%
- Active inventory
- 171
- Price-to-rent
- 4.6×
Monthly cashflow live
- Estimated rent
- $2,358 medium interval (Pro) →
- Mortgage (P&I)
- −$676
- Tax from tax record
- −$117 /mo · $1,399/yr
- Insurance
- −$54
- HOA
- −$687
- Vacancy / Maint / Mgmt
- −$495
- Net cashflow
- $329
Break-even live
UW: 25.0% down · 7.5% · 30yr · 1.5% tax · 5.0% vac · 8.0% maint · 8.0% mgmt
Financing live
Cash to close
- Down payment
- $32,250
- Closing costs
- $3,870
- Reserves months
- —
- Total cash needed
- —
Loan-product check · same deal, 3 products live
Conventional
25% down · 7.5% · 30yr
- Down + closing
- —
- Monthly P&I
- —
- Monthly cashflow
- —
- DSCR
- —
- Eligible?
- —
Personal DTI + credit; lowest rate.
DSCR
20% down · 8.5% · 30yr
- Down + closing
- —
- Monthly P&I
- —
- Monthly cashflow
- —
- DSCR
- —
- Eligible?
- —
No personal income docs; deal must DSCR.
Hard money
10% down · 12.0% · 12mo
- Down + closing
- —
- Monthly P&I
- —
- Monthly cashflow
- —
- DSCR
- —
- Eligible?
- —
Short-term bridge; refi at stabilization.
Rent comps 2 comps
| Address | Beds | Baths | Sqft | Rent | $/sqft | DOM | Units | Dist |
|---|---|---|---|---|---|---|---|---|
| 18 Smithwheel Rd #61 Old Orchard Beach, ME | 2.0 | 1.0 | 800 | $2,100 | $2.62 | 44d | 1 | 0.77mi |
| 88 Saco Ave #1 Old Orchard Beach, ME | 2.0 | 1.0 | 800 | $2,000 | $2.50 | 13d | 1 | 0.94mi |
HOA detail
- Monthly dues
- $687 · $8,244/yr
Listing history 1 events
-
2026-05-14$129,000 Active 765-char remark
ⓘ Source: listings_history table (triggers on properties + properties_extension) + one-shot
backfill from property_details.listing_events for pre-trigger history.
Tax reassessment forecast ME · Partial reset (capped growth)
- Current annual tax
- $1,399 · $117/mo
- Projected year-2 tax
- $1,577 · $131/mo
- Expected delta
- +$178/yr (+$15/mo · 12.7%)
ⓘ Screening estimate from a state-policy table — verify with the county assessor before closing.
Climate risk First Street
- Flood 1/10 Low FEMA zone X · 0% chance over 30 yrs
- Wildfire 1/10 Low
- Heat 4/10 Moderate 7 d/yr ≥89°F today · 17 d/yr by 30 yrs out
- Wind 6/10 Major 65% chance of damaging wind over 30 yrs
- Air quality 2/10 Low 1 unhealthy d/yr today · 1 by 30 yrs out
Nearby sold comps map
Loading sold comps map…
Walkable amenities ~0.75 mi
Loading nearby amenities…
Taxation est. · year 1
- Rental income
- $28,298
- − Mortgage interest
- −$7,226
- − Property taxes
- −$1,399
- − Insurance
- −$645
- − Repairs & maintenance
- −$2,264
- − Management
- −$2,264
- − HOA
- −$8,244
- − Depreciation
- −$3,753
- Taxable income
- $2,504
- Est. tax owed @ 24.0%
- −$601
- After-tax cash flow
- $3,349/yr
For passive investors: Depreciation is non-cash, so a rental often shows a tax loss while cash-flowing — sheltering income. Rental losses are passive: they offset passive income freely, and up to $25,000/yr can offset ordinary (W-2) income if you actively participate and your MAGI is under $100k (phasing out to $0 by $150k); unused losses carry forward. On sale, claimed depreciation is recaptured at up to 25%, and gains may owe capital-gains tax (a 1031 exchange can defer both). Figures are a year-1 estimate at your 24.0% rate — not tax advice; consult a CPA.
Schools (NCES district)
- District
- RSU 23
- NCES district ID
- 2314784
- Math proficiency
- 78% ▲ 51.00%
- Reading proficiency
- 80% ▲ 27.00%
- Median HH income
- $49,630
- Composite
- 66.79/100
- National rank
- #406
- State rank
- #87 of 112 in ME
Livability — Old Orchard Beach
- Score
- 68/100
- State rank
- #88
- US rank
- #9943
Category grades
Schools grade is shown separately in the Schools card above.
Census & demographics
- Census place
- Old Orchard Beach, ME
- County
- York County · 80,026 people
- City population
- 8,632
- Metro
- Portland-South Portland, ME
- Population (ZIP)
- 8,632
- Household income
- $59,887
- Rent vs Own
- Severe rent burden
- 441.0
Population outlook (York County) Hauer SSP2
- Today (2025)
- 209,961 people
- By 2030
- 212,816 · +1.4%
- By 2040
- 214,360 · +2.1%
- By 2050
- 210,350 · +0.2%
- By 2075
- 201,686 · -3.9%
- By 2100
- 183,392 · -12.7%
Race, ethnicity, and origin ACS 2023
- Neighborhood character
- Predominantly White (90%)
- Race & ethnicity
- White 90% Two or more races 6% Hispanic / Latino 3% Black 1% Native American 1%
- Common ancestry
- Lithuanian 9% Slovak 7% Romanian 3%
- Foreign-born
- 6% · Canada
- Languages at home
- 91% English-only · French/Haitian/Cajun 6% Russian/Polish/Slavic 1% Other Indo-European 1%
Political lean MEDSL · York
- 2024 margin
- D (+10.5) · D 54.3% · R 43.8% · Other 1.9%
- 2008→2024 swing
- -10.1pp toward R · 2008: 20.5pp · 2024: 10.5pp
- All cycles
- 2024: D+10.5 2020: D+12.6 2016: D+4.8 2012: D+16.4 2008: D+20.5
Not yet ingested
- Civics
- —
Market trends
- HPI YoY
- ▼ -64.32%
- Current HPI
- 489.543
- Rent YoY
- ▲ 4.93%
- Metro
- Portland-South Portland, ME
- State GDP YoY
- —
- F500 in state
- 0
Price history
+5.4% since first listed3 events — show timeline
- 2026-06-02 Sold (MLS) $136,000 MREIS
- 2026-05-19 Pending — MREIS
- 2026-05-14 Listed $129,000 MREIS
Property tax history
+5.0%/yrLatest (2024): $1,399 · +9.2% YoY. Source: county tax records.
Cash-flow waterfall
monthlySold comps — $/sqft
last 12 mo · ≤1 miLoading sold comps…