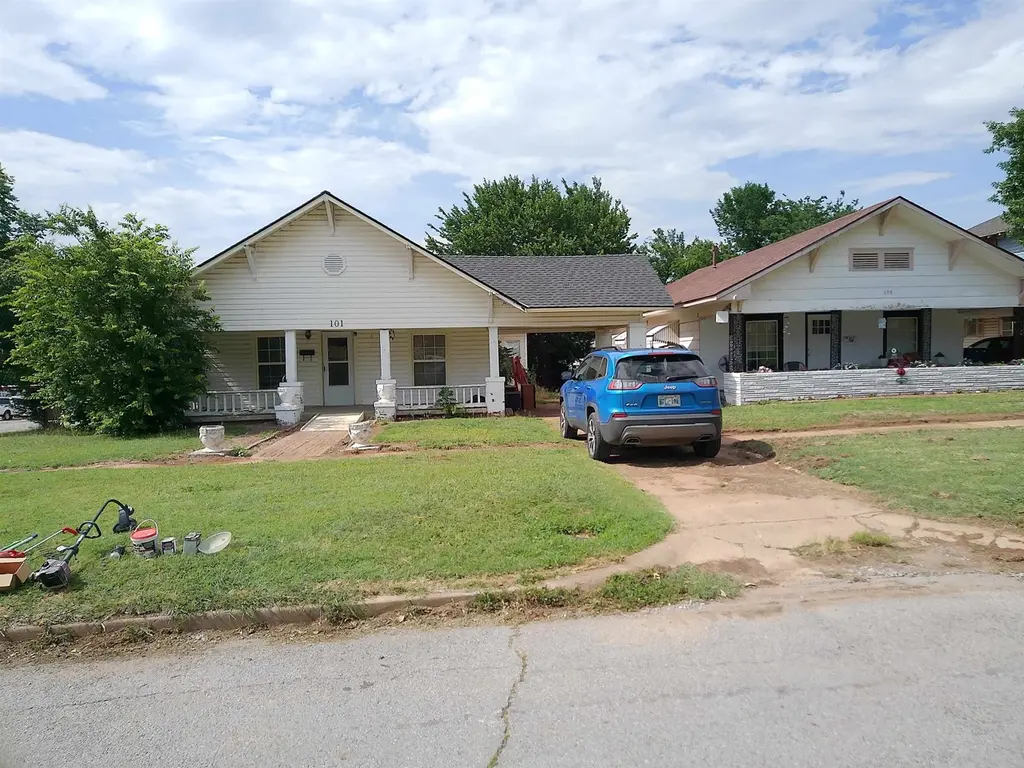
101 E Iowa St · Walters, OK
Flood risk 1/10 · Minimal
- FEMA flood zone
- X
- Chance of flooding over 30 yrs
- 0.0%
- Est. flood insurance / yr
- $507 – $1,088
Fire risk 5/10 · Moderate
- Est. fire insurance / yr
- $2,463 – $4,575
Heat risk 7/10 · Major
- Hot days now (above 111°F)
- 7 days/yr
- Hot days in 30 yrs
- 19 days/yr
Wind risk 3/10 · Minor
- Chance of severe wind over 30 yrs
- 6.0%
Air-quality risk 1/10 · Minimal
- Unhealthy air days now
- 0 days/yr
- Unhealthy air days in 30 yrs
- 0 days/yr
Risk factors via First Street. Map © Google.
Why this score? — see what drove the A- grade
The composite is a weighted blend of 9 inputs, each scored 0–100. Each bar is that input's sub-score; the figure is the points it added to the 100-point composite (weight × sub-score).
- Cash flow +30.0/30.0
- ARV discount +15.0/15.0
- 1% rule +10.0/10.0
- DSCR +10.0/10.0
- Appreciation +7.9/10.0
- Livability +3.2/5.0
- Rent growth +2.5/5.0
- Condition / age +2.5/5.0
- Schools +2.1/10.0
$49,900
🖨 Deal sheet (PDF) 📄 Offer letter ✓ Due diligence
Listing remarks
Listed with Bryan Fisher REMAX of Duncan. This property has a ton of potential! It is on a great corner lot just not far from the HWY. New 30 year roof!. Comes with 3 bed rooms and 2 full baths. Lots of hard wood floors. Home needs your TLC! Priced to sell! Selling in "current condition. "
Key facts
- Hard wood floors
- New 30 year roof
- Corner lot
Tags
Property features AI
Finance
- Other: Residential property
Exterior
- Parking: 1 parking space
- Utilities: Public water; Public sewer
- Home design: Single Family Residence; Single-story; Corner lot
- Construction: Wood siding; Composition roof
- Exterior features: Covered patio/porch; Chain link fencing; Fenced yard; Shed(s)
Interior
- Kitchen: Electric range; Electric oven
- Flooring: Hardwood flooring
- Bathrooms: 2 full bathrooms
- Heating & cooling: Space heater
- Interior features: Electric range; Electric oven
Neighborhood map
What this means for you Summary
Snapshot
- This is a 3-bed/1.0-bath single-family listed at $50k.
Deal economics
- At list price, monthly cash flow is $557 ($7k/yr) — positive.
- The deal already cash-flows at list — no discount required.
- Meets the 1% rule at list price ($1k rent vs $50k).
- Recommended offer: $49k (1.5% below list) — sets the bar for market timing.
Location & tenants
- Location reads 64/100 on livability (#165 in OK) — a middle-class / working-renter tenant base. Strengths: cost of living A+, housing A+; Watch: employment D, amenities F, commute F.
- Walters (town): math 22% / reading 25% proficiency, ranked #122 of 270 in OK (top 45%) — low school quality limits family demand, transient renter base, plan for 1-2y turnover.
- Zoned schools: Walters Es (math 37% / reading 27%, grade F, #213 of 845 statewide, top 28%, 274 students, 0% FRL); Walters Ms (math 12% / reading 22%, grade F, #193 of 345 statewide, top 60%, 140 students, 0% FRL); Walters Hs (math 15% / reading 24%, grade F, #274 of 447 statewide, top 66%, 196 students, 0% FRL) — zoned schools average 0% FRL vs 49% district-wide (49 pts lower); this property's tenant base skews higher-income than the district average.
- Market conditions: 19 active listings in the ZIP.
Forward outlook
- In year one you build about $3k of equity ($345 loan paydown + $3k appreciation (5.9% local appreciation)).
- Cotton County population projected to shrink 5% by 2050 — rents likely to lag national; underwrite the cash flow, not the appreciation.
- At projected returns (5.9% appreciation + 3.0% rent growth), your $14k cash investment doubles in ~2 years — after that, you're playing with house money.
- By year 10, paydown + projected appreciation supports a ~$34k cash-out refi (75% LTV) — recoverable capital for the next deal without selling this one.
Negotiation context
- It's been on market 25 days — a 2% lower offer ($49k) is reasonable based on typical stale-listing flexibility.
- Current owner paid $15k; list at $50k implies a 233% gain — meaningful room to come down on a strong offer.
Risks & watch-outs
- Watch-outs: built in 1920 — expect roof / HVAC / electrical / plumbing capex.
- Climate carrying-cost: moderate wildfire risk; extreme-heat days projected 7→19/yr by 2055 (HVAC capex compounding) — expect insurance premiums to compound above CPI over the hold.
Questions for the listing agent
- Built in 1920 — when were the roof, HVAC, electrical panel, plumbing, and water heater last replaced?
- Is there a deadline driving the sale (1031 exchange, divorce, estate, relocation)? That informs how much negotiation room exists.
- Schools are F-rated, which usually means shorter tenancies and higher turnover. Who's the typical renter profile here, and what's been the actual vacancy rate?
- What's the average days-on-market for RENTAL listings here right now (not sales)? A rising rental-DOM trend means longer vacancies and softer asking-rent achievability than the comps imply.
- What's the recent tenant-quality profile in this submarket — average credit score on applications, eviction rate, late-payment / NSF rate, and stable-employment percentage? A property-management company in the area should have these aggregated.
- How much new for-sale + rental construction is in the pipeline within 1–3 miles? Heavy new supply typically softens prices + rents 12–24 months out; constrained supply supports both.
Investment metrics
- 1% rule
- 2.21% ✓
- Cap rate
- 19.70%
- Cash-on-cash
- 47.87%
- DSCR
- 3.13
- GRM
- 3.8
CMA / ARV
- ARV (on-the-fly)
- $95,338
- Comps found
- 12
Show comp detail 12 sales within ~0.75 mi
| Address | Dist | Beds/Ba | Sqft | Sold | Price | $/sf | Match |
|---|---|---|---|---|---|---|---|
| 416 E Iowa St | 0.28mi | 3/1.0 | 1,300 (-0%) | 3mo | $152,000 | $117 | 84 |
| 227 E California St | 0.32mi | 3/1.0 | 1,336 (+2%) | 2mo | $65,000 | $49 | 80 |
| 104 S Ross St | 0.40mi | 3/1.0 | 1,326 (+2%) | 11mo | $53,000 | $40 | 70 |
| 201 W Nebraska Ave | 0.38mi | 3/1.0 | 1,393 (+7%) | 7mo | $88,000 | $63 | 66 |
| 230 W Colorado St | 0.31mi | 3/1.0 | 1,497 (+15%) | 3mo | $45,000 | $30 | 59 |
| 103 Thurman Dr | 0.73mi | 3/2.0 | 1,307 (+0%) | 6mo | $175,000 | $134 | 57 |
| 518 W Nevada St | 0.61mi | 3/1.5 | 1,200 (-8%) | 3mo | $87,900 | $73 | 53 |
| 120 E Indiana | 0.68mi | 2/2.0 (-1) | 1,300 (-0%) | 9mo | $140,000 | $108 | 51 |
| 603 E California St | 0.60mi | 3/2.0 | 1,400 (+7%) | 8mo | $133,600 | $95 | 50 |
| 227 E Ohio | 0.73mi | 3/1.5 | 1,400 (+7%) | 4mo | $109,000 | $78 | 49 |
| 121 E Texas | 0.57mi | 2/2.0 (-1) | 1,200 (-8%) | 4mo | $59,900 | $50 | 48 |
| 514 E Washington Ave | 0.64mi | 3/1.5 | 1,500 (+15%) | 9mo | $89,500 | $60 | 36 |
Match score weights: distance 35% · size 25% · config 20% · recency 20%. Top-matched comps best support the ARV.
Projected returns pro-forma
5.87% appreciation · 3.0% rent growth · sell at horizon
- IRR
- 56.7%
- Equity multiple
- 4.54×
- Total profit
- $49,504
- Equity at exit
- $30,947
- IRR
- 53.7%
- Equity multiple
- 9.44×
- Total profit
- $117,924
- Equity at exit
- $55,761
Cash invested: $13,972 (down + closing). Projections, not guarantees.
Landlord ↔ Tenant lean methodology
- Overall (STATE)
- 83 Strongly Landlord-Friendly
- State Oklahoma
- 83 Strongly Landlord-Friendly · R+20
- County
- — inherits STATE
- City
- — inherits STATE
ZIP-level market 73572
- Home prices YoY
- 3.1%
- Active inventory
- 19
- Price-to-rent
- 3.8×
Monthly cashflow live
- Estimated rent
- $1,103 medium interval (Pro) →
- Mortgage (P&I)
- −$262
- Tax from tax record
- −$32 /mo · $383/yr
- Insurance
- −$21
- HOA
- −$0
- Vacancy / Maint / Mgmt
- −$232
- Net cashflow
- $557
Break-even live
Sensitivity live
| Price | -10% $586 | -5% $571 | +0% $557 | +5% $543 | +10% $529 |
|---|---|---|---|---|---|
| Rent | -10% $470 | -5% $514 | +0% $557 | +5% $601 | +10% $644 |
| Rate | -1.0pp $582 | -0.5pp $570 | base $557 | +0.5pp $544 | +1.0pp $531 |
UW: 25.0% down · 7.5% · 30yr · 1.5% tax · 5.0% vac · 8.0% maint · 8.0% mgmt
Financing live
Cash to close
- Down payment
- $12,475
- Closing costs
- $1,497
- Reserves months
- —
- Total cash needed
- —
Loan-product check · same deal, 3 products live
Conventional
25% down · 7.5% · 30yr
- Down + closing
- —
- Monthly P&I
- —
- Monthly cashflow
- —
- DSCR
- —
- Eligible?
- —
Personal DTI + credit; lowest rate.
DSCR
20% down · 8.5% · 30yr
- Down + closing
- —
- Monthly P&I
- —
- Monthly cashflow
- —
- DSCR
- —
- Eligible?
- —
No personal income docs; deal must DSCR.
Hard money
10% down · 12.0% · 12mo
- Down + closing
- —
- Monthly P&I
- —
- Monthly cashflow
- —
- DSCR
- —
- Eligible?
- —
Short-term bridge; refi at stabilization.
Listing history 20 events
-
2026-06-21days on market $49,900 Active 25 DOM
-
2026-06-19days on market $49,900 Active 23 DOM
-
2026-06-18days on market $49,900 Active 22 DOM
-
2026-06-17days on market $49,900 Active 21 DOM
-
2026-06-16days on market $49,900 Active 20 DOM
-
2026-06-15days on market $49,900 Active 19 DOM
-
2026-06-14days on market $49,900 Active 17 DOM
-
2026-06-13days on market $49,900 Active 16 DOM
-
2026-06-10days on market $49,900 Active 14 DOM
-
2026-06-09days on market $49,900 Active 13 DOM
-
2026-06-08days on market $49,900 Active 12 DOM
-
2026-06-07days on market $49,900 Active 11 DOM
-
2026-06-05days on market $49,900 Active 8 DOM
-
2026-06-03days on market $49,900 Active 7 DOM
-
2026-06-02days on market $49,900 Active 6 DOM
-
2026-06-01days on market $49,900 Active 5 DOM
-
2026-05-31days on market $49,900 Active 4 DOM
-
2026-05-30days on market $49,900 Active 3 DOM
-
2026-05-28$49,900 Active
-
2002-08-13soldstatus $15,000
ⓘ Source: listings_history table (triggers on properties + properties_extension) + one-shot
backfill from property_details.listing_events for pre-trigger history.
Tax reassessment forecast OK · Resets to sale price
- Current annual tax
- $383 · $32/mo
- Projected year-2 tax
- $449 · $37/mo
- Expected delta
- +$66/yr (+$6/mo · 17.3%)
ⓘ Screening estimate from a state-policy table — verify with the county assessor before closing.
Climate risk First Street
- Flood 1/10 Low FEMA zone X · 0% chance over 30 yrs
- Wildfire 5/10 Major
- Heat 7/10 Severe 7 d/yr ≥111°F today · 19 d/yr by 30 yrs out
- Wind 3/10 Moderate 6% chance of damaging wind over 30 yrs
- Air quality 1/10 Low 0 unhealthy d/yr today · 0 by 30 yrs out
Nearby sold comps map
Loading sold comps map…
Walkable amenities ~0.75 mi
Loading nearby amenities…
Taxation est. · year 1
- Rental income
- $13,241
- − Mortgage interest
- −$2,795
- − Property taxes
- −$383
- − Insurance
- −$250
- − Repairs & maintenance
- −$1,059
- − Management
- −$1,059
- − Depreciation
- −$1,452
- Taxable income
- $6,243
- Est. tax owed @ 24.0%
- −$1,498
- After-tax cash flow
- $5,189/yr
For passive investors: Depreciation is non-cash, so a rental often shows a tax loss while cash-flowing — sheltering income. Rental losses are passive: they offset passive income freely, and up to $25,000/yr can offset ordinary (W-2) income if you actively participate and your MAGI is under $100k (phasing out to $0 by $150k); unused losses carry forward. On sale, claimed depreciation is recaptured at up to 25%, and gains may owe capital-gains tax (a 1031 exchange can defer both). Figures are a year-1 estimate at your 24.0% rate — not tax advice; consult a CPA.
Schools (NCES district)
- District
- Walters
- NCES district ID
- 4031470
- Math proficiency
- 22% ▼ -4.00%
- Reading proficiency
- 25% ▼ -3.00%
- Median HH income
- $48,681
- Composite
- 20.68/100
- National rank
- #8530
- State rank
- #122 of 270 in OK
Livability — Walters
- Score
- 64/100
- State rank
- #165
- US rank
- #13750
Category grades
Schools grade is shown separately in the Schools card above.
Census & demographics
- Census place
- Walters, OK
- Population (ZIP)
- 3,194
Population outlook (Cotton County) Hauer SSP2
- Today (2025)
- 5,847 people
- By 2030
- 5,759 · -1.5%
- By 2040
- 5,619 · -3.9%
- By 2050
- 5,550 · -5.1%
- By 2075
- 5,839 · -0.1%
- By 2100
- 6,503 · +11.2%
Race, ethnicity, and origin ACS 2023
- Neighborhood character
- Predominantly White (72%)
- Race & ethnicity
- White 72% Native American 12% Two or more races 10% Hispanic / Latino 6%
- Hispanic origin (detail)
- Mexican 5%
- Common ancestry
- Iranian 2% Italian 2% European 1%
- Foreign-born
- 1% · Canada
- Languages at home
- 92% English-only · Spanish 5%
Political lean MEDSL · Cotton
- 2024 margin
- Solid R (+66.8) · D 15.6% · R 82.5% · Other 1.9%
- 2008→2024 swing
- -22.4pp toward R · 2008: -44.4pp · 2024: -66.8pp
- All cycles
- 2024: R+66.8 2020: R+67.0 2016: R+62.6 2012: R+46.4 2008: R+44.4
Not yet ingested
- Civics
- —
Market trends
- HPI YoY
- ▲ 5.87%
- Current HPI
- 193.3992
- Rent YoY
- —
- Metro
- —
- State GDP YoY
- ▲ 1.55%
- F500 in state
- 6
Industry mix (Fortune 500 HQ in OK)
| Industry | F500 HQs | Revenue |
|---|---|---|
| Energy | 3 | $48B |
|
||
Price history
+232.7% since first listed2 events — show timeline
- 2026-05-28 Listed $49,900 DAOR
- 2002-08-13 Sold (Public Records) $15,000 Public Records
Property tax history
+0.5%/yrLatest (2025): $383 · -3.0% YoY. Source: county tax records.
Cash-flow waterfall
monthlySold comps — $/sqft
last 12 mo · ≤1 miLoading sold comps…