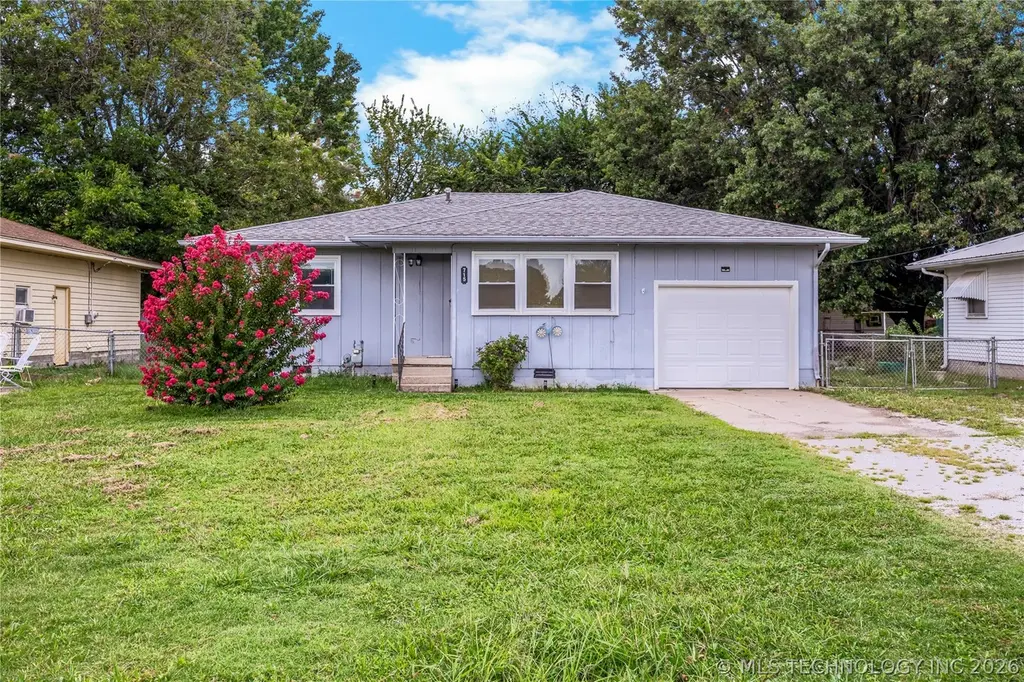
715 N Adair · Vinita, OK
Flood risk 1/10 · Minimal
- FEMA flood zone
- X (unshaded)
- Chance of flooding over 30 yrs
- 0.0%
- Est. flood insurance / yr
- $507 – $1,088
Fire risk 5/10 · Moderate
- Est. fire insurance / yr
- $2,463 – $4,575
Heat risk 6/10 · Moderate
- Hot days now (above 110°F)
- 7 days/yr
- Hot days in 30 yrs
- 20 days/yr
Wind risk 2/10 · Minimal
- Chance of severe wind over 30 yrs
- 3.0%
Air-quality risk 2/10 · Minimal
- Unhealthy air days now
- 1 days/yr
- Unhealthy air days in 30 yrs
- 1 days/yr
Risk factors via First Street. Map © Google.
Why this score? — see what drove the B- grade
The composite is a weighted blend of 9 inputs, each scored 0–100. Each bar is that input's sub-score; the figure is the points it added to the 100-point composite (weight × sub-score).
- Cash flow +25.3/30.0
- ARV discount +10.6/15.0
- Appreciation +10.0/10.0
- DSCR +8.3/10.0
- 1% rule +5.4/10.0
- Livability +3.2/5.0
- Rent growth +2.5/5.0
- Condition / age +2.5/5.0
- Schools +1.8/10.0
$120,000
🖨 Deal sheet 📄 Offer letter ✓ Due diligence
Listing remarks
Welcome to 715 N Adair in Vinita, Oklahoma! This charming home offers a blend of comfort and convenience in a great location. Featuring 3 bedrooms and 1 bathrooms, the property includes spacious living areas, a functional kitchen, and a layout designed for everyday living. Situated near local schools, shops, and community amenities, this property is ideal for anyone seeking a home in the heart of Vinita. With its inviting curb appeal and practical features, 715 N Adair is ready for its next chapter.
Key facts
- Functional kitchen
- Inviting curb appeal
- Community amenities
Tags
Property features AI
Exterior
- Parking: Attached garage (1 car)
- Security: Smoke detector(s); No safety shelter
- Utilities: Electricity available; Natural gas available; Phone available; Public water; Public sewer
- Home design: Single-story; Faces east; Slab foundation
- Construction: Concrete and vinyl siding construction; Asphalt/fiberglass roof
- Exterior features: Covered patio and porch; Porch; Shed(s); Chain link fencing; No other exterior features listed
Interior
- Kitchen: Refrigerator; Electric water heater; Gas water heater
- Flooring: Carpet; Laminate; Wood
- Bathrooms: 1 full bathroom
- Heating & cooling: Central heating (electric and gas); Central air conditioning
- Interior features: Granite counters; High-speed internet; Electric range connection; Gas range connection; Programmable thermostat; Aluminum frame windows
Neighborhood map
What this means for you Summary
Snapshot
- This is a 3-bed/1.0-bath single-family listed at $120k.
Deal economics
- At list price, monthly cash flow is $271 ($3k/yr) — positive.
- The deal already cash-flows at list — no discount required.
- Meets the 1% rule at list price ($1k rent vs $120k).
- Recommended offer: $116k (3.0% below list) — sets the bar for market timing.
- Cap rate 9.0% vs local median 4.7% in Vinita — top-decile yield for the area; either an underpriced asset or a hidden risk that comps aren't pricing in. Stress-test before assuming the spread holds.
Location & tenants
- Location reads 63/100 on livability (#227 in OK) — a middle-class / working-renter tenant base. Strengths: cost of living A+, housing A+, crime B; Watch: schools F, amenities F, commute F.
- Vinita (town): math 24% / reading 20% proficiency, ranked #156 of 270 in OK (top 58%) — low school quality limits family demand, transient renter base, plan for 1-2y turnover.
- Market conditions: 113 active listings in the ZIP; 24 units permitted in Craig County in 2024 (0 in 5+ unit buildings).
Forward outlook
- In year one you build about $13k of equity ($830 loan paydown + $12k appreciation (10.0% local appreciation)).
- Craig County population projected to shrink 7% by 2050 — rents likely to lag national; underwrite the cash flow, not the appreciation.
- At projected returns (10.0% appreciation + 3.0% rent growth), your $34k cash investment doubles in ~2 years — after that, you're playing with house money.
- By year 3, paydown + projected appreciation supports a ~$32k cash-out refi (75% LTV) — recoverable capital for the next deal without selling this one.
Negotiation context
- It's been on market 52 days — a 3% lower offer ($116k) is reasonable based on typical stale-listing flexibility.
- 2 sale attempts; this cycle's ask has dropped $25k (17%) from the opening price — seller is motivated, your offer sets the floor, not the list.
- Current owner paid $68k; list at $120k implies a 76% gain — meaningful room to come down on a strong offer.
Risks & watch-outs
- Watch-outs: built in 1957 — expect roof / HVAC / electrical / plumbing capex.
- Climate carrying-cost: moderate wildfire risk; extreme-heat days projected 7→20/yr by 2055 (HVAC capex compounding) — expect insurance premiums to compound above CPI over the hold.
Questions for the listing agent
- It's been on market 52 days. Have you received any prior offers? Is the seller open to a 3% concession, seller financing, or rate buy-down credit?
- Built in 1957 — when were the roof, HVAC, electrical panel, plumbing, and water heater last replaced?
- Is there a deadline driving the sale (1031 exchange, divorce, estate, relocation)? That informs how much negotiation room exists.
- Schools are F-rated, which usually means shorter tenancies and higher turnover. Who's the typical renter profile here, and what's been the actual vacancy rate?
- What's the average days-on-market for RENTAL listings here right now (not sales)? A rising rental-DOM trend means longer vacancies and softer asking-rent achievability than the comps imply.
- What's the recent tenant-quality profile in this submarket — average credit score on applications, eviction rate, late-payment / NSF rate, and stable-employment percentage? A property-management company in the area should have these aggregated.
- How much new for-sale + rental construction is in the pipeline within 1–3 miles? Heavy new supply typically softens prices + rents 12–24 months out; constrained supply supports both.
Investment metrics
- 1% rule
- 1.04% ✓
- Cap rate
- 9.00%
- Cash-on-cash
- 9.68%
- DSCR
- 1.43
- GRM
- 8.0
CMA / ARV
- ARV (on-the-fly)
- $129,024
- Comps found
- 3
Show comp detail 3 sales within ~0.75 mi
| Address | Dist | Beds/Ba | Sqft | Sold | Price | $/sf | Match |
|---|---|---|---|---|---|---|---|
| 549 N Adair St N | 0.11mi | 2/1.0 (-1) | 1,100 (+9%) | 21mo | $136,000 | $124 | 57 |
| 417 N Brewer St | 0.39mi | 2/1.0 (-1) | 1,080 (+7%) | 11mo | $138,000 | $128 | 56 |
| 708 N Smith St | 0.61mi | 3/1.5 | 1,150 (+14%) | 22mo | $167,500 | $146 | 27 |
Match score weights: distance 35% · size 25% · config 20% · recency 20%. Top-matched comps best support the ARV.
Projected returns pro-forma
10.0% appreciation · 3.0% rent growth · sell at horizon
- IRR
- 31.3%
- Equity multiple
- 3.46×
- Total profit
- $82,561
- Equity at exit
- $108,106
- IRR
- 27.1%
- Equity multiple
- 7.83×
- Total profit
- $229,460
- Equity at exit
- $233,134
Cash invested: $33,600 (down + closing). Projections, not guarantees.
Landlord ↔ Tenant lean methodology
- Overall (STATE)
- 83 Strongly Landlord-Friendly
- State Oklahoma
- 83 Strongly Landlord-Friendly · R+20
- County
- — inherits STATE
- City
- — inherits STATE
ZIP-level market 74301
- Home prices YoY
- 7.1%
- Active inventory
- 113
- Price-to-rent
- 8.0×
Monthly cashflow live
- Estimated rent
- $1,251 medium interval (Pro) →
- Mortgage (P&I)
- −$629
- Tax from tax record
- −$38 /mo · $456/yr
- Insurance
- −$50
- HOA
- −$0
- Vacancy / Maint / Mgmt
- −$263
- Net cashflow
- $271
Break-even live
UW: 25.0% down · 7.5% · 30yr · 1.5% tax · 5.0% vac · 8.0% maint · 8.0% mgmt
Financing live
Cash to close
- Down payment
- $30,000
- Closing costs
- $3,600
- Reserves months
- —
- Total cash needed
- —
Loan-product check · same deal, 3 products live
Conventional
25% down · 7.5% · 30yr
- Down + closing
- —
- Monthly P&I
- —
- Monthly cashflow
- —
- DSCR
- —
- Eligible?
- —
Personal DTI + credit; lowest rate.
DSCR
20% down · 8.5% · 30yr
- Down + closing
- —
- Monthly P&I
- —
- Monthly cashflow
- —
- DSCR
- —
- Eligible?
- —
No personal income docs; deal must DSCR.
Hard money
10% down · 12.0% · 12mo
- Down + closing
- —
- Monthly P&I
- —
- Monthly cashflow
- —
- DSCR
- —
- Eligible?
- —
Short-term bridge; refi at stabilization.
Listing history 23 events
-
2026-06-18days on market $120,000 Active 52 DOM
-
2026-06-17days on market $120,000 Active 51 DOM
-
2026-06-16days on market $120,000 Active 50 DOM
-
2026-06-15days on market $120,000 Active 49 DOM
-
2026-06-13days on market $120,000 Active 47 DOM
-
2026-06-12days on market $120,000 Active 46 DOM
-
2026-06-09days on market $120,000 Active 43 DOM
-
2026-06-08days on market $120,000 Active 42 DOM
-
2026-06-08days on market $120,000 Active 41 DOM
-
2026-06-07days on market $120,000 Active 40 DOM
-
2026-06-04days on market $120,000 Active 37 DOM
-
2026-06-02days on market $120,000 Active 36 DOM
-
2026-06-01days on market $120,000 Active 35 DOM
-
2026-05-31days on market $120,000 Active 34 DOM
-
2026-05-21price $120,000
-
2026-05-07price $135,000
-
2026-04-27$145,000 Active
-
2026-03-27historical
-
2026-01-08price $145,000
-
2025-09-22$155,000 Active
-
2021-11-08soldstatus $68,000
-
2008-09-09soldstatus $59,000
-
2003-01-03soldstatus $45,000
ⓘ Source: listings_history table (triggers on properties + properties_extension) + one-shot
backfill from property_details.listing_events for pre-trigger history.
Tax reassessment forecast OK · Resets to sale price
- Current annual tax
- $456 · $38/mo
- Projected year-2 tax
- $1,080 · $90/mo
- Expected delta
- +$624/yr (+$52/mo · 136.8%)
ⓘ Screening estimate from a state-policy table — verify with the county assessor before closing.
Climate risk First Street
- Flood 1/10 Low FEMA zone X (unshaded) · 0% chance over 30 yrs
- Wildfire 5/10 Major
- Heat 6/10 Major 7 d/yr ≥110°F today · 20 d/yr by 30 yrs out
- Wind 2/10 Low 3% chance of damaging wind over 30 yrs
- Air quality 2/10 Low 1 unhealthy d/yr today · 1 by 30 yrs out
Nearby sold comps map
Loading sold comps map…
Walkable amenities ~0.75 mi
Loading nearby amenities…
Taxation est. · year 1
- Rental income
- $15,011
- − Mortgage interest
- −$6,722
- − Property taxes
- −$456
- − Insurance
- −$600
- − Repairs & maintenance
- −$1,201
- − Management
- −$1,201
- − Depreciation
- −$3,491
- Taxable income
- $1,340
- Est. tax owed @ 24.0%
- −$322
- After-tax cash flow
- $2,929/yr
For passive investors: Depreciation is non-cash, so a rental often shows a tax loss while cash-flowing — sheltering income. Rental losses are passive: they offset passive income freely, and up to $25,000/yr can offset ordinary (W-2) income if you actively participate and your MAGI is under $100k (phasing out to $0 by $150k); unused losses carry forward. On sale, claimed depreciation is recaptured at up to 25%, and gains may owe capital-gains tax (a 1031 exchange can defer both). Figures are a year-1 estimate at your 24.0% rate — not tax advice; consult a CPA.
Schools (NCES district)
- District
- Vinita
- NCES district ID
- 4031290
- Math proficiency
- 24% ▼ -10.00%
- Reading proficiency
- 20% ▼ -7.00%
- Median HH income
- $37,171
- Composite
- 18.37/100
- National rank
- #8943
- State rank
- #156 of 270 in OK
Livability — Vinita
- Score
- 63/100
- State rank
- #227
- US rank
- #15843
Category grades
Schools grade is shown separately in the Schools card above.
Census & demographics
- Census place
- Vinita, OK
- Population (ZIP)
- 11,126
Population outlook (Craig County) Hauer SSP2
- Today (2025)
- 14,522 people
- By 2030
- 14,263 · -1.8%
- By 2040
- 13,814 · -4.9%
- By 2050
- 13,457 · -7.3%
- By 2075
- 13,123 · -9.6%
- By 2100
- 12,323 · -15.1%
Race, ethnicity, and origin ACS 2023
- Neighborhood character
- Diverse neighborhood (Simpson 0.64)
- Race & ethnicity
- White 60% Native American 20% Two or more races 12% Black 4% Hispanic / Latino 4% Asian 1%
- Common ancestry
- Slovak 2% Lithuanian 1% Italian 1%
- Foreign-born
- 2% · Canada, Vietnam
- Languages at home
- 96% English-only · Spanish 3% Other Asian/Pacific 1%
Political lean MEDSL · Craig
- 2024 margin
- Solid R (+58.3) · D 20.0% · R 78.3% · Other 1.7%
- 2008→2024 swing
- -28.2pp toward R · 2008: -30.1pp · 2024: -58.3pp
- All cycles
- 2024: R+58.3 2020: R+57.5 2016: R+52.4 2012: R+34.1 2008: R+30.1
Not yet ingested
- Civics
- —
Market trends
- HPI YoY
- ▲ 17.37%
- Current HPI
- 262.4336
- Rent YoY
- —
- Metro
- —
- State GDP YoY
- ▲ 1.55%
- F500 in state
- 6
Industry mix (Fortune 500 HQ in OK)
| Industry | F500 HQs | Revenue |
|---|---|---|
| Energy | 3 | $48B |
|
||
Price history
+166.7% since first listed9 events — show timeline
- 2026-05-21 Price Changed $120,000 MLS Technology, Inc.
- 2026-05-07 Price Changed $135,000 MLS Technology, Inc.
- 2026-04-27 Listed $145,000 MLS Technology, Inc.
- 2026-03-27 Listing Removed — MLS Technology, Inc.
- 2026-01-08 Price Changed $145,000 MLS Technology, Inc.
- 2025-09-22 Listed $155,000 MLS Technology, Inc.
- 2021-11-08 Sold (Public Records) $68,000 Public Records
- 2008-09-09 Sold (Public Records) $59,000 Public Records
- 2003-01-03 Sold (Public Records) $45,000 Public Records
Property tax history
+3.6%/yrLatest (2025): $456 · -5.6% YoY. Source: county tax records.
Cash-flow waterfall
monthlySold comps — $/sqft
last 12 mo · ≤1 miLoading sold comps…