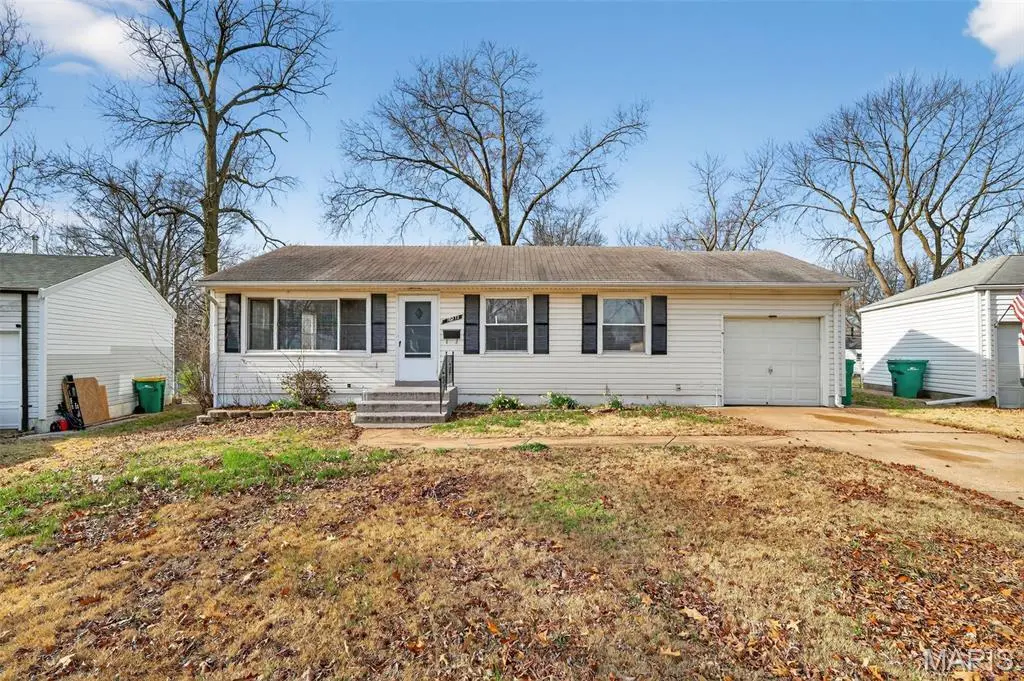
10213 Unicorn Dr · Bellefontaine Neighbors, MO
Flood risk 1/10 · Minimal
- FEMA flood zone
- X (unshaded)
- Chance of flooding over 30 yrs
- 0.0%
- Est. flood insurance / yr
- $473 – $860
Fire risk 1/10 · Minimal
- Est. fire insurance / yr
- $1,054 – $1,958
Heat risk 5/10 · Moderate
- Hot days now (above 107°F)
- 7 days/yr
- Hot days in 30 yrs
- 21 days/yr
Wind risk 2/10 · Minimal
- Chance of severe wind over 30 yrs
- 1.0%
Air-quality risk 4/10 · Minor
- Unhealthy air days now
- 4 days/yr
- Unhealthy air days in 30 yrs
- 5 days/yr
Risk factors via First Street. Map © Google.
Why this score? — see what drove the B grade
The composite is a weighted blend of 9 inputs, each scored 0–100. Each bar is that input's sub-score; the figure is the points it added to the 100-point composite (weight × sub-score).
- Cash flow +30.0/30.0
- ARV discount +15.0/15.0
- DSCR +10.0/10.0
- 1% rule +9.4/10.0
- Rent growth +4.1/5.0
- Livability +2.9/5.0
- Condition / age +2.5/5.0
- Schools +0.4/10.0
- Appreciation +0.0/10.0
$99,900
🖨 Deal sheet 📄 Offer letter ✓ Due diligence
Listing remarks MLS
Owner occupants and Public entity offers 1st 15 days please. This is a Fanniemae Homepath Property. Purchase this Property for as little as 3% down. This Property has been approved for Homepath Renovation and Mortgage Financing. Welcome to the most attractive home in the area for this Unbelievable price. 7 rooms with lots of character. From the time you enter the living room you know that you will see something special abouit this house . EZ kit nad a HAPPY Kitchen will make cooking full. Large Family room. There is a finished lower level for entertaining friends and family. Come see why this home is Specially priced just for you. Thsi one WILL NOT LAST.
Key facts
- 7,749 sq ft lot
- Garage
- Built 1952
Neighborhood map
What this means for you Summary
Snapshot
- This is a 3-bed/1.5-bath single-family listed at $100k.
Deal economics
- At list price, monthly cash flow is $432 ($5k/yr) — positive.
- The deal already cash-flows at list — no discount required.
- Meets the 1% rule at list price ($1k rent vs $100k).
- Cap rate 11.5% vs local median 9.5% in Bellefontaine Neighbors — meaningfully above typical; check what's discounted (condition, days-on-market, listing class) to confirm the premium yield is real.
Location & tenants
- Location reads 58/100 on livability (#592 in MO) — a working-class tenant base; expect higher turnover. Strengths: cost of living A+, housing B+; Watch: employment D+, crime F, amenities F.
- Riverview Gardens (suburban): math 2% / reading 9% proficiency, ranked #324 of 324 in MO (top 100%) — low school quality limits family demand, transient renter base, plan for 1-2y turnover; 90% free/reduced lunch — lower-income household profile, screen leases tightly.
- Zoned schools: Gibson Elem. (math 0% / reading 7%, grade F, #1,097 of 1,115 statewide, top 98%, 429 students, 99% FRL); Riverview Gardens Sr. High (math 2% / reading 18%, grade F, #501 of 521 statewide, top 97%, 1,331 students, 100% FRL).
- Market conditions: Rents rising fast (+6.6%/yr); 201 active listings in the ZIP; 40 comparable units currently listed for rent nearby; rentals at typical pace (median 22d on market — plan ~3-4 weeks tenant-placement turnaround); lower-income renter base — watch delinquency; 920 units permitted in St. Louis County in 2024 (250 in 5+ unit buildings).
- This rent runs 40% of the median local income ($43k/yr) — at the standard rent-burdened threshold; future hikes will face affordability resistance.
Forward outlook
- Local home prices are declining (-3.0%/yr); year-one equity from $691 of loan paydown is wiped out by about $3k of value loss. Plan a longer hold.
- At projected returns (-3.0% appreciation + 6.6% rent growth), your $28k cash investment doubles in ~6 years — after that, you're playing with house money.
Negotiation context
- Only 11 days on market — expect competitive offers; lowballing is unlikely to land.
- 2 sale attempts since 14y ago with the ask held roughly flat each time — persistent listings suggest the price (not the market) is what's stuck; bring a comps-based counter.
Risks & watch-outs
- Watch-outs: built in 1952 — expect roof / HVAC / electrical / plumbing capex.
- Climate carrying-cost: extreme-heat days projected 7→21/yr by 2055 (HVAC capex compounding) — expect insurance premiums to compound above CPI over the hold.
Questions for the listing agent
- Built in 1952 — when were the roof, HVAC, electrical panel, plumbing, and water heater last replaced?
- Is there a deadline driving the sale (1031 exchange, divorce, estate, relocation)? That informs how much negotiation room exists.
- Schools are F-rated, which usually means shorter tenancies and higher turnover. Who's the typical renter profile here, and what's been the actual vacancy rate?
- Crime grade is F in this area — have there been break-ins, vandalism, or insurance claims at this property in the last 3 years? What carrier currently insures it and at what premium?
- What's the average days-on-market for RENTAL listings here right now (not sales)? A rising rental-DOM trend means longer vacancies and softer asking-rent achievability than the comps imply.
- What's the recent tenant-quality profile in this submarket — average credit score on applications, eviction rate, late-payment / NSF rate, and stable-employment percentage? A property-management company in the area should have these aggregated.
- How much new for-sale + rental construction is in the pipeline within 1–3 miles? Heavy new supply typically softens prices + rents 12–24 months out; constrained supply supports both.
Investment metrics
- 1% rule
- 1.44% ✓
- Cap rate
- 11.48%
- Cash-on-cash
- 18.54%
- DSCR
- 1.82
- GRM
- 5.8
CMA / ARV
- ARV (on-the-fly)
- $131,040
- Comps found
- 12
Show comp detail 12 sales within ~0.75 mi
| Address | Dist | Beds/Ba | Sqft | Sold | Price | $/sf | Match |
|---|---|---|---|---|---|---|---|
| 10249 Coburg Lands Dr | 0.12mi | 3/2.0 | 1,212 (-3%) | 6mo | $115,000 | $95 | 82 |
| 1443 Attica Dr | 0.42mi | 3/1.0 | 1,302 (+4%) | 3mo | $159,600 | $123 | 69 |
| 10233 Unicorn Dr | 0.06mi | 2/1.0 (-1) | 1,116 (-11%) | 6mo | $146,450 | $131 | 68 |
| 1331 Norchester Dr | 0.63mi | 3/2.0 | 1,240 (-1%) | 2mo | $209,900 | $169 | 66 |
| 1250 Admiral Dr | 0.66mi | 3/2.0 | 1,287 (+3%) | 4mo | $115,000 | $89 | 59 |
| 10201 Surf Dr | 0.29mi | 3/2.0 | 1,074 (-14%) | 5mo | $114,900 | $107 | 57 |
| 1295 Chambers Rd | 0.41mi | 2/2.0 (-1) | 1,148 (-8%) | 7mo | $87,000 | $76 | 55 |
| 808 Bella Ln | 0.66mi | 4/2.0 (+1) | 1,300 (+4%) | 2mo | $104,900 | $81 | 54 |
| 10006 Castle Dr | 0.75mi | 3/1.0 | 1,178 (-6%) | 5mo | $35,900 | $30 | 50 |
| 1222 Hoyt Dr | 0.51mi | 3/2.0 | 1,072 (-14%) | 4mo | $120,000 | $112 | 47 |
| 10300 Toelle Ln | 0.69mi | 3/2.0 | 1,423 (+14%) | 2mo | $125,000 | $88 | 40 |
| 10240 Toelle Ln | 0.68mi | 3/2.0 | 1,424 (+14%) | 3mo | $150,000 | $105 | 40 |
Match score weights: distance 35% · size 25% · config 20% · recency 20%. Top-matched comps best support the ARV.
Projected returns pro-forma
-3.0% appreciation · 6.59% rent growth · sell at horizon
- IRR
- 14.3%
- Equity multiple
- 1.60×
- Total profit
- $16,752
- Equity at exit
- $14,895
- IRR
- 25.7%
- Equity multiple
- 3.64×
- Total profit
- $73,944
- Equity at exit
- $8,638
Cash invested: $27,972 (down + closing). Projections, not guarantees.
Landlord ↔ Tenant lean methodology
- Overall (STATE)
- 81 Strongly Landlord-Friendly
- State Missouri
- 81 Strongly Landlord-Friendly · R+10
- County
- — inherits STATE
- City
- — inherits STATE
ZIP-level market 63137
- Rents YoY
- 6.6%
- Active inventory
- 201
- Price-to-rent
- 5.8×
Monthly cashflow live
- Estimated rent
- $1,439 high interval (Pro) →
- Mortgage (P&I)
- −$524
- Tax from tax record
- −$139 /mo · $1,668/yr
- Insurance
- −$42
- HOA
- −$0
- Vacancy / Maint / Mgmt
- −$302
- Net cashflow
- $432
Break-even live
UW: 25.0% down · 7.5% · 30yr · 1.5% tax · 5.0% vac · 8.0% maint · 8.0% mgmt
Financing live
Cash to close
- Down payment
- $24,975
- Closing costs
- $2,997
- Reserves months
- —
- Total cash needed
- —
Loan-product check · same deal, 3 products live
Conventional
25% down · 7.5% · 30yr
- Down + closing
- —
- Monthly P&I
- —
- Monthly cashflow
- —
- DSCR
- —
- Eligible?
- —
Personal DTI + credit; lowest rate.
DSCR
20% down · 8.5% · 30yr
- Down + closing
- —
- Monthly P&I
- —
- Monthly cashflow
- —
- DSCR
- —
- Eligible?
- —
No personal income docs; deal must DSCR.
Hard money
10% down · 12.0% · 12mo
- Down + closing
- —
- Monthly P&I
- —
- Monthly cashflow
- —
- DSCR
- —
- Eligible?
- —
Short-term bridge; refi at stabilization.
Rent comps 40 comps
| Address | Beds | Baths | Sqft | Rent | $/sqft | DOM | Units | Dist |
|---|---|---|---|---|---|---|---|---|
| 10200 Tappan Dr Saint Louis, MO | 3.0 | 1.0 | 912 | $1,450 | $1.59 | 16d | 1 | 0.04mi |
| 1255 Bosworth Dr Saint Louis, MO | 3.0 | 1.0 | 1071 | $1,575 | $1.47 | 11d | 1 | 0.29mi |
| 1115 Bakewell Dr Saint Louis, MO | 3.0 | 1.0 | 916 | $1,300 | $1.42 | 44d | 1 | 0.30mi |
| 10367 Coburg Lands Dr Saint Louis, MO | 3.0 | 1.0 | 912 | $1,270 | $1.39 | 44d | 1 | 0.31mi |
| 1253 Avant Dr Saint Louis, MO | 2.0 | 1.0 | 795 | $1,295 | $1.63 | 18d | 1 | 0.33mi |
| 1253 Avant Dr Saint Louis, MO | 2.0 | 1.0 | 795 | $1,295 | $1.63 | 15d | 1 | 0.33mi |
| 1009 Bliss Dr Saint Louis, MO | 3.0 | 1.0 | 912 | $1,400 | $1.54 | 44d | 1 | 0.36mi |
| 1230 Roxton Dr Saint Louis, MO | 3.0 | 1.0 | 912 | $1,400 | $1.54 | 22d | 1 | 0.42mi |
| 1520 Attica Dr Saint Louis, MO | 2.0 | 1.0 | 1062 | $1,200 | $1.13 | 24d | 1 | 0.50mi |
| 10203 Trio Ln Saint Louis, MO | 3.0 | 1.0 | 912 | $1,435 | $1.57 | 16d | 1 | 0.50mi |
| 1238 Hoyt Dr Saint Louis, MO | 3.0 | 1.0 | 1176 | $1,400 | $1.19 | 22d | 1 | 0.56mi |
| 10508 Druid Dr Saint Louis, MO | 3.0 | 1.0 | 1122 | $1,475 | $1.31 | 16d | 1 | 0.57mi |
| 1208 Rapid Dr Saint Louis, MO | 3.0 | 1.0 | 992 | $1,375 | $1.39 | 4d | 1 | 0.59mi |
| 808 Bella Ln Saint Louis, MO | 4.0 | 2.0 | 1300 | $1,650 | $1.27 | 17d | 1 | 0.63mi |
| 815 Bella Ln Saint Louis, MO | 3.0 | 1.0 | 864 | $1,275 | $1.48 | 44d | 1 | 0.64mi |
| 1130 Forest Home Dr Saint Louis, MO | 3.0 | 1.0 | 1025 | $1,275 | $1.24 | 44d | 1 | 0.67mi |
| 10066 Dorothy Ave Saint Louis, MO | 2.0 | 1.0 | 916 | $1,225 | $1.34 | 22d | 1 | 0.69mi |
| 9908 Norbridge Ln Saint Louis, MO | 2.0 | 2.0 | 1240 | $1,650 | $1.33 | 19d | 1 | 0.70mi |
| 10052 Lilac Ave Saint Louis, MO | 3.0 | 1.5 | 1143 | $1,100 | $0.96 | 8d | 1 | 0.84mi |
| 637 Karess Dr Saint Louis, MO | 2.0 | 2.0 | 1190 | $1,525 | $1.28 | 12d | 1 | 0.85mi |
| 9943 Lilac Dr Saint Louis, MO | 2.0 | 1.0 | 1086 | $1,000 | $0.92 | 44d | 1 | 0.88mi |
| 9924 Gloucester Dr Saint Louis, MO | 3.0 | 2.0 | 992 | $1,565 | $1.58 | 11d | 1 | 0.88mi |
| 10201 Gourock Dr Saint Louis, MO | 3.0 | 1.0 | 886 | $1,275 | $1.44 | 44d | 1 | 0.89mi |
| 1205 Shepley Dr Saint Louis, MO | 3.0 | 1.0 | 901 | $1,350 | $1.50 | 44d | 1 | 0.90mi |
| 1205 Shepley Dr Saint Louis, MO | 3.0 | 1.0 | 901 | $1,325 | $1.47 | 24d | 1 | 0.90mi |
| 10421 Gardo Ct Saint Louis, MO | 3.0 | 2.0 | 1000 | $1,395 | $1.40 | 15d | 1 | 0.90mi |
| 10139 Royal Dr Saint Louis, MO | 2.0 | 1.0 | 1016 | $900 | $0.89 | 44d | 1 | 0.90mi |
| 10421 Prince Dr Saint Louis, MO | 3.0 | 2.0 | 1023 | $1,275 | $1.25 | 24d | 1 | 0.94mi |
| 10401 Hobkirk Dr Saint Louis, MO | 3.0 | 1.0 | 1050 | $1,500 | $1.43 | 17d | 1 | 0.95mi |
| 10113 Duke Dr Saint Louis, MO | 3.0 | 1.0 | 770 | $1,325 | $1.72 | 44d | 1 | 0.96mi |
| 10441 Prince Dr Saint Louis, MO | 4.0 | 1.5 | 1380 | $1,380 | $1.00 | 44d | 1 | 0.96mi |
| 743 Shepley Dr Saint Louis, MO | 3.0 | 1.0 | 932 | $1,025 | $1.10 | 8d | 1 | 0.97mi |
| 10052 Diamond Dr Saint Louis, MO | 4.0 | 1.0 | 1181 | $1,495 | $1.27 | 12d | 1 | 0.97mi |
| 623 Ludlow Dr Saint Louis, MO | 2.0 | 1.0 | 840 | $1,199 | $1.43 | 24d | 1 | 0.98mi |
| 9811 Lilac Dr Unit I St. Louis, MO | 2.0 | 1.0 | 705 | $799 | $1.13 | 44d | 1 | 1.01mi |
| 10557 Castle Dr Saint Louis, MO | 3.0 | 2.0 | 1023 | $1,300 | $1.27 | 15d | 1 | 1.01mi |
| 10213 Durness Dr Saint Louis, MO | 2.0 | 1.0 | 932 | $1,225 | $1.31 | 44d | 1 | 1.03mi |
| 10404 Earl Dr Saint Louis, MO | 2.0 | 1.0 | 770 | $1,100 | $1.43 | 4d | 1 | 1.07mi |
| 10501 Duke Dr Saint Louis, MO | 2.0 | 1.0 | 1140 | $1,090 | $0.96 | 44d | 1 | 1.09mi |
| 9723 Portage Dr Saint Louis, MO | 3.0 | 1.0 | 1014 | $1,450 | $1.43 | 8d | 1 | 1.10mi |
Listing history 9 events
-
2026-04-12status Pending
-
2026-04-01$99,900 Active
-
2026-03-31historical $99,900
-
2015-09-01soldstatus $15,382,732
-
2012-11-05soldstatus 678-char remark
Show marketing remark (678 chars)
Owner occupants and Public entity offers 1st 15 days please. This is a Fanniemae Homepath Property. Purchase this Property for as little as 3% down. This Property has been approved for Homepath Renovation and Mortgage Financing. Welcome to the most attractive home in the area for this Unbelievable price. 7 rooms with lots of character. From the time you enter the living room you know that you will see something special abouit this house . EZ kit nad a HAPPY Kitchen will make cooking full. Large Family room. There is a finished lower level for entertaining friends and family. Come see why this home is Specially priced just for you. Thsi one WILL NOT LAST.
-
2012-08-13$26,500 678-char remark
Show marketing remark (678 chars)
Owner occupants and Public entity offers 1st 15 days please. This is a Fanniemae Homepath Property. Purchase this Property for as little as 3% down. This Property has been approved for Homepath Renovation and Mortgage Financing. Welcome to the most attractive home in the area for this Unbelievable price. 7 rooms with lots of character. From the time you enter the living room you know that you will see something special abouit this house . EZ kit nad a HAPPY Kitchen will make cooking full. Large Family room. There is a finished lower level for entertaining friends and family. Come see why this home is Specially priced just for you. Thsi one WILL NOT LAST.
-
2012-07-03soldstatus $81,790
-
2005-10-05soldstatus $94,000
-
1997-02-21soldstatus
ⓘ Source: listings_history table (triggers on properties + properties_extension) + one-shot
backfill from property_details.listing_events for pre-trigger history.
Tax reassessment forecast MO · Resets to sale price
- Current annual tax
- $1,668 · $139/mo
- Projected year-2 tax
- $1,668 · $139/mo
- Expected delta
- $0/yr ($0/mo · 0.0%)
ⓘ Screening estimate from a state-policy table — verify with the county assessor before closing.
Climate risk First Street
- Flood 1/10 Low FEMA zone X (unshaded) · 0% chance over 30 yrs
- Wildfire 1/10 Low
- Heat 5/10 Major 7 d/yr ≥107°F today · 21 d/yr by 30 yrs out
- Wind 2/10 Low 100% chance of damaging wind over 30 yrs
- Air quality 4/10 Moderate 4 unhealthy d/yr today · 5 by 30 yrs out
Nearby sold comps map
Loading sold comps map…
Walkable amenities ~0.75 mi
Loading nearby amenities…
Taxation est. · year 1
- Rental income
- $17,266
- − Mortgage interest
- −$5,596
- − Property taxes
- −$1,668
- − Insurance
- −$500
- − Repairs & maintenance
- −$1,381
- − Management
- −$1,381
- − Depreciation
- −$2,906
- Taxable income
- $3,834
- Est. tax owed @ 24.0%
- −$920
- After-tax cash flow
- $4,266/yr
For passive investors: Depreciation is non-cash, so a rental often shows a tax loss while cash-flowing — sheltering income. Rental losses are passive: they offset passive income freely, and up to $25,000/yr can offset ordinary (W-2) income if you actively participate and your MAGI is under $100k (phasing out to $0 by $150k); unused losses carry forward. On sale, claimed depreciation is recaptured at up to 25%, and gains may owe capital-gains tax (a 1031 exchange can defer both). Figures are a year-1 estimate at your 24.0% rate — not tax advice; consult a CPA.
Schools (NCES district)
- District
- Riverview Gardens
- NCES district ID
- 2926670
- Math proficiency
- 2% ▼ -6.00%
- Reading proficiency
- 9% ▼ -6.00%
- Median HH income
- $32,759
- Composite
- 4.22/100
- National rank
- #10058
- State rank
- #324 of 324 in MO
Livability — Bellefontaine Neighbors
- Score
- 58/100
- State rank
- #592
- US rank
- #20944
Category grades
Schools grade is shown separately in the Schools card above.
Census & demographics
- Census place
- Bellefontaine Neighbors, MO
- County
- Saint Louis County · 888,823 people
- Metro
- St. Louis, MO-IL
- Population (ZIP)
- 19,684
- Household income
- $43,422
- Rent vs Own
- Severe rent burden
- 1863.0
Population outlook (St. Louis County) Hauer SSP2
- Today (2025)
- 1,025,227 people
- By 2030
- 1,028,023 · +0.3%
- By 2040
- 1,020,940 · -0.4%
- By 2050
- 1,007,280 · -1.8%
- By 2075
- 987,277 · -3.7%
- By 2100
- 921,984 · -10.1%
Race, ethnicity, and origin ACS 2023
- Neighborhood character
- Predominantly Black (82%)
- Race & ethnicity
- Black 82% White 13% Two or more races 3%
- Common ancestry
- Romanian 1% Lithuanian 1% Italian 1%
- Foreign-born
- 1%
Political lean MEDSL · St. Louis
- 2024 margin
- Strong D (+23.4) · D 60.8% · R 37.4% · Other 1.7%
- 2008→2024 swing
- +3.5pp toward D · 2008: 19.9pp · 2024: 23.4pp
- All cycles
- 2024: D+23.4 2020: D+24.0 2016: D+16.2 2012: D+13.7 2008: D+19.9
Not yet ingested
- Civics
- —
Market trends
- HPI YoY
- ▼ -96.70%
- Current HPI
- 130.6765
- Rent YoY
- ▲ 6.59%
- Metro
- St. Louis, MO-IL
- State GDP YoY
- ▲ 1.84%
- F500 in state
- 20
Industry mix (Fortune 500 HQ in MO)
| Industry | F500 HQs | Revenue |
|---|---|---|
| Healthcare | 1 | $163B |
|
||
| Insurance | 1 | $21B |
|
||
| Industrial Technology | 1 | $17B |
|
||
| Retail | 1 | $16B |
|
||
| Industrial Distribution | 1 | $10B |
|
||
| Utilities | 1 | $9B |
|
||
Price history
+6.3% since first listed9 events — show timeline
- 2026-04-12 Pending — MARIS as Distributed by MLS Grid
- 2026-04-01 Listed $99,900 MARIS as Distributed by MLS Grid
- 2026-03-31 Coming Soon $99,900 MARIS as Distributed by MLS Grid
- 2015-09-01 Sold (Public Records) $15,382,732 Public Records
- 2012-11-05 Sold (MLS) — MARIS as Distributed by MLS Grid
- 2012-08-13 Listed $26,500 MARIS as Distributed by MLS Grid
- 2012-07-03 Sold (Public Records) $81,790 Public Records
- 2005-10-05 Sold (Public Records) $94,000 Public Records
- 1997-02-21 Sold (Public Records) — Public Records
Property tax history
+9.1%/yrLatest (2022): $1,668 · +0.9% YoY. Source: county tax records.
Cash-flow waterfall
monthlySold comps — $/sqft
last 12 mo · ≤1 miLoading sold comps…