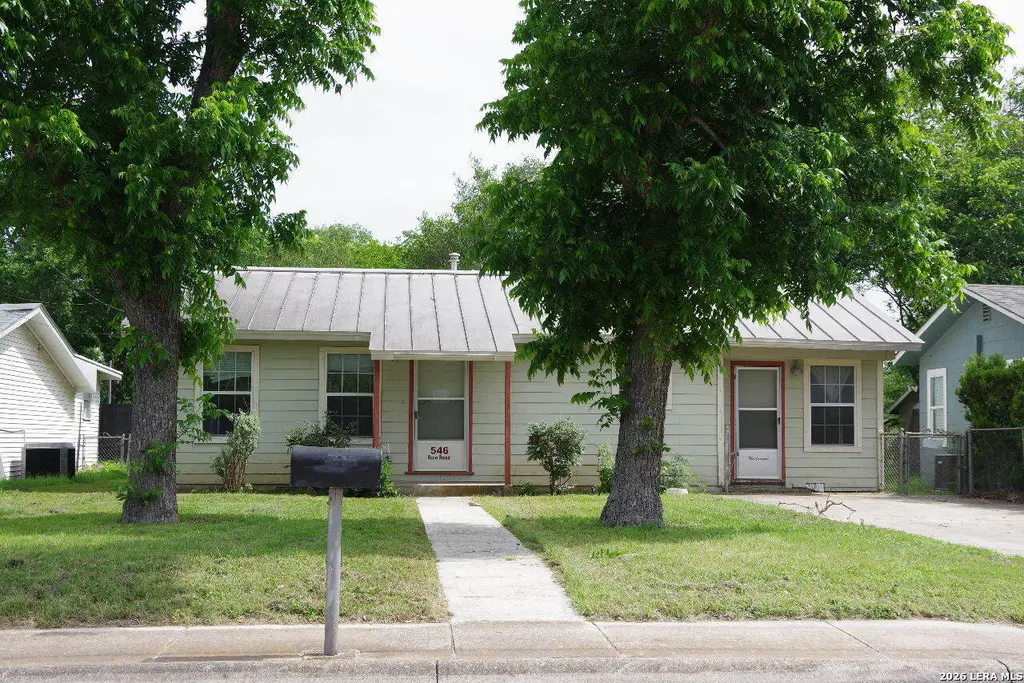
546 Rice Rd · San Antonio, TX
Flood risk 1/10 · Minimal
- FEMA flood zone
- X (unshaded)
- Chance of flooding over 30 yrs
- 0.0%
- Est. flood insurance / yr
- $507 – $1,088
Fire risk 1/10 · Minimal
- Est. fire insurance / yr
- $1,222 – $2,270
Heat risk 8/10 · Major
- Hot days now (above 108°F)
- 7 days/yr
- Hot days in 30 yrs
- 22 days/yr
Wind risk 8/10 · Major
- Chance of severe wind over 30 yrs
- 80.0%
Air-quality risk 2/10 · Minimal
- Unhealthy air days now
- 0 days/yr
- Unhealthy air days in 30 yrs
- 2 days/yr
Risk factors via First Street. Map © Google.
Why this score? — see what drove the B+ grade
The composite is a weighted blend of 9 inputs, each scored 0–100. Each bar is that input's sub-score; the figure is the points it added to the 100-point composite (weight × sub-score).
- Cash flow +25.1/30.0
- ARV discount +15.0/15.0
- Appreciation +10.0/10.0
- DSCR +8.2/10.0
- 1% rule +7.9/10.0
- Livability +4.0/5.0
- Rent growth +2.6/5.0
- Condition / age +2.5/5.0
- Schools +1.4/10.0
$105,000
🖨 Deal sheet 📄 Offer letter ✓ Due diligence
Listing remarks
Charming 2-bedroom, 1-bath home nestled in an established San Antonio neighborhood with easy access to shopping, dining, and everyday conveniences. Inside, you'll find a spacious living room, an oversized primary bedroom, and a large eat-in kitchen with plenty of room to gather. A versatile bonus room offers endless possibilities as a dining room, family room, office, or play space. Relax under the covered back patio while enjoying the large backyard shaded by mature trees. Pet owners will appreciate the separately fenced dog run complete with a storage shed. Comfortable, functional, and full of potential-this home is ready for its next owner! Sold as-is.
Key facts
- Large eat-in kitchen
- Large backyard
- Covered back patio
Tags
Property features AI
Finance
- Other: Possession at closing/funding; For sale (not a short sale)
- HOA & community: Subdivision: Rice Road
Exterior
- Parking: 2-car garage
- Utilities: City water; City sewer; Power available
- Home design: Siding exterior; Pre-owned property; Approximately 72 years old
- Construction: Slab foundation; Metal roof
- Exterior features: Covered patio; Chain link fence; Storage building/shed; Mature trees; Dog run/kennel
Interior
- Kitchen: Stove/Range; Eat-in layout; Kitchen size approximately 13 x 10
- Bedrooms: Master bedroom on lower level with ceiling fan (12 x 19); Second bedroom (12 x 12)
- Flooring: Ceramic tile; Laminate
- Bathrooms: 1 full bathroom
- Heating & cooling: Central heating (electric); Central air conditioning
- Interior features: Ceiling fans; Two living areas; Eat-in kitchen; Some window coverings remain
- Laundry & utility: Washer connection; Dryer connection; Utility room approximately 15 x 5
Neighborhood map
What this means for you Summary
Snapshot
- This is a 3-bed/1.0-bath single-family listed at $105k.
Deal economics
- At list price, monthly cash flow is $231 ($3k/yr) — positive.
- The deal already cash-flows at list — no discount required.
- Meets the 1% rule at list price ($1k rent vs $105k).
- Cap rate 8.9% vs local median 3.8% in San Antonio — top-decile yield for the area; either an underpriced asset or a hidden risk that comps aren't pricing in. Stress-test before assuming the spread holds.
Location & tenants
- Location reads 80/100 on livability (#31 in TX, #1,616 nationally) — a professional / high-income tenant draw. Strengths: amenities A+, commute A+, cost of living A+; Watch: schools C-, crime F.
- San Antonio ISD (urban): math 12% / reading 22% proficiency, ranked #805 of 826 in TX (top 98%) — low school quality limits family demand, transient renter base, plan for 1-2y turnover; 80% free/reduced lunch — lower-income household profile, screen leases tightly.
- Market conditions: Rents flat; 113 active listings in the ZIP; 31 comparable units currently listed for rent nearby; rentals at typical pace (median 22d on market — plan ~3-4 weeks tenant-placement turnaround); lower-income renter base — watch delinquency; 8,308 units permitted in Bexar County in 2024 (2,506 in 5+ unit buildings).
- This rent runs 39% of the median local income ($42k/yr) — at the standard rent-burdened threshold; future hikes will face affordability resistance.
Forward outlook
- In year one you build about $11k of equity ($726 loan paydown + $10k appreciation (10.0% local appreciation)).
- Bexar County population projected at +50% by 2050 — long-run rental-demand tailwind backs the buy-and-hold thesis.
- At projected returns (10.0% appreciation + 0.5% rent growth), your $29k cash investment doubles in ~3 years — after that, you're playing with house money.
- By year 4, paydown + projected appreciation supports a ~$40k cash-out refi (75% LTV) — recoverable capital for the next deal without selling this one.
Negotiation context
- Only 14 days on market — expect competitive offers; lowballing is unlikely to land.
- 3 sale attempts with the ask held roughly flat each time — persistent listings suggest the price (not the market) is what's stuck; bring a comps-based counter.
Risks & watch-outs
- Watch-outs: property tax is 2.7% of price; built in 1954 — expect roof / HVAC / electrical / plumbing capex.
- Climate carrying-cost: severe wind risk, 80% chance of damaging wind over 30y; extreme-heat days projected 7→22/yr by 2055 (HVAC capex compounding) — expect insurance premiums to compound above CPI over the hold.
Questions for the listing agent
- Built in 1954 — when were the roof, HVAC, electrical panel, plumbing, and water heater last replaced?
- Property tax is high relative to price — has the assessment been appealed recently, and will the sale trigger a re-assessment?
- Is there a deadline driving the sale (1031 exchange, divorce, estate, relocation)? That informs how much negotiation room exists.
- Crime grade is F in this area — have there been break-ins, vandalism, or insurance claims at this property in the last 3 years? What carrier currently insures it and at what premium?
- What's the average days-on-market for RENTAL listings here right now (not sales)? A rising rental-DOM trend means longer vacancies and softer asking-rent achievability than the comps imply.
- What's the recent tenant-quality profile in this submarket — average credit score on applications, eviction rate, late-payment / NSF rate, and stable-employment percentage? A property-management company in the area should have these aggregated.
- How much new for-sale + rental construction is in the pipeline within 1–3 miles? Heavy new supply typically softens prices + rents 12–24 months out; constrained supply supports both.
Investment metrics
- 1% rule
- 1.29% ✓
- Cap rate
- 8.93%
- Cash-on-cash
- 9.43%
- DSCR
- 1.42
- GRM
- 6.5
CMA / ARV
- ARV (on-the-fly)
- $136,080
- Comps found
- 12
Show comp detail 12 sales within ~0.75 mi
| Address | Dist | Beds/Ba | Sqft | Sold | Price | $/sf | Match |
|---|---|---|---|---|---|---|---|
| 132 Schumacher | 0.15mi | 2/1.0 (-1) | 1,038 (-4%) | 5mo | $200,000 | $193 | 77 |
| 514 Rice Rd | 0.09mi | 3/1.0 | 988 (-8%) | 7mo | $66,000 | $67 | 75 |
| 330 Orchard | 0.08mi | 3/1.0 | 940 (-13%) | 4mo | $125,000 | $133 | 71 |
| 4614 Bernadine | 0.50mi | 3/1.0 | 1,092 (+1%) | 12mo | $159,900 | $146 | 64 |
| 607 Dorie St | 0.61mi | 3/1.0 | 1,111 (+3%) | 6mo | $115,000 | $104 | 62 |
| 234 Charcliff Dr | 0.68mi | 3/1.0 | 1,080 (0%) | 8mo | $136,000 | $126 | 61 |
| 4319 Algruth Dr | 0.58mi | 3/2.0 | 1,021 (-6%) | 3mo | $183,000 | $179 | 58 |
| 255 Charcliff | 0.70mi | 3/1.0 | 1,098 (+2%) | 9mo | $134,500 | $122 | 56 |
| 4618 Lakewood | 0.62mi | 3/1.5 | 1,003 (-7%) | 3mo | $99,000 | $99 | 54 |
| 4606 Old Coach | 0.71mi | 3/1.0 | 1,008 (-7%) | 8mo | $60,000 | $60 | 50 |
| 4722 Creekmoor | 0.65mi | 3/2.0 | 1,206 (+12%) | 12mo | $194,500 | $161 | 36 |
| 4631 Lakewood Dr | 0.63mi | 3/2.0 | 1,212 (+12%) | 18mo | $145,000 | $120 | 31 |
Match score weights: distance 35% · size 25% · config 20% · recency 20%. Top-matched comps best support the ARV.
Projected returns pro-forma
10.0% appreciation · 0.53% rent growth · sell at horizon
- IRR
- 30.0%
- Equity multiple
- 3.34×
- Total profit
- $68,720
- Equity at exit
- $94,592
- IRR
- 25.2%
- Equity multiple
- 7.29×
- Total profit
- $184,974
- Equity at exit
- $203,992
Cash invested: $29,400 (down + closing). Projections, not guarantees.
Landlord ↔ Tenant lean methodology
- Overall (STATE)
- 87 Strongly Landlord-Friendly
- State Texas
- 87 Strongly Landlord-Friendly · R+5
- County
- — inherits STATE
- City
- — inherits STATE
ZIP-level market 78220
- Home prices YoY
- 9.1%
- Rents YoY
- 0.5%
- Active inventory
- 113
- Price-to-rent
- 6.5×
Monthly cashflow live
- Estimated rent
- $1,349 high interval (Pro) →
- Mortgage (P&I)
- −$551
- Tax from tax record
- −$241 /mo · $2,887/yr
- Insurance
- −$44
- HOA
- −$0
- Vacancy / Maint / Mgmt
- −$283
- Net cashflow
- $231
Break-even live
UW: 25.0% down · 7.5% · 30yr · 1.5% tax · 5.0% vac · 8.0% maint · 8.0% mgmt
Financing live
Cash to close
- Down payment
- $26,250
- Closing costs
- $3,150
- Reserves months
- —
- Total cash needed
- —
Loan-product check · same deal, 3 products live
Conventional
25% down · 7.5% · 30yr
- Down + closing
- —
- Monthly P&I
- —
- Monthly cashflow
- —
- DSCR
- —
- Eligible?
- —
Personal DTI + credit; lowest rate.
DSCR
20% down · 8.5% · 30yr
- Down + closing
- —
- Monthly P&I
- —
- Monthly cashflow
- —
- DSCR
- —
- Eligible?
- —
No personal income docs; deal must DSCR.
Hard money
10% down · 12.0% · 12mo
- Down + closing
- —
- Monthly P&I
- —
- Monthly cashflow
- —
- DSCR
- —
- Eligible?
- —
Short-term bridge; refi at stabilization.
Rent comps 31 comps
| Address | Beds | Baths | Sqft | Rent | $/sqft | DOM | Units | Dist |
|---|---|---|---|---|---|---|---|---|
| 262 Orchard Rd San Antonio, TX | 3.0 | 1.0 | 1134 | $1,250 | $1.10 | 44d | 1 | 0.08mi |
| 1311 W Hein Rd Unit 18 San Antonio, TX | 2.0 | 1.5 | 900 | $895 | $0.99 | 44d | 1 | 0.29mi |
| 1311 W Hein Rd Unit 4 San Antonio, TX | 2.0 | 2.0 | 1000 | $1,000 | $1.00 | 44d | 1 | 0.29mi |
| 4426 N Hein Rd Apt 2204 San Antonio, TX | 2.0 | 1.0 | 723 | $1,250 | $1.73 | 44d | 1 | 0.32mi |
| 817 Cresthill Rd San Antonio, TX | 3.0 | 1.0 | 950 | $1,300 | $1.37 | 44d | 1 | 0.45mi |
| 4519 Creekmoor Dr San Antonio, TX | 3.0 | 2.0 | 1239 | $1,395 | $1.13 | 11d | 1 | 0.51mi |
| 4319 Algruth Dr San Antonio, TX | 3.0 | 2.0 | 1021 | $1,800 | $1.76 | 24d | 1 | 0.58mi |
| 547 Dorie St San Antonio, TX | 3.0 | 2.0 | 909 | $1,135 | $1.25 | 22d | 1 | 0.64mi |
| 2906 Lavender Ln San Antonio, TX | 3.0 | 2.5 | 1247 | $1,595 | $1.28 | 16d | 1 | 0.65mi |
| 738 Sterling St San Antonio, TX | 4.0 | 1.0 | 1038 | $1,095 | $1.05 | 4d | 1 | 0.67mi |
| 4610 Lavender Ln San Antonio, TX | 3.0 | 2.0 | 1337 | $1,400 | $1.05 | 24d | 1 | 0.78mi |
| 4835 Lord Rd Unit 710 San Antonio, TX | 2.0 | 2.0 | 949 | $874 | $0.92 | 3d | 1 | 0.82mi |
| 368 Readwell Dr San Antonio, TX | 3.0 | 1.0 | 1067 | $1,200 | $1.12 | 44d | 1 | 0.86mi |
| 302 Kenmar Dr San Antonio, TX | 3.0 | 1.0 | 970 | $1,375 | $1.42 | 24d | 1 | 0.92mi |
| 3327 Martin Luther King Dr Unit a San Antonio, TX | 3.0 | 2.0 | 876 | $915 | $1.04 | 2d | 1 | 0.95mi |
| 3318 Martin Luther King Dr San Antonio, TX | 3.0 | 2.0 | 909 | $975 | $1.07 | 44d | 1 | 0.96mi |
| 4606 Hollyspring Dr San Antonio, TX | 3.0 | 2.0 | 1098 | $1,400 | $1.28 | 24d | 1 | 0.99mi |
| 4938 Bernadine Dr San Antonio, TX | 3.0 | 2.0 | 1078 | $2,000 | $1.86 | 24d | 1 | 1.00mi |
| 334 Tomrob Dr San Antonio, TX | 3.0 | 1.0 | 1064 | $1,300 | $1.22 | 15d | 1 | 1.04mi |
| 3259 Martin Luther King Dr San Antonio, TX | 3.0 | 2.0 | 909 | $1,149 | $1.26 | 4d | 1 | 1.06mi |
| 458 Ferris Ave San Antonio, TX | 3.0 | 2.0 | 909 | $1,380 | $1.52 | 2d | 1 | 1.07mi |
| 302 Dorie St San Antonio, TX | 3.0 | 2.0 | 1028 | $1,285 | $1.25 | 22d | 1 | 1.09mi |
| 231 Noblewood Dr San Antonio, TX | 1.0–4.0 | 1.0–2.0 | 1084 | $1,387 | $1.28 | 24d | 1 | 1.09mi |
| 455 Lincolnshire Dr San Antonio, TX | 2.0 | 1.0 | 768 | $925 | $1.20 | 20d | 1 | 1.18mi |
| 707 SE Loop 410 San Antonio, TX | 1.0–4.0 | 1.0–2.0 | 1139 | $1,216 | $1.07 | 4d | 1 | 1.28mi |
| 610 Pecan Valley Dr San Antonio, TX | 3.0 | 1.0 | 1287 | $1,650 | $1.28 | 44d | 1 | 1.29mi |
| 164 Day Rd San Antonio, TX | 3.0 | 2.5 | 1250 | $1,667 | $1.33 | 24d | 1 | 1.33mi |
| 4611 E Houston St San Antonio, TX | 2.0–4.0 | 2.0 | 1286 | $1,290 | $1.00 | 2d | 23 | 1.34mi |
| 323 Ferris Ave San Antonio, TX | 3.0 | 2.0 | 1298 | $1,450 | $1.12 | 2d | 1 | 1.35mi |
| 311 Ferris Ave San Antonio, TX | 3.0 | 2.0 | 909 | $1,245 | $1.37 | 4d | 1 | 1.38mi |
| 3815 E Commerce St San Antonio, TX | 3.0 | 1.0–2.0 | 872 | $1,530 | $1.75 | 3d | 60 | 1.40mi |
Listing history 14 events
-
2026-06-02statusdays on market $105,000 Pending 14 DOM
-
2026-06-01days on market $105,000 Active 13 DOM
-
2026-05-31days on market $105,000 Active 12 DOM
-
2026-05-19$105,000 New
-
2026-01-20historical
-
2026-01-01historical Active Option
-
2025-10-21price $130,000
-
2025-10-19price $140,000
-
2025-10-10price $150,000
-
2025-09-29status Back on Market
-
2025-09-09status Pending
-
2025-08-27historical Active Option
-
2025-08-22price $155,000
-
2025-08-08$160,000 New
ⓘ Source: listings_history table (triggers on properties + properties_extension) + one-shot
backfill from property_details.listing_events for pre-trigger history.
Tax reassessment forecast TX · Resets to sale price
- Current annual tax
- $2,887 · $241/mo
- Projected year-2 tax
- $2,887 · $241/mo
- Expected delta
- $0/yr ($0/mo · 0.0%)
ⓘ Screening estimate from a state-policy table — verify with the county assessor before closing.
Climate risk First Street
- Flood 1/10 Low FEMA zone X (unshaded) · 0% chance over 30 yrs
- Wildfire 1/10 Low
- Heat 8/10 Severe 7 d/yr ≥108°F today · 22 d/yr by 30 yrs out
- Wind 8/10 Severe 80% chance of damaging wind over 30 yrs
- Air quality 2/10 Low 0 unhealthy d/yr today · 2 by 30 yrs out
Nearby sold comps map
Loading sold comps map…
Walkable amenities ~0.75 mi
Loading nearby amenities…
Taxation est. · year 1
- Rental income
- $16,194
- − Mortgage interest
- −$5,882
- − Property taxes
- −$2,887
- − Insurance
- −$525
- − Repairs & maintenance
- −$1,296
- − Management
- −$1,296
- − Depreciation
- −$3,055
- Taxable income
- $1,254
- Est. tax owed @ 24.0%
- −$301
- After-tax cash flow
- $2,472/yr
For passive investors: Depreciation is non-cash, so a rental often shows a tax loss while cash-flowing — sheltering income. Rental losses are passive: they offset passive income freely, and up to $25,000/yr can offset ordinary (W-2) income if you actively participate and your MAGI is under $100k (phasing out to $0 by $150k); unused losses carry forward. On sale, claimed depreciation is recaptured at up to 25%, and gains may owe capital-gains tax (a 1031 exchange can defer both). Figures are a year-1 estimate at your 24.0% rate — not tax advice; consult a CPA.
Schools (NCES district)
- District
- San Antonio ISD
- NCES district ID
- 4838730
- Math proficiency
- 12% ▼ -21.00%
- Reading proficiency
- 22% ▼ -7.00%
- Median HH income
- $30,952
- Composite
- 13.57/100
- National rank
- #9512
- State rank
- #805 of 826 in TX
Livability — San Antonio
- Score
- 80/100
- State rank
- #31
- US rank
- #1616
Category grades
Schools grade is shown separately in the Schools card above.
Census & demographics
- Census place
- San Antonio, TX
- County
- Bexar County · 1,990,555 people
- City population
- 1,806,925
- Metro
- San Antonio-New Braunfels, TX
- Population (ZIP)
- 19,423
- Household income
- $41,710
- Rent vs Own
- Severe rent burden
- 705.0
Population outlook (Bexar County) Hauer SSP2
- Today (2025)
- 2,336,851 people
- By 2030
- 2,560,728 · +9.6%
- By 2040
- 3,020,569 · +29.3%
- By 2050
- 3,493,522 · +49.5%
- By 2075
- 4,668,459 · +99.8%
- By 2100
- 5,533,242 · +136.8%
Race, ethnicity, and origin ACS 2023
- Neighborhood character
- Majority Hispanic (60%)
- Race & ethnicity
- Hispanic / Latino 60% Black 30% Two or more races 22% White 8%
- Hispanic origin (detail)
- Mexican 47% Puerto Rican 1%
- Foreign-born
- 11% · Canada
- Languages at home
- 63% English-only · Spanish 36%
Political lean MEDSL · Bexar
- 2024 margin
- Lean D (+9.8) · D 54.3% · R 44.6% · Other 1.1%
- 2008→2024 swing
- +4.2pp toward D · 2008: 5.6pp · 2024: 9.8pp
- All cycles
- 2024: D+9.8 2020: D+18.2 2016: D+13.5 2012: D+4.6 2008: D+5.6
Not yet ingested
- Civics
- —
Market trends
- HPI YoY
- ▲ 23.86%
- Current HPI
- 284.9844
- Rent YoY
- ▲ 0.53%
- Metro
- San Antonio-New Braunfels, TX
- State GDP YoY
- ▲ 3.95%
- F500 in state
- 110
Industry mix (Fortune 500 HQ in TX)
| Industry | F500 HQs | Revenue |
|---|---|---|
| Energy | 16 | $1,198B |
|
||
| Technology | 5 | $198B |
|
||
| Engineering / Construction | 4 | $72B |
|
||
| Energy Services | 3 | $60B |
|
||
| Utilities | 3 | $41B |
|
||
| Healthcare | 2 | $330B |
|
||
Price history
-34.4% since first listed11 events — show timeline
- 2026-05-19 Listed $105,000 LERA
- 2026-01-20 Listing Removed — LERA
- 2026-01-01 Contingent — LERA
- 2025-10-21 Price Changed $130,000 LERA
- 2025-10-19 Price Changed $140,000 LERA
- 2025-10-10 Price Changed $150,000 LERA
- 2025-09-29 Relisted — LERA
- 2025-09-09 Pending — LERA
- 2025-08-27 Contingent — LERA
- 2025-08-22 Price Changed $155,000 LERA
- 2025-08-08 Listed $160,000 LERA
Property tax history
+6.9%/yrLatest (2025): $2,887 · +10.0% YoY. Source: county tax records.
Cash-flow waterfall
monthlySold comps — $/sqft
last 12 mo · ≤1 miLoading sold comps…