 🏗️ New Construction
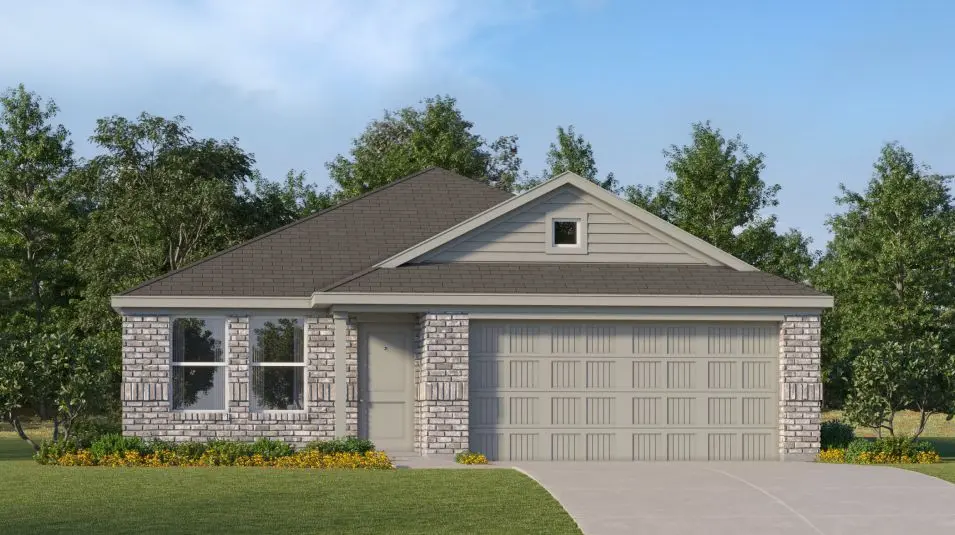
Newlin Plan · Mesquite, TX
Flood risk No data
- FEMA flood zone
- —
- Chance of flooding over 30 yrs
- —
- Est. flood insurance / yr
- —
Fire risk No data
- Est. fire insurance / yr
- —
Heat risk No data
- Hot days now (above threshold)
- —
- Hot days in 30 yrs
- —
Wind risk No data
- Chance of severe wind over 30 yrs
- —
Air-quality risk No data
- Unhealthy air days now
- —
- Unhealthy air days in 30 yrs
- —
Risk factors via First Street. Map © Google.
Why this score? — see what drove the D- grade
The composite is a weighted blend of 9 inputs, each scored 0–100. Each bar is that input's sub-score; the figure is the points it added to the 100-point composite (weight × sub-score).
- Cash flow +9.4/30.0
- ARV discount +7.5/15.0
- Condition / age +3.8/5.0
- Livability +3.5/5.0
- Schools +2.9/10.0
- 1% rule +2.8/10.0
- DSCR +2.6/10.0
- Rent growth +2.5/5.0
- Appreciation +0.0/10.0
$266,999
🖨 Deal sheet 📄 Offer letter ✓ Due diligence
Listing remarks MLS
This single-level home showcases a spacious open floorplan shared between the kitchen, dining area and family room for easy entertaining. An owner's suite enjoys a private location in a rear corner of the home, complemented by an en-suite bathroom and walk-in closet. There are two secondary bedrooms at the front of the home, which are comfortable spaces for household members and overnight guests.
Key facts
- Walk-in closet
- Open floorplan
- Secondary bedrooms
Tags
Neighborhood map
What this means for you Summary
Snapshot
- This is a 3-bed/2.0-bath single-family listed at $267k. Condition is rated good.
Deal economics
- At list price, monthly cash flow is $-223 ($-3k/yr) — negative.
- The deal already cash-flows at list — no discount required.
- To meet the 1% rule (rent ≥ 1% of price), the offer needs to be $245k (8.1% below list).
- Recommended offer: $243k (9.0% below list) — sets the bar for market timing.
- Cap rate 5.4% vs local median 4.4% in Mesquite — meaningfully above typical; check what's discounted (condition, days-on-market, listing class) to confirm the premium yield is real.
Location & tenants
- Location reads 70/100 on livability (#358 in TX) — a middle-class / working-renter tenant base. Strengths: cost of living A+, housing A+, health & safety A-; Watch: schools C-, crime F, commute F.
- Mesquite ISD (suburban): math 35% / reading 32% proficiency, ranked #536 of 826 in TX (top 65%) — families likely to look elsewhere, expect single-tenant / working-renter base with shorter leases; 63% free/reduced lunch — lower-income household profile, screen leases tightly.
- Market conditions: Rents flat; 590 active listings in the ZIP; 14 comparable units currently listed for rent nearby; rentals at typical pace (median 22d on market — plan ~3-4 weeks tenant-placement turnaround); high-income renter base; 12,577 units permitted in Dallas County in 2024 (6,829 in 5+ unit buildings).
Forward outlook
- Local home prices are declining (-3.0%/yr); year-one equity from $2k of loan paydown is wiped out by about $9k of value loss. Plan a longer hold.
- Dallas County population projected at +35% by 2050 — long-run rental-demand tailwind backs the buy-and-hold thesis.
Negotiation context
- It's been on market 96 days — a 9% lower offer ($243k) is reasonable based on typical stale-listing flexibility.
Questions for the listing agent
- What do current leases actually rent for vs. the listed asking? Can we see a recent rent roll and the last 12 months of T-12 income?
- It's been on market 96 days. Have you received any prior offers? Is the seller open to a 9% concession, seller financing, or rate buy-down credit?
- Why hasn't it sold? Are there any deal-killer items the seller is aware of (foundation, flood, title, zoning, code violations)?
- Is there a deadline driving the sale (1031 exchange, divorce, estate, relocation)? That informs how much negotiation room exists.
- Crime grade is F in this area — have there been break-ins, vandalism, or insurance claims at this property in the last 3 years? What carrier currently insures it and at what premium?
- The area grade is low — what's the realistic commute time and amenity access for the typical tenant pool here? Any planned neighborhood developments (good or bad) we should know about?
- What's the average days-on-market for RENTAL listings here right now (not sales)? A rising rental-DOM trend means longer vacancies and softer asking-rent achievability than the comps imply.
- What's the recent tenant-quality profile in this submarket — average credit score on applications, eviction rate, late-payment / NSF rate, and stable-employment percentage? A property-management company in the area should have these aggregated.
- How much new for-sale + rental construction is in the pipeline within 1–3 miles? Heavy new supply typically softens prices + rents 12–24 months out; constrained supply supports both.
Investment metrics
- 1% rule
- 0.78% ✗
- Cap rate
- 5.44%
- Cash-on-cash
- -3.06%
- DSCR
- 0.86
- GRM
- 10.6
CMA / ARV
- ARV (median comp)
- $312,873
- List price
- $266,999
- Delta
- -14.66%
- Verdict
- UNDERPRICED
- Comps
- 20 within 1.0 mi
Show comp detail 12 sales within ~0.75 mi
| Address | Dist | Beds/Ba | Sqft | Sold | Price | $/sf | Match |
|---|---|---|---|---|---|---|---|
| 129 Glenwood Dr | 0.66mi | 3/2.0 | 1,522 (0%) | 3mo | $241,999 | $159 | 66 |
| 108 Little Fox Way | 0.73mi | 3/2.0 | 1,522 (0%) | 0mo | $247,999 | $163 | 66 |
| 107 Wren Way | 0.75mi | 3/2.0 | 1,522 (0%) | 2mo | $241,124 | $158 | 64 |
| 110 Wren Way | 0.71mi | 3/2.0 | 1,522 (0%) | 4mo | $266,999 | $175 | 63 |
| 116 Pecan Flats Rd | 0.74mi | 3/2.0 | 1,461 (-4%) | 0mo | $250,999 | $172 | 58 |
| 118 Pecan Flats Rd | 0.74mi | 3/2.0 | 1,451 (-5%) | 0mo | $230,999 | $159 | 58 |
| 134 Arbor Hills Rd | 0.73mi | 3/2.0 | 1,451 (-5%) | 4mo | $246,649 | $170 | 55 |
| 107 Granite Falls Rd | 0.73mi | 4/2.0 (+1) | 1,720 (+13%) | 1mo | $278,999 | $162 | 39 |
| 112 Wren Way | 0.71mi | 4/2.0 (+1) | 1,720 (+13%) | 2mo | $263,999 | $153 | 39 |
| 131 Glenwood Dr | 0.67mi | 4/2.0 (+1) | 1,720 (+13%) | 5mo | $255,449 | $149 | 38 |
| 108 Wren Way | 0.72mi | 4/2.0 (+1) | 1,720 (+13%) | 6mo | $258,824 | $150 | 35 |
| 111 Wren Way | 0.74mi | 4/2.0 (+1) | 1,720 (+13%) | 5mo | $283,594 | $165 | 34 |
Match score weights: distance 35% · size 25% · config 20% · recency 20%. Top-matched comps best support the ARV.
Projected returns pro-forma
-3.0% appreciation · 0.07% rent growth · sell at horizon
- IRR
- -24.7%
- Equity multiple
- 0.18×
- Total profit
- $-71,902
- Equity at exit
- $46,650
- IRR
- -32.3%
- Equity multiple
- -0.23×
- Total profit
- $-107,965
- Equity at exit
- $27,052
Cash invested: $87,604 (down + closing). Projections, not guarantees.
Landlord ↔ Tenant lean methodology
- Overall (STATE)
- 87 Strongly Landlord-Friendly
- State Texas
- 87 Strongly Landlord-Friendly · R+5
- County
- — inherits STATE
- City
- — inherits STATE
ZIP-level market 75181
- Home prices YoY
- -9.4%
- Rents YoY
- 0.1%
- Active inventory
- 590
- Price-to-rent
- 9.1×
Monthly cashflow live
- Estimated rent
- $2,455 high interval (Pro) →
- Mortgage (P&I)
- −$1,641
- Tax est. 1.5%
- −$391 /mo · $4,693/yr
- Insurance
- −$130
- HOA
- −$0
- Vacancy / Maint / Mgmt
- −$515
- Net cashflow
- $-223
Break-even live
UW: 25.0% down · 7.5% · 30yr · 1.5% tax · 5.0% vac · 8.0% maint · 8.0% mgmt
Financing live
Cash to close
- Down payment
- $78,218
- Closing costs
- $9,386
- Reserves months
- —
- Total cash needed
- —
Loan-product check · same deal, 3 products live
Conventional
25% down · 7.5% · 30yr
- Down + closing
- —
- Monthly P&I
- —
- Monthly cashflow
- —
- DSCR
- —
- Eligible?
- —
Personal DTI + credit; lowest rate.
DSCR
20% down · 8.5% · 30yr
- Down + closing
- —
- Monthly P&I
- —
- Monthly cashflow
- —
- DSCR
- —
- Eligible?
- —
No personal income docs; deal must DSCR.
Hard money
10% down · 12.0% · 12mo
- Down + closing
- —
- Monthly P&I
- —
- Monthly cashflow
- —
- DSCR
- —
- Eligible?
- —
Short-term bridge; refi at stabilization.
Rent comps 14 comps
| Address | Beds | Baths | Sqft | Rent | $/sqft | DOM | Units | Dist |
|---|---|---|---|---|---|---|---|---|
| 1332 Nimitz Way Mesquite, TX | 4.0 | 2.0 | 2109 | $2,280 | $1.08 | 20d | 1 | 0.73mi |
| 2004 Poppy Way Mesquite, TX | 3.0 | 2.0 | 1572 | $2,700 | $1.72 | 43d | 1 | 0.82mi |
| 1309 Dawson Way Mesquite, TX | 4.0 | 2.0 | 1952 | $2,222 | $1.14 | 7d | 1 | 0.82mi |
| 2749 Ingram Cir Mesquite, TX | 3.0 | 2.0 | 1791 | $2,119 | $1.18 | 2d | 1 | 0.98mi |
| 2600 Waterloo Ln Mesquite, TX | 3.0 | 2.0 | 1460 | $1,900 | $1.30 | 43d | 1 | 1.20mi |
| 2805 Cameron Way Mesquite, TX | 3.0 | 2.0 | 1660 | $2,150 | $1.30 | 12d | 1 | 1.20mi |
| 815 Valleycreek Rd Mesquite, TX | 3.0 | 2.0 | 1788 | $2,500 | $1.40 | 43d | 1 | 1.24mi |
| 222 Redwood St Mesquite, TX | 3.0 | 2.0 | 1132 | $1,775 | $1.57 | 43d | 1 | 1.27mi |
| 127 Woodhill St Mesquite, TX | 3.0 | 2.0 | 1545 | $1,950 | $1.26 | 10d | 1 | 1.28mi |
| 2801 Sonora Ln Mesquite, TX | 4.0 | 2.0 | 1938 | $2,245 | $1.16 | 24d | 1 | 1.31mi |
| 2724 Windswept Ln Mesquite, TX | 3.0 | 2.0 | 1402 | $2,300 | $1.64 | 24d | 1 | 1.35mi |
| 2800 Crockett Pl Mesquite, TX | 3.0 | 2.0 | 1660 | $1,895 | $1.14 | 21d | 1 | 1.35mi |
| 4642 Elm Point Dr Balch Springs, TX | 3.0 | 2.0 | 2100 | $2,199 | $1.05 | 5d | 1 | 1.46mi |
| 1809 Osage Trl Mesquite, TX | 4.0 | 2.0 | 2022 | $2,599 | $1.29 | 17d | 1 | 1.48mi |
Listing history 15 events
-
2026-06-18days on market $266,999 Active 96 DOM
-
2026-06-17days on market $266,999 Active 95 DOM
-
2026-06-16days on market $266,999 Active 94 DOM
-
2026-06-15days on market $266,999 Active 93 DOM
-
2026-06-13days on market $266,999 Active 91 DOM
-
2026-06-13days on market $266,999 Active 90 DOM
-
2026-06-09days on market $266,999 Active 87 DOM
-
2026-06-08days on market $266,999 Active 86 DOM
-
2026-06-07days on market $266,999 Active 85 DOM
-
2026-06-04days on market $266,999 Active 82 DOM
-
2026-06-03days on market $266,999 Active 81 DOM
-
2026-06-02days on market $266,999 Active 80 DOM
-
2026-06-01days on market $266,999 Active 79 DOM
-
2026-05-31days on market $266,999 Active 78 DOM
-
2026-03-14$266,999 Active 399-char remark
Show marketing remark (399 chars)
This single-level home showcases a spacious open floorplan shared between the kitchen, dining area and family room for easy entertaining. An owner's suite enjoys a private location in a rear corner of the home, complemented by an en-suite bathroom and walk-in closet. There are two secondary bedrooms at the front of the home, which are comfortable spaces for household members and overnight guests.
ⓘ Source: listings_history table (triggers on properties + properties_extension) + one-shot
backfill from property_details.listing_events for pre-trigger history.
Nearby sold comps map
Loading sold comps map…
Walkable amenities ~0.75 mi
Loading nearby amenities…
Taxation est. · year 1
- Rental income
- $29,454
- − Mortgage interest
- −$17,526
- − Property taxes
- −$4,693
- − Insurance
- −$1,564
- − Repairs & maintenance
- −$2,356
- − Management
- −$2,356
- − Depreciation
- −$9,102
- Taxable loss
- −$8,143
- Est. tax savings @ 24.0%
- +$1,954
- After-tax cash flow
- $-723/yr
For passive investors: Depreciation is non-cash, so a rental often shows a tax loss while cash-flowing — sheltering income. Rental losses are passive: they offset passive income freely, and up to $25,000/yr can offset ordinary (W-2) income if you actively participate and your MAGI is under $100k (phasing out to $0 by $150k); unused losses carry forward. On sale, claimed depreciation is recaptured at up to 25%, and gains may owe capital-gains tax (a 1031 exchange can defer both). Figures are a year-1 estimate at your 24.0% rate — not tax advice; consult a CPA.
Condition & rehab AI · 1 photo
This single-level home is in good condition with a good condition score of 75. It is move-in ready with minor cosmetic improvements that could further enhance its resale and rental value.
Value-add opportunities
- Both Painting exterior and interior — Enhances curb appeal and interior aesthetics
- Both Landscaping improvements — Enhances curb appeal and adds value
- Both New flooring in bathrooms and kitchen — Improves functionality and aesthetics
- Both New window treatments — Enhances curb appeal and interior aesthetics
Renovation cost estimate screening
Value-add ROI direction
- Both Painting exterior and interior — Enhances curb appeal and interior aesthetics ↑
- Both Landscaping improvements — Enhances curb appeal and adds value ↑
- Both New flooring in bathrooms and kitchen — Improves functionality and aesthetics ↑
- Both New window treatments — Enhances curb appeal and interior aesthetics ↑
ⓘ Cost ranges are severity-bucket heuristics (US national rule-of-thumb). Get contractor quotes + a written scope before underwriting a rehab budget.
Schools (NCES district)
- District
- Mesquite ISD
- NCES district ID
- 4830390
- Math proficiency
- 35% ▼ -11.00%
- Reading proficiency
- 32% ▼ -7.00%
- Median HH income
- $49,372
- Composite
- 29.06/100
- National rank
- #6606
- State rank
- #536 of 826 in TX
Livability — Mesquite
- Score
- 70/100
- State rank
- #358
- US rank
- #7743
Category grades
Schools grade is shown separately in the Schools card above.
Census & demographics
- Census place
- Mesquite, TX
- County
- Dallas County · 2,612,404 people
- City population
- 150,788
- Metro
- Dallas-Fort Worth-Arlington, TX
- Population (ZIP)
- 29,788
- Household income
- $111,052
- Rent vs Own
- Severe rent burden
- 857.0
Population outlook (Dallas County) Hauer SSP2
- Today (2025)
- 2,979,839 people
- By 2030
- 3,191,823 · +7.1%
- By 2040
- 3,619,611 · +21.5%
- By 2050
- 4,026,915 · +35.1%
- By 2075
- 4,957,073 · +66.4%
- By 2100
- 5,508,725 · +84.9%
Race, ethnicity, and origin ACS 2023
- Neighborhood character
- Highly diverse neighborhood (Simpson 0.71)
- Race & ethnicity
- Black 39% Hispanic / Latino 32% Two or more races 21% White 16% Asian 5% Native American 1%
- Hispanic origin (detail)
- Mexican 27% Puerto Rican 1%
- Common ancestry
- Slovak 2% Italian 1%
- Foreign-born
- 22% · Canada, Vietnam
- Languages at home
- 64% English-only · Spanish 27% Tagalog/Filipino 3% Other Asian/Pacific 1%
Political lean MEDSL · Dallas
- 2024 margin
- Strong D (+22.2) · D 60.2% · R 38.0% · Other 1.8%
- 2008→2024 swing
- +6.9pp toward D · 2008: 15.3pp · 2024: 22.2pp
- All cycles
- 2024: D+22.2 2020: D+31.6 2016: D+26.2 2012: D+15.4 2008: D+15.3
Not yet ingested
- Civics
- —
Market trends
- HPI YoY
- ▼ -26.63%
- Current HPI
- 257.0959
- Rent YoY
- ▲ 0.07%
- Metro
- Dallas-Fort Worth-Arlington, TX
- State GDP YoY
- ▲ 3.95%
- F500 in state
- 110
Industry mix (Fortune 500 HQ in TX)
| Industry | F500 HQs | Revenue |
|---|---|---|
| Energy | 16 | $1,198B |
|
||
| Technology | 5 | $198B |
|
||
| Engineering / Construction | 4 | $72B |
|
||
| Energy Services | 3 | $60B |
|
||
| Utilities | 3 | $41B |
|
||
| Healthcare | 2 | $330B |
|
||
Price history
1 event — show timeline
- 2026-03-14 Listed $266,999 Zillow
Cash-flow waterfall
monthlySold comps — $/sqft
last 12 mo · ≤1 miLoading sold comps…