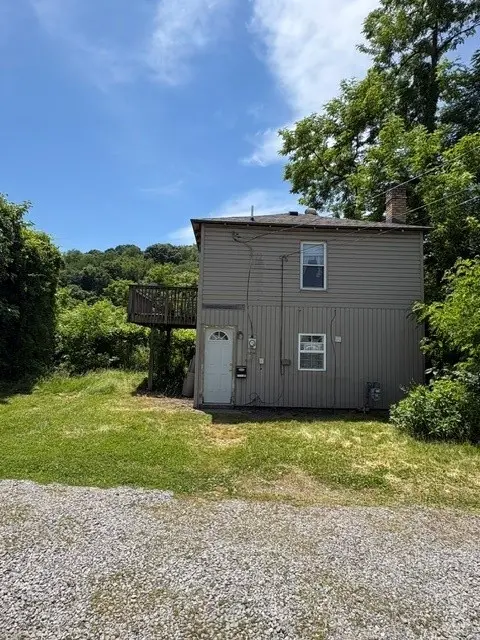
1516 Pennsylvania Ave · Monaca, PA
Flood risk 6/10 · Moderate
- FEMA flood zone
- X (unshaded)
- Chance of flooding over 30 yrs
- 0.27%
- Est. flood insurance / yr
- $473 – $860
Fire risk 1/10 · Minimal
- Est. fire insurance / yr
- $511 – $949
Heat risk 4/10 · Minor
- Hot days now (above 97°F)
- 8 days/yr
- Hot days in 30 yrs
- 19 days/yr
Wind risk 2/10 · Minimal
- Chance of severe wind over 30 yrs
- —
Air-quality risk 3/10 · Minor
- Unhealthy air days now
- 2 days/yr
- Unhealthy air days in 30 yrs
- 4 days/yr
Risk factors via First Street. Map © Google.
Why this score? — see what drove the B+ grade
The composite is a weighted blend of 9 inputs, each scored 0–100. Each bar is that input's sub-score; the figure is the points it added to the 100-point composite (weight × sub-score).
- Cash flow +30.0/30.0
- ARV discount +15.0/15.0
- 1% rule +10.0/10.0
- DSCR +10.0/10.0
- Schools +5.0/10.0
- Livability +4.0/5.0
- Rent growth +2.5/5.0
- Condition / age +2.5/5.0
- Appreciation +0.0/10.0
$50,000
🖨 Deal sheet 📄 Offer letter ✓ Due diligence
Listing remarks
Great Opportunity In Monaca ~ Single Family Detached Home With Off Street Parking ~ As You Enter The Home On The Main Level You Will Find A Large Living Room And In Unit Laundry Room ~ Upper Level Features Eat In Kitchen, Bedroom With Large Closet And Full Bathroom ~ Deck Access From The Eat In Kitchen ~ Roof Replaced In July 2025 ~ Nearby Shopping, Dining And More
Key facts
- Off street parking
- Eat in kitchen
- Deck access
Tags
Property features AI
Exterior
- Parking: Off-street parking for 2 vehicles
- Utilities: Public water; Public sewer; Electric service (standard)
- Home design: 2-story property; New construction; Vinyl siding; Asphalt roof
- Construction: New construction; Vinyl siding construction; Asphalt roof
- Exterior features: Small lot (approximately 0.03 acres)
Interior
- Kitchen: Refrigerator included
- Bedrooms: Upper level bedroom(s)
- Flooring: Carpet; Laminate
- Bathrooms: 1 full bathroom
- Heating & cooling: Forced air heating; Gas heat
- Interior features: Partially finished basement with walk-out access; Carpet and laminate flooring
- Laundry & utility: Lower level laundry area
Neighborhood map
What this means for you Summary
Snapshot
- This is a 1-bed/1.0-bath single-family listed at $50k.
Deal economics
- At list price, monthly cash flow is $416 ($5k/yr) — positive.
- The deal already cash-flows at list — no discount required.
- Meets the 1% rule at list price ($1k rent vs $50k).
Location & tenants
- Location reads 81/100 on livability (#182 in PA, #1,516 nationally) — a professional / high-income tenant draw. Strengths: crime A+, cost of living A+, housing A+; Watch: amenities F, employment D-.
- Market conditions: 78 active listings in the ZIP; 6 comparable units currently listed for rent nearby; rentals leasing fast (median 4d on market — plan ~1-2 weeks tenant-placement turnaround); 272 units permitted in Beaver County in 2024 (80 in 5+ unit buildings).
- This rent is only 16% of the median local income ($73k/yr) — well below the 30% rent-burden line; pricing power to push rent on renewal without tenant pushback.
Forward outlook
- Local home prices are declining (-3.0%/yr); year-one equity from $346 of loan paydown is wiped out by about $2k of value loss. Plan a longer hold.
- Beaver County population projected at -14% by 2050 — secular population decline; favor cash flow + early exit over multi-decade hold.
- At projected returns (-3.0% appreciation + 3.0% rent growth), your $14k cash investment doubles in ~4 years — after that, you're playing with house money.
Negotiation context
- Only 6 days on market — expect competitive offers; lowballing is unlikely to land.
- Current owner paid $9k; list at $50k implies a 456% gain — meaningful room to come down on a strong offer.
Risks & watch-outs
- Watch-outs: built in 1936 — expect roof / HVAC / electrical / plumbing capex.
- Climate carrying-cost: major flood risk — expect insurance premiums to compound above CPI over the hold.
Questions for the listing agent
- Built in 1936 — when were the roof, HVAC, electrical panel, plumbing, and water heater last replaced?
- Is there a deadline driving the sale (1031 exchange, divorce, estate, relocation)? That informs how much negotiation room exists.
- Schools are B-rated — typically a magnet for longer-tenancy family renters. What's the average tenant stay here, and is there a school-zone premium baked into asking?
- What's the average days-on-market for RENTAL listings here right now (not sales)? A rising rental-DOM trend means longer vacancies and softer asking-rent achievability than the comps imply.
- What's the recent tenant-quality profile in this submarket — average credit score on applications, eviction rate, late-payment / NSF rate, and stable-employment percentage? A property-management company in the area should have these aggregated.
- How much new for-sale + rental construction is in the pipeline within 1–3 miles? Heavy new supply typically softens prices + rents 12–24 months out; constrained supply supports both.
Investment metrics
- 1% rule
- 2.00% ✓
- Cap rate
- 16.27%
- Cash-on-cash
- 35.65%
- DSCR
- 2.59
- GRM
- 4.2
CMA / ARV
- ARV (on-the-fly)
- $78,400
- Comps found
- 3
Show comp detail 3 sales within ~0.75 mi
| Address | Dist | Beds/Ba | Sqft | Sold | Price | $/sf | Match |
|---|---|---|---|---|---|---|---|
| 1701 Indiana Ave | 0.23mi | 1/1.0 | 756 (-6%) | 5mo | $74,000 | $98 | 76 |
| 716 Kaye Ave | 0.49mi | 2/1.0 (+1) | 768 (-4%) | 22mo | $62,500 | $81 | 47 |
| 1106 Bechtel St | 0.60mi | 2/1.0 (+1) | 760 (-5%) | 17mo | $80,000 | $105 | 45 |
Match score weights: distance 35% · size 25% · config 20% · recency 20%. Top-matched comps best support the ARV.
Projected returns pro-forma
-3.0% appreciation · 3.0% rent growth · sell at horizon
- IRR
- 31.3%
- Equity multiple
- 2.32×
- Total profit
- $18,419
- Equity at exit
- $7,455
- IRR
- 38.5%
- Equity multiple
- 4.59×
- Total profit
- $50,282
- Equity at exit
- $4,323
Cash invested: $14,000 (down + closing). Projections, not guarantees.
Landlord ↔ Tenant lean methodology
- Overall (STATE)
- 62 Landlord-Friendly
- State Pennsylvania
- 62 Landlord-Friendly · EVEN
- County
- — inherits STATE
- City
- — inherits STATE
ZIP-level market 15061
- Home prices YoY
- -28.6%
- Active inventory
- 78
- Price-to-rent
- 4.2×
Monthly cashflow live
- Estimated rent
- $1,002 high interval (Pro) →
- Mortgage (P&I)
- −$262
- Tax from tax record
- −$92 /mo · $1,109/yr
- Insurance
- −$21
- HOA
- −$0
- Vacancy / Maint / Mgmt
- −$210
- Net cashflow
- $416
Break-even live
UW: 25.0% down · 7.5% · 30yr · 1.5% tax · 5.0% vac · 8.0% maint · 8.0% mgmt
Financing live
Cash to close
- Down payment
- $12,500
- Closing costs
- $1,500
- Reserves months
- —
- Total cash needed
- —
Loan-product check · same deal, 3 products live
Conventional
25% down · 7.5% · 30yr
- Down + closing
- —
- Monthly P&I
- —
- Monthly cashflow
- —
- DSCR
- —
- Eligible?
- —
Personal DTI + credit; lowest rate.
DSCR
20% down · 8.5% · 30yr
- Down + closing
- —
- Monthly P&I
- —
- Monthly cashflow
- —
- DSCR
- —
- Eligible?
- —
No personal income docs; deal must DSCR.
Hard money
10% down · 12.0% · 12mo
- Down + closing
- —
- Monthly P&I
- —
- Monthly cashflow
- —
- DSCR
- —
- Eligible?
- —
Short-term bridge; refi at stabilization.
Rent comps 6 comps
| Address | Beds | Baths | Sqft | Rent | $/sqft | DOM | Units | Dist |
|---|---|---|---|---|---|---|---|---|
| 220 Marshall Rd Monaca, PA | 1.0 | 1.0 | 847 | $1,262 | $1.49 | 1d | 1 | 0.88mi |
| 635 3rd Ave Unit 2 Freedom, PA | 1.0 | 1.0 | 600 | $795 | $1.32 | 23d | 1 | 0.98mi |
| 635 3rd Ave Freedom, PA | 2.0 | 1.0 | 1050 | $950 | $0.90 | 1d | 1 | 0.99mi |
| 243 Pennsylvania Ave Unit 1 Rochester, PA | 2.0 | 1.0 | 1000 | $1,100 | $1.10 | 14d | 1 | 1.08mi |
| 230 W Madison St Unit 6 Rochester, PA | 2.0 | 1.0 | 975 | $1,100 | $1.13 | 1d | 1 | 1.25mi |
| 1401 4th Ave #1 Freedom, PA | 2.0 | 1.0 | 955 | $850 | $0.89 | 3d | 1 | 1.43mi |
Listing history 6 events
-
2026-06-18days on market $50,000 Active 6 DOM
-
2026-06-17days on market $50,000 Active 5 DOM
-
2026-06-16days on market $50,000 Active 4 DOM
-
2026-06-15days on market $50,000 Active 3 DOM
-
2026-06-13remarks 367-char remark
-
2026-06-13$50,000 Active 1 DOM
ⓘ Source: listings_history table (triggers on properties + properties_extension) + one-shot
backfill from property_details.listing_events for pre-trigger history.
Tax reassessment forecast PA · Partial reset (capped growth)
- Current annual tax
- $1,109 · $92/mo
- Projected year-2 tax
- $1,109 · $92/mo
- Expected delta
- $0/yr ($0/mo · 0.0%)
ⓘ Screening estimate from a state-policy table — verify with the county assessor before closing.
Climate risk First Street
- Flood 6/10 Major FEMA zone X (unshaded) · 27% chance over 30 yrs
- Wildfire 1/10 Low
- Heat 4/10 Moderate 8 d/yr ≥97°F today · 19 d/yr by 30 yrs out
- Wind 2/10 Low
- Air quality 3/10 Moderate 2 unhealthy d/yr today · 4 by 30 yrs out
Nearby sold comps map
Loading sold comps map…
Walkable amenities ~0.75 mi
Loading nearby amenities…
Taxation est. · year 1
- Rental income
- $12,020
- − Mortgage interest
- −$2,801
- − Property taxes
- −$1,109
- − Insurance
- −$250
- − Repairs & maintenance
- −$962
- − Management
- −$962
- − Depreciation
- −$1,455
- Taxable income
- $4,483
- Est. tax owed @ 24.0%
- −$1,076
- After-tax cash flow
- $3,915/yr
For passive investors: Depreciation is non-cash, so a rental often shows a tax loss while cash-flowing — sheltering income. Rental losses are passive: they offset passive income freely, and up to $25,000/yr can offset ordinary (W-2) income if you actively participate and your MAGI is under $100k (phasing out to $0 by $150k); unused losses carry forward. On sale, claimed depreciation is recaptured at up to 25%, and gains may owe capital-gains tax (a 1031 exchange can defer both). Figures are a year-1 estimate at your 24.0% rate — not tax advice; consult a CPA.
Schools (NCES district)
No district data.
Livability — Monaca
- Score
- 81/100
- State rank
- #182
- US rank
- #1516
Category grades
Schools grade is shown separately in the Schools card above.
Census & demographics
- Census place
- Monaca, PA
- County
- Beaver County · 116,001 people
- City population
- 12,413
- Metro
- Pittsburgh, PA
- Population (ZIP)
- 12,413
- Household income
- $73,010
- Rent vs Own
- Severe rent burden
- 123.0
Population outlook (Beaver County) Hauer SSP2
- Today (2025)
- 164,976 people
- By 2030
- 161,449 · -2.1%
- By 2040
- 151,752 · -8.0%
- By 2050
- 141,155 · -14.4%
- By 2075
- 118,142 · -28.4%
- By 2100
- 91,740 · -44.4%
Race, ethnicity, and origin ACS 2023
- Neighborhood character
- Predominantly White (88%)
- Race & ethnicity
- White 88% Two or more races 5% Black 5% Hispanic / Latino 3%
- Common ancestry
- Romanian 6% Serbian 3% Slovak 1%
- Foreign-born
- 2% · Canada
- Languages at home
- 97% English-only · Spanish 1%
Political lean MEDSL · Beaver
- 2024 margin
- Strong R (+20.7) · D 39.2% · R 59.9%
- 2008→2024 swing
- -17.9pp toward R · 2008: -2.8pp · 2024: -20.7pp
- All cycles
- 2024: R+20.7 2020: R+17.7 2016: R+20.1 2012: R+6.6 2008: R+2.8
Not yet ingested
- Civics
- —
Market trends
- HPI YoY
- ▼ -93.11%
- Current HPI
- 232.6703
- Rent YoY
- —
- Metro
- Pittsburgh, PA
- State GDP YoY
- ▲ 1.68%
- F500 in state
- 34
Industry mix (Fortune 500 HQ in PA)
| Industry | F500 HQs | Revenue |
|---|---|---|
| Healthcare | 2 | $309B |
|
||
| Insurance | 2 | $27B |
|
||
| Telecommunications / Media | 1 | $124B |
|
||
| Industrial Distribution | 1 | $22B |
|
||
| Financial Services | 1 | $20B |
|
||
| Chemicals / Materials | 1 | $18B |
|
||
Price history
+455.6% since first listed2 events — show timeline
- 2026-06-12 Listed $50,000 West Penn MLS
- 2005-03-28 Sold (Public Records) $9,000 Public Records
Property tax history
+4.6%/yrLatest (2026): $1,109 · +4.3% YoY. Source: county tax records.
Cash-flow waterfall
monthlySold comps — $/sqft
last 12 mo · ≤1 miLoading sold comps…